. 2020 Nov 17;53(5):1108-1122.e5.
doi: 10.1016/j.immuni.2020.10.008. Epub 2020 Oct 20.

Plasma Proteomics Identify Biomarkers and Pathogenesis of COVID-19

Affiliations

Plasma Proteomics Identify Biomarkers and Pathogenesis of COVID-19

Ting Shu et al. Immunity. .

Abstract

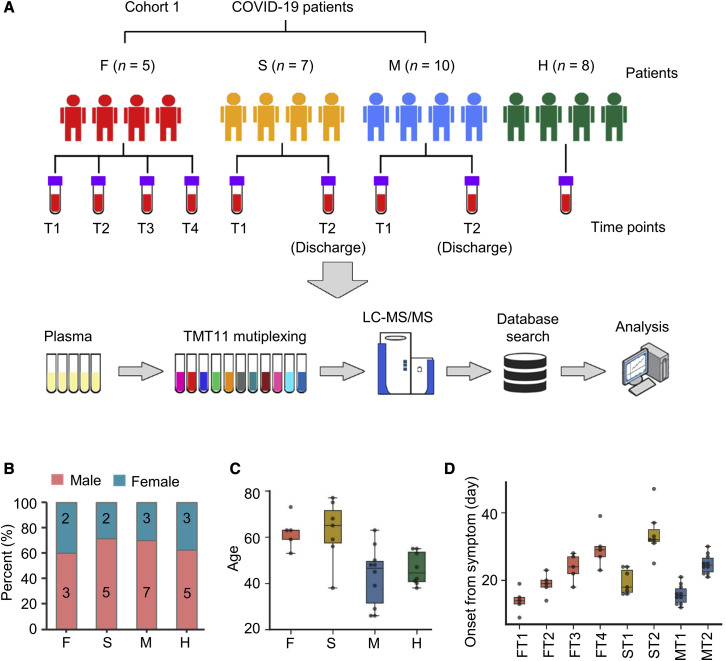
The coronavirus disease 2019 (COVID-19) pandemic is a global public health crisis. However, little is known about the pathogenesis and biomarkers of COVID-19. Here, we profiled host responses to COVID-19 by performing plasma proteomics of a cohort of COVID-19 patients, including non-survivors and survivors recovered from mild or severe symptoms, and uncovered numerous COVID-19-associated alterations of plasma proteins. We developed a machine-learning-based pipeline to identify 11 proteins as biomarkers and a set of biomarker combinations, which were validated by an independent cohort and accurately distinguished and predicted COVID-19 outcomes. Some of the biomarkers were further validated by enzyme-linked immunosorbent assay (ELISA) using a larger cohort. These markedly altered proteins, including the biomarkers, mediate pathophysiological pathways, such as immune or inflammatory responses, platelet degranulation and coagulation, and metabolism, that likely contribute to the pathogenesis. Our findings provide valuable knowledge about COVID-19 biomarkers and shed light on the pathogenesis and potential therapeutic targets of COVID-19.

Keywords: COVID-19; SARS-CoV-2; biomarkers; plasma; proteomics.


Conflict of interest statement

Declaration of Interests Wuhan Institute of Virology and Wuhan Jinyintan Hospital on behalf of the authors X. Zhou., Y.S., D.-Y.Z., Y.X., Y.Q., T.S., D.W., and M.H. have filed three Chinese patent applications (202010478392.8, 202010476095.X, and 202010476805.9) related to the biomarkers for predicting the different outcomes of COVID-19 patients.

Figures

None
Graphical abstract
Figure 1
Figure 1
Study Design and Patients (A) Overview of blood samples collection from COVID-19 patients (cohort 1), including F (n = 5), S (n = 7), M (n = 10) patients, and H volunteers (n = 8). T1–T4 mean different sample collection time points. The workflow for processing the proteomic data were shown, including the plasma separation, TMT 11-plex labeling, LC-MS/MS analysis, database search, and further computational analyses. (B) The gender distribution of COVID-19 patients and H volunteers. The x axis represents different groups of cases, and the y axis represents the ratio of different genders (female or male). (C) The age distribution of different groups. (D) The number of days between symptom onset and the sample collection with different time points. Data points indicate the data of single patient at each time point and are presented as median with interquartile range (FT1–FT4, n = 5; ST1 and ST2, n = 7; MT1 and MT2, n = 10). The center line within each box shows the median, and the top and bottom of each box represent the 75th and 25th percentile values, respectively. The upper and lower whiskers extend from the hinge to the largest and smallest value no further than 1.5 times the distance between the first and third quartiles, respectively. See also Table S1.
Figure 2
Figure 2
Proteomic Profiling of Plasma from COVID-19 Patients and H Volunteers (A and B) The distribution of numbers of quantified (A) peptides and (B) proteins in the 62 plasma samples. Error bars represent multiple independent samples, F (n = 5), S (n = 7), M (n = 10), H (n = 8). (C) The distribution of MS/MS spectral counts of quantified peptides. (D) The distribution of peptide numbers of quantified proteins. (E) The distribution of protein numbers in plasma samples. (F) The heatmap of the finally reserved proteins. See also Figure S1 and Tables S2 and S3.
Figure 3
Figure 3
Proteomic Alternations Associated with Clinical Symptoms of F and S Cases (A) GO-based enrichment analysis of DEPs shown in the term of biological processes (two-sided hypergeometric test; p < 0.001) and the number of counts (m > 10). GO terms were sorted by E-ratio. (B) KEGG-based enrichment analysis of DEPs (two-sided hypergeometric test; p < 0.001) and the number of counts (m > 5). KEGG terms were sorted by E-ratio. (C and D) Plasma levels of proteins in each group in relation to H group and the associated p values in the terms of platelet degranulation (C) and complement and coagulation cascades (D). (E–G) Clinical data of D-dimer (E), prothrombin time (PT) (F), and activated partial thromboplastin time (APTT) (G) (y axis) in the indicated groups (x axis). Data points indicate the data of single patient at each time point and are presented as median with interquartile range (FT1–FT4, n = 5; ST1 and ST2, n = 7; MT1 and MT2, n = 10). The center line within each box shows the median, and the top and bottom of each box represent the 75th and 25th percentile values, respectively. The upper and lower whiskers extend from the hinge to the largest and smallest value no further than 1.5 times the distance between the first and third quartiles, respectively. See also Figure S2 and Tables S4, S5, and S6.
Figure 4
Figure 4
Identification of Potential Biomarker Combinations for the Classification of COVID-19 Patients and H Volunteers by Using a Machine-Learning Strategy (A) The workflow of POC-19, including DPR, CBS, and FBD to prioritize highly potential biomarker combinations. In the step of FBD, LASSO and ridge regression penalties in PLR were adopted for model training and parameter optimization. (B) From the 5-fold cross-validation, AUC values were calculated for the classification of F, S, and M COVID-19 patients and H volunteers, respectively. (C) The confusion matrix of the 4-protein combination. (D) The PCA analysis of the 4 proteins among different plasma samples. (E) Overview of blood samples collection from cohort 2, including F (n = 9), S (n = 6), and M (n = 6) patients and H volunteers (n = 5). (F) AUC values were calculated for the classification of F, S, and M COVID-19 patients and H volunteers based on cohort 2. (G) The confusion matrix of the 4-protein combination in cohort 2. (H) The PCA analysis of the 4 proteins among different plasma samples from cohort 2. See also Figure S3 and Tables S2 and S7.
Figure 5
Figure 5
Determination of Biomarker Combinations for Predicting Different COVID-19 Outcomes (A–C) The receiver operating characteristic (ROC) curve (A), confusion matrix (B), and PCA plot (C) for the prediction of S to F outcome. (D–F) The ROC curve (D), confusion matrix (E), and PCA plot (F) for the prediction of M to S outcome. (G–I) The ROC curve (G), confusion matrix (H), and PCA plot (I) for the prediction of COVID-19 patients cured from the disease. See also Figures S4 and S5 and Table S7.
Figure 6
Figure 6
Serological Validation of COVID-19 Biomarkers (A) Overview of blood samples collection from cohort 3, including F (n = 40), S (n = 40), and M (n = 40) patients and H volunteers (n = 40). (B) The number of days between symptom onset and the sample collection with different time points. (C–G) Plasma levels of the indicated proteins from the samples of cohort 3 were detected via ELISA. Data points indicate the data of single patient that are presented as median with interquartile range (F, n = 40; S, n = 40; M, n = 40; H, n = 40). The center line within each box shows the median, and the top and bottom of each box represent the 75th and 25th percentile values, respectively. The upper and lower whiskers extend from the hinge to the largest and smallest value no further than 1.5 times the distance between the first and third quartiles, respectively. Data were analyzed by unpaired two-sided Welch’s t test. p < 0.05; ∗∗p < 0.01; ∗∗∗p < 0.001. See also Tables S8 and S9.
Figure 7
Figure 7
A Plasma Protein Regulatory Network Associated with COVID-19 In the network, the 173 DEPs were classified into 9 groups on the basis of their major functions, including immune cell migration, complement activation, metabolic process, platelet/neutrophil degranulation, blood coagulation, cell cycle/proliferation, phagocytosis/endocytosis, transport/cell adhesion, and other immune response. The color-coded circular boxes represent the 11 proteins in the four biomarker combinations as indicated at the upper right corner.

Comment in

References

    1. Banères-Roquet F., Gualtieri M., Villain-Guillot P., Pugnière M., Leonetti J.P. Use of a surface plasmon resonance method to investigate antibiotic and plasma protein interactions. Antimicrob. Agents Chemother. 2009;53:1528–1531. - PMC - PubMed
    1. Batth T.S., Francavilla C., Olsen J.V. Off-line high-pH reversed-phase fractionation for in-depth phosphoproteomics. J. Proteome Res. 2014;13:6176–6186. - PubMed
    1. Bengtsson A.A., Sturfelt G., Lood C., Rönnblom L., van Vollenhoven R.F., Axelsson B., Sparre B., Tuvesson H., Ohman M.W., Leanderson T. Pharmacokinetics, tolerability, and preliminary efficacy of paquinimod (ABR-215757), a new quinoline-3-carboxamide derivative: studies in lupus-prone mice and a multicenter, randomized, double-blind, placebo-controlled, repeat-dose, dose-ranging study in patients with systemic lupus erythematosus. Arthritis Rheum. 2012;64:1579–1588. - PubMed
    1. Björk P., Björk A., Vogl T., Stenström M., Liberg D., Olsson A., Roth J., Ivars F., Leanderson T. Identification of human S100A9 as a novel target for treatment of autoimmune disease via binding to quinoline-3-carboxamides. PLoS Biol. 2009;7:e97. - PMC - PubMed
    1. Calderone A., Castagnoli L., Cesareni G. mentha: a resource for browsing integrated protein-interaction networks. Nat. Methods. 2013;10:690–691. - PubMed

MeSH terms