. 2020 Dec 3;27(6):890-904.e8.
doi: 10.1016/j.stem.2020.10.005. Epub 2020 Oct 21.

Human Lung Stem Cell-Based Alveolospheres Provide Insights into SARS-CoV-2-Mediated Interferon Responses and Pneumocyte Dysfunction

Affiliations

Human Lung Stem Cell-Based Alveolospheres Provide Insights into SARS-CoV-2-Mediated Interferon Responses and Pneumocyte Dysfunction

Hiroaki Katsura et al. Cell Stem Cell. .

Abstract

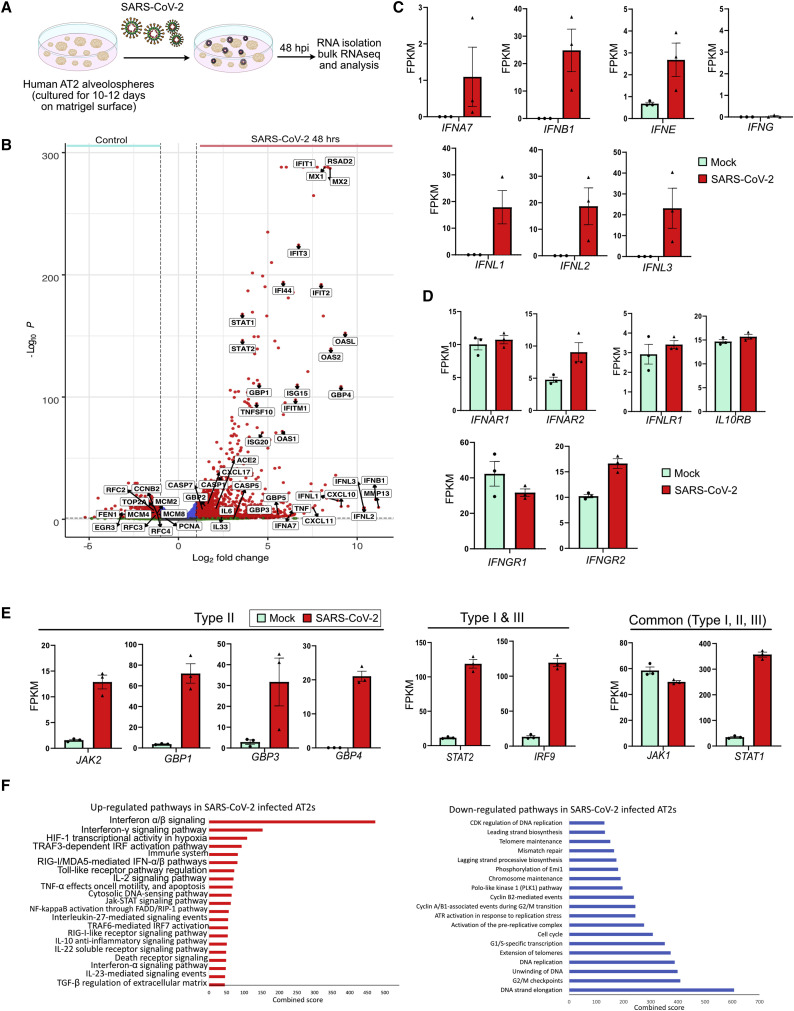
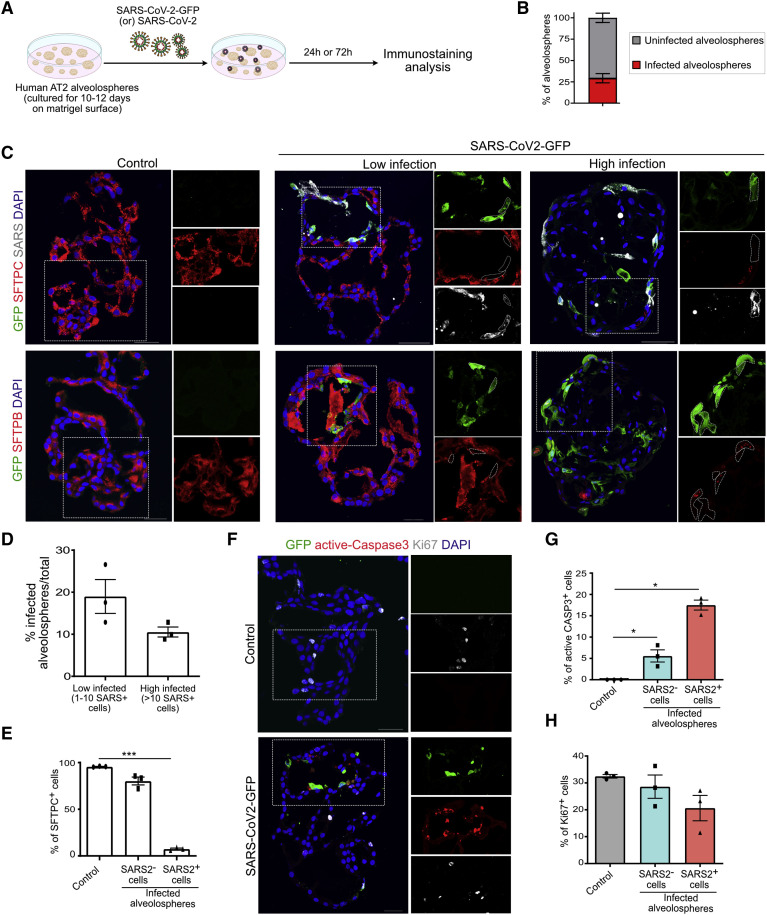
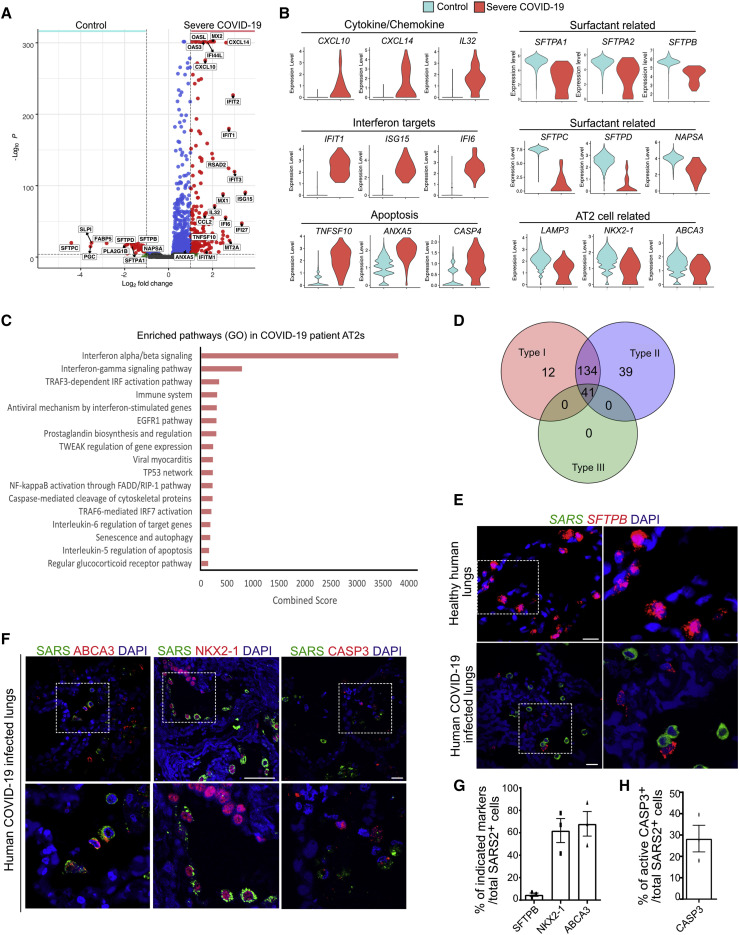
Coronavirus infection causes diffuse alveolar damage leading to acute respiratory distress syndrome. The absence of ex vivo models of human alveolar epithelium is hindering an understanding of coronavirus disease 2019 (COVID-19) pathogenesis. Here, we report a feeder-free, scalable, chemically defined, and modular alveolosphere culture system for the propagation and differentiation of human alveolar type 2 cells/pneumocytes derived from primary lung tissue. Cultured pneumocytes express the severe acute respiratory syndrome coronavirus 2 (SARS-CoV-2) receptor angiotensin-converting enzyme receptor type-2 (ACE2) and can be infected with virus. Transcriptome and histological analysis of infected alveolospheres mirror features of COVID-19 lungs, including emergence of interferon (IFN)-mediated inflammatory responses, loss of surfactant proteins, and apoptosis. Treatment of alveolospheres with IFNs recapitulates features of virus infection, including cell death. In contrast, alveolospheres pretreated with low-dose IFNs show a reduction in viral replication, suggesting the prophylactic effectiveness of IFNs against SARS-CoV-2. Human stem cell-based alveolospheres, thus, provide novel insights into COVID-19 pathogenesis and can serve as a model for understanding human respiratory diseases.

Keywords: ACE2; ARDS; SARS-CoV-2; cytokine storm; interferons; organoids; pneumocytes; protease; respiratory cells; surfactants.


Conflict of interest statement

Declaration of Interests A patent application (PCT/US20/53158) related to this work has been filed. H.K. and P.R.T. are listed as co-inventors on this application. P.R.T. serves as a consultant for Cellarity and Surrozen.

Figures

None
Graphical abstract
Figure 1
Figure 1
Establishment of Chemically Defined Human Lung Alveolosphere Culture System (A) Schematic representation of human alveolosphere cultures and passaging in SFFF medium. (B) Representative images of human alveolospheres from different passages. Scale bar: 100 μm. (C) Quantification of the colony formation efficiency (CFE) of human alveolospheres at different passages. (D) Immunostaining for SFTPC (green), SFTPB (red), and AGER (gray) (left panel) or SFTPB (green), HTII-280 (red), and DC-LAMP (gray) (right panel) at P1 and P3 human alveolospheres cultured in SFFF medium for 14 days. (E) Immunostaining for SFTPC (green) and HTII-280 (red) in cells dissociated from alveolospheres at P2 (top) and P8 (bottom). (F) Quantification of HTII-280+ SFTPC+ cells/total 4′,6-diamidino-2-phenylindole (DAPI)+ cells derived from alveolospheres dissociation from P2 (orange) and P8 (blue). (G) Schematic representation of human AT2 to AT1 differentiation in alveolospheres. AT2s were cultured in SFFF medium for 10 days, followed by culture in ADM for 14 days. (H) Immunostaining for SFTPC (green) and AGER (red) in human alveolospheres cultured under ADM condition for 14 days. Scale bars: 100 μm (B); 50 μm (D); 20 μm (E); 20 μm (H). DAPI (blue) shows nuclei in (D), (E), and (H). Data are presented as mean ± SEM.
Figure 2
Figure 2
Alveolosphere-Derived AT2s Express Viral Receptors and Are Permissive to SARS-CoV-2 Infection (A) Immunostaining for ACE2 (green) (left panel) and TMPRSS2 (green) (right panel) with HTII-280 (red) and AGER (gray). (B) Co-staining for epithelial cell membrane marker EPCAM (green) with TMPRSS2 (red) and ACE2 (gray). (C) Co-staining for ACE2 (red) (left panel) and TMPRSS2 (red) (right panel) with polarity marker ZO1 (green) and HTII-280 (gray). (D) Co-immunostaining for ACE2 (green) (left panel) and TMPRSS2 (green) (right panel) with HTII-280 (red) in AT2s dissociated from P5-cultured alveolospheres. (E) Co-immunostaining for ACE2 (green), HTII-280 (red), and TMPRSS2 (gray) in AT2s from alveolospheres. (F) Quantification of percent ACE2+/total HTII-280+ cells (left) and percent TMPRSS2+/total HTII-280+ cells. (G) Immunostaining for ACE2 (red) (left panel) and TMPRSS2 (red) (left panel) with HTII-280 (green) and AGER (gray) in alveolospheres cultured in ADM for 14 days. (H) Schematic representation for SARS-CoV-2-GFP infection in human alveolospheres. AT2s were cultured on Matrigel-coated plates in SFFF medium for 10–12 days, followed by infection with SARS-CoV-2 virus and RNA isolation or histological analysis after different time points. (I) Representative wide-field microscopy images from control and SARS-CoV-2-GFP-infected human lung alveolospheres. (J) Quantification of low-infected (1–10 GFP+ cells) and high-infected (10 or more GFP+ cells) alveolospheres 24, 48, and 72 h post SARS-CoV-2GFP virus infection. (K) Viral titers were measured by plaque assays using media collected from lung alveolosphere cultures at 24, 48, and 72 h post-infection. (L) SARS-CoV-2 negative-strand-specific reverse transcription followed by qRT-PCR targeting two different genomic loci (1202–1363 and 848–981) in mock- (blue) and SARS-CoV-2-infected human alveolospheres at 72 h post-infection. Asterisks show p < 0.05. Scale bars: 30 μm (A, B, and C); 20 μm (D); and 20 μm (F). White box in merged image indicates region of single-channel images. All quantification data are presented as mean ± SEM.
Figure 3
Figure 3
Transcriptome Profiling Revealed Enrichment of IFN, Inflammatory, and Cell Death Pathways in SARS-CoV-2-Infected Pneumocytes (A) Schematic for SARS-CoV-2-GFP infection in human alveolospheres. AT2s cultured in SFFF medium were infected with SARS-CoV-2 virus followed by RNA isolation at 48 h after infection. (B) Volcano plot showing upregulated (right) and downregulated (left) genes in alveolospheres cultured in SFFF infected with SARS-CoV-2. DESeq2 was used to perform statistical analysis. (C–E) Expression levels of listed genes in mock- (green) and SARS-CoV-2-infected (red) human alveolospheres detected by bulk RNA-seq. IFN ligands (C), receptors (D), as well as downstream targets (E), are shown. Data are presented as fragments per kilobase million (FPKM) mean ± SEM. (F) Pathway enrichment analysis of upregulated (left, red) and downregulated (right, blue) genes in SARS-CoV-2-infected alveolospheres. Scale shows the combined score obtained from BioPlanet database through Enrichr.
Figure 4
Figure 4
SARS-CoV-2 Infection Induces Loss of Surfactants and AT2 Death (A) Schematic for SARS-CoV-2-GFP infection in human alveolospheres. Alveolospheres were cultured in SFFF medium, infected with SARS-CoV-2 virus, and collected for histological analysis. (B) Quantification of the percentage of SARS-CoV-2-infected alveolospheres. (C) Immunostaining for GFP (green), SFTPC (red), and SARS (gray) (top panel) and GFP (green) and SFTPB (red) (bottom panel) in control, “low,” and “high” SARS-CoV-2-GFP-infected human lung alveolospheres at 72 h post-infection. Scale bar: 50 μm. (D) Quantification of low-infected (1–10 SARS-CoV-2+ cells) and high-infected (10 or more SARS-CoV-2+ cells) alveolospheres. (E) Quantification of SFTPC+ cells in uninfected control and SARS and SARS+ cells in virus-infected alveolospheres. (F) Immunostaining for GFP (green) in combination with the apoptotic marker active caspase 3 (red) and proliferation marker Ki67 (gray) in control and SARS-CoV-2-GFP-infected alveolospheres. Scale bar: 30 μm. (G and H) Quantification of active caspase-3 (CASP3)+ (G) and Ki67+ (H) cells in uninfected control (gray), SARS-CoV-2 cells (blue), and SARS-CoV-2+ cells in infected alveolospheres. The white box in the merged image indicates the region of single-channel images. DAPI stains nuclei (blue). All quantification data are presented as mean ± SEM.
Figure 5
Figure 5
Transcriptome-wide Similarities in AT2s from SARS-CoV-2-Infected Alveolospheres and COVID-19 Lungs (A) Volcano plot shows specific genes enriched in AT2s in bronchioalveolar lavage fluid from severe COVID-19 patients (right) and AT2s isolated from healthy lungs (control) (left). Wilcoxon rank-sum test was used for the statistical analysis. (B) Violin plots show gene expression of cytokines and chemokines (CXCL10, CXCL14, and IL32), interferon targets (IFIT1, ISG15, and IFI6), apoptosis targets (TNFSF10, ANXA5, and CASP4), surfactant-related targets (SFTPC, SFTPD, and NAPSA), and AT2-related targets (LAMP3, NKX2-1, and ABCA3) in AT2s derived from control and severe COVID-19 patient lungs. (C) Pathway enrichment analysis shows signaling pathways enriched in AT2s derived from severe COVID-19 patients. Scale shows combined score obtained from BioPlanet database through Enrichr. (D) Venn diagram shows enrichment of upregulated transcripts associated with different IFN pathways in AT2s derived from COVID-19 human lungs. (E) RNA in situ hybridization for SARS-CoV-2 (green) and SFTPB (red) on control and COVID-19 lung sections. (F) Co-immunostaining for SARS-CoV-2 (green), ABCA3 (red) (left); SARS-CoV2 (green) and NKX2-1 (red) (middle); and active caspase-3 (CASP3) (red) (right) on COVID-19 lung sections. DAPI stains nuclei. Scale bars: 20 μm and 60 μm (NKX2-1). (G) Quantification of SFTPB+ cells, NKX2-1+ cells, and ABCA3+ cells in total SARS-CoV-2+ cells. (H) Quantification of active CASP3+ cells in total SARS-CoV-2+ cells. Data are presented as mean ± SEM.
Figure 6
Figure 6
IFN Treatment Recapitulates Features of SARS-CoV-2 Infection Including Cell Death and Loss of Surfactants in Alveolosphere-Derived AT2s (A) Schematic of experimental design. Human lung alveolospheres were treated with IFNα, IFNβ or IFNγ for 72 h. (B) Representative images of control and IFNα-, IFNβ-, and IFNγ-treated human lung alveolospheres. (C) Immunostaining for active-caspase-3 (green), HTII-280 (red), and SOX2 (gray) in control and IFN-treated alveolospheres. DAPI stains nuclei (blue). Scale bar: 30 μm. (D) Quantification of active caspase-3+ cells in total DAPI+ (per alveolosphere) cells in control and IFN-treated human alveolospheres. (E) Immunostaining for SFTPB (green), Ki67 (red), and AGER (gray) in controls and IFNα-, IFNβ-, or IFNγ-treated human alveolospheres. DAPI stains nuclei (blue). Scale bar: 30 μm. (F) Quantification of Ki67+ cells in total DAPI+ cells in control and IFN-treated human alveolospheres. p < 0.05; ∗∗p < 0.01; ∗∗∗p < 0.001. (G) Schematic of IFNs or IFN inhibitor treatment followed by SARS-CoV-2 infection. (H) Viral titers in control (gray), ruxolitinib-treated (orange), IFNα-treated (blue), and IFNγ-treated (green) cultures were determined by plaque assay using media collected from alveolosphere cultures at 24 and 48 h post-infection. Data are presented as mean ± SEM.

References

    1. Arenkiel B.R., Hasegawa H., Yi J.J., Larsen R.S., Wallace M.L., Philpot B.D., Wang F., Ehlers M.D. Activity-induced remodeling of olfactory bulb microcircuits revealed by monosynaptic tracing. PLoS One. 2011;6:e29423. - PMC - PubMed
    1. Barkauskas C.E., Cronce M.J., Rackley C.R., Bowie E.J., Keene D.R., Stripp B.R., Randell S.H., Noble P.W., Hogan B.L.M. Type 2 alveolar cells are stem cells in adult lung. J. Clin. Invest. 2013;123:3025–3036. - PMC - PubMed
    1. Barkauskas C.E., Chung M.-I., Fioret B., Gao X., Katsura H., Hogan B.L.M. Lung organoids: current uses and future promise. Development. 2017;144:986–997. - PMC - PubMed
    1. Barrat F.J., Crow M.K., Ivashkiv L.B. Interferon target-gene expression and epigenomic signatures in health and disease. Nat. Immunol. 2019;20:1574–1583. - PMC - PubMed
    1. Bartee E., Mohamed M.R., McFadden G. Tumor necrosis factor and interferon: cytokines in harmony. Curr. Opin. Microbiol. 2008;11:378–383. - PMC - PubMed

Publication types

MeSH terms