Comparative Study
. 2020 Dec 22;69(6):1039-1049.
doi: 10.33549/physiolres.934448. Epub 2020 Nov 2.

Comparison of pancreatic microcirculation profiles in spontaneously hypertensive rats and Wistar-kyoto rats by laser doppler and wavelet transform analysis

Affiliations
Comparative Study

Comparison of pancreatic microcirculation profiles in spontaneously hypertensive rats and Wistar-kyoto rats by laser doppler and wavelet transform analysis

Xiaohong Song et al. Physiol Res. .

Abstract

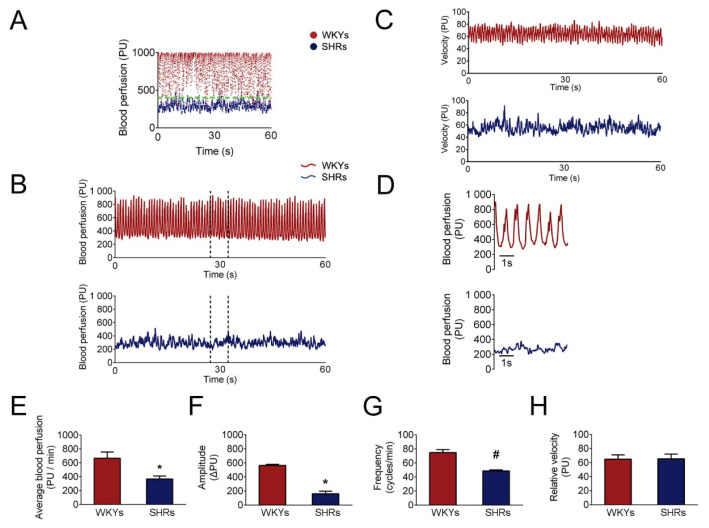
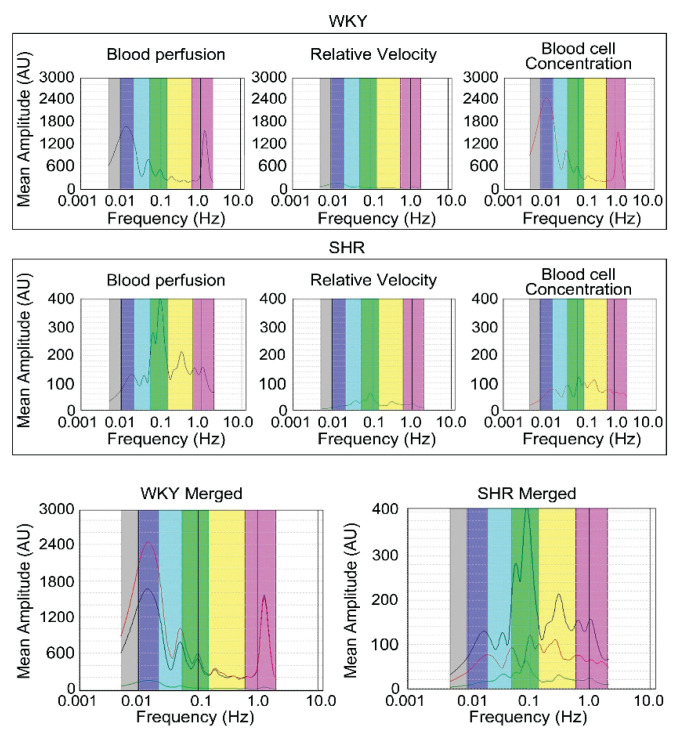
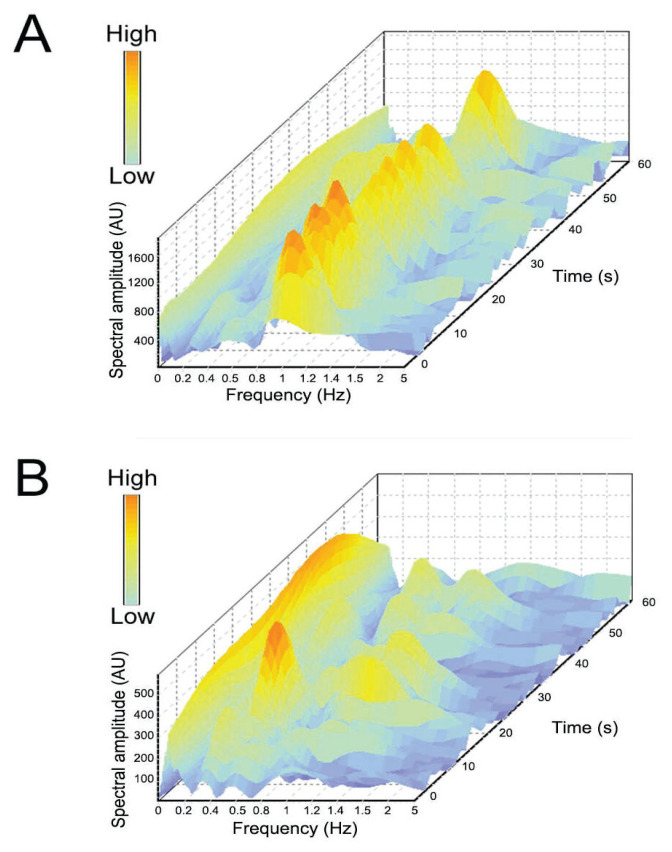
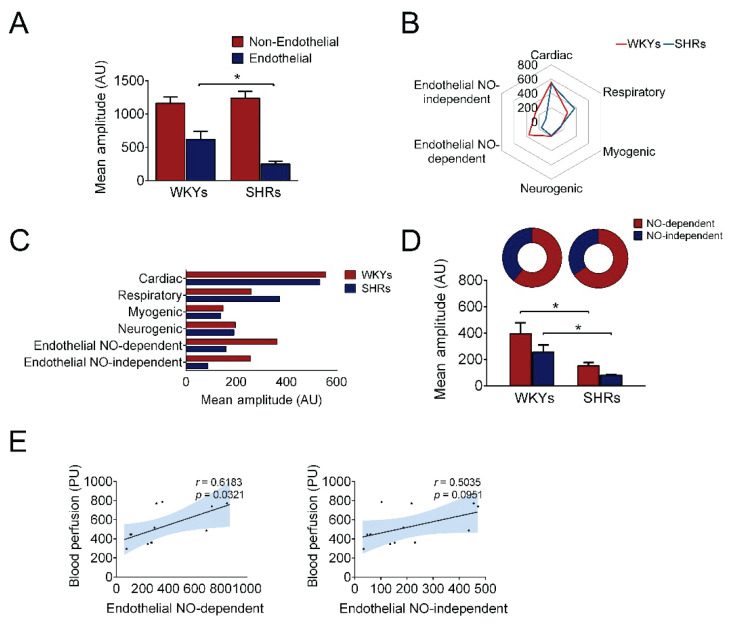
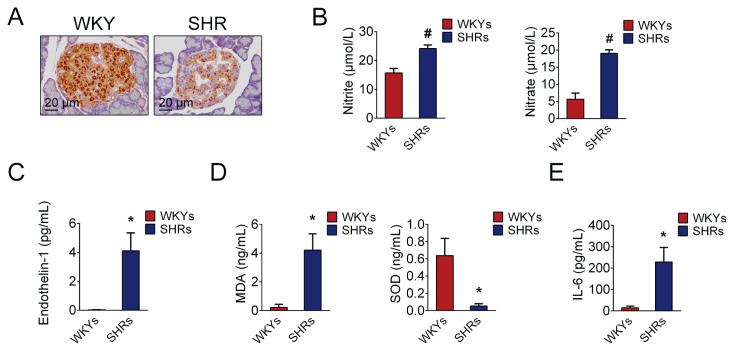
Pancreatic microcirculatory dysfunction emerged as a novel mechanism in the development of hypertension. However, the changes of pancreatic microcirculation profiles in hypertension remain unknown. Pancreatic microcirculatory blood distribution pattern and microvascular vasomotion of spontaneously hypertensive rats (SHRs) and Wistar Kyoto rats (WKYs) were determined by laser Doppler. Wavelet transform analysis was performed to convert micro-hemodynamic signals into time-frequency domains, based on which amplitude spectral scalograms were constructed. The amplitudes of characteristic oscillators were compared between SHRs and WKYs. The expression of eNOS was determined by immunohistochemistry, and plasma nitrite/nitrate levels were measured by Griess reaction. Additionally, endothelin-1, malondialdehyde, superoxide dismutase and interleukin-6 were determined by enzyme-linked immunosorbent assay. SHRs exhibited a lower scale blood distribution pattern with decreased average blood perfusion, frequency and amplitude. Wavelet transform spectral analysis revealed significantly reduced amplitudes of endothelial oscillators. Besides reduced expression of eNOS, the blood microcirculatory chemistry complements micro-hemodynamic profiles as demonstrated by an increase in plasma nitrite/nitrate, endothelin-1, malondialdehyde, interleukin-6 and a decrease of superoxide dismutase in SHRs. Here, we described abnormal pancreatic microcirculation profiles in SHRs, including disarranged blood distribution pattern, impaired microvascular vasomotion and reduced amplitudes of endothelial oscillators.


Conflict of interest statement

Conflict of Interest

There is no conflict of interest.

Figures

Fig. 1
Fig. 1
Pancreatic microcirculation profiles of WKYs and SHRs. (A) pancreatic microcirculatory blood distribution pattern of WKYs and SHRs. (B) pancreatic microvascular vasomotion of two groups of rats. (C) velocity of microvascular vasomotion. (D) 5 secs microvascular blood flow perfusion extracted from microcirculatory blood perfusion between dashed lines. (E) the average blood perfusion (PU/min) of microvascular vasomotion. (F) the amplitude (ΔPU) was calculated as the difference between minimum PU and maximum PU in microvascular oscillation. (G) the number of peaks in microvascular oscillation per min was defined as frequency (cycles/min). (H) microcirculatory velocity between two groups. Red dots and curves represent blood perfusion of WKYs. Blue dots and curves represent blood flow perfusion of SHRs. Green dashed line, the cut-off line of distribution pattern between SHRs and WKYs. PU, perfusion units. *P<0.05 compared with WKYs, #P<0.01 compared with WKYs.
Fig. 2
Fig. 2
Wavelet transform spectral analysis of pancreatic micro-hemodynamic signals. The mean amplitude (AU) - frequency (Hz) spectrum of microcirculatory blood perfusion, relative velocity and blood cell concentration was revealed by wavelet transform spectral analysis. The merged pancreatic microcirculatory scalogram of WKYs and SHRs was exhibited in the lower panel, the vertical lines represent the cut-off boundaries of different frequency intervals.
Fig. 3
Fig. 3
Three-dimensional time-frequency spectral scalogram of pancreatic microcirculation profiles of WKYs and SHRs. (A–B) three-dimensional time-frequency spectral scalogram of WKYs and SHRs were constructed based on the micro-hemodynamics data. The micro-vascular blood perfusion signaling was transformed by wavelet coefficients to illustrate coordinated time-frequency resolution in SHRs (A) and WKYs (B). Micro-hemodynamic variants including time (s), frequency (Hz) and spectral amplitude (AU) were located in the coordinate respectively. Color bar represents amplitude values.
Fig. 4
Fig. 4
Comparisons of characteristic spectral amplitudes of pancreatic microcirculation profiles. (A) the mean amplitudes (AU) of non-endothelial components and endothelial components of WKYs and SHRs. (B) radar plot illustrated varying amplitudes distribution of characteristic oscillators. The red line represents amplitudes of WKYs, the blue line represents amplitudes of SHRs. (C) the mean amplitudes (AU) of characteristic oscillators. (D) comparisons of NO-dependent and NO-independent endothelial components between WKYs and SHRs. The ratios of NO-dependent and NO-independent endothelial oscillators were shown in the upper pie chart. (E) correlations between endothelial oscillators and microcirculatory blood perfusion. *P<0.05 compared with WKYs.
Fig. 5
Fig. 5
Pancreatic microvascular endothelial cells dysfunction in SHRs. (A) immunohistochemical staining of endothelial nitric oxide synthase in WKYs and SHRs (× 400). (B) the levels of plasma nitrite/nitrate of WKYs and SHRs. (C) plasma endothelin-1 of WKYs and SHRs. (D) plasma MDA and SOD levels. (E) plasma IL-6 of WKYs and SHRs. *P<0.05 compared with WKYs, #P<0.01 compared with WKYs.

Similar articles

Cited by

References

    1. AHMEDA AF, RAE MG, ANWEIGI LM, AL OTAIBI MF, AL-MASRI AA, JOHNS EJ. The effect of superoxide dismutase enzyme inhibition on renal microcirculation of spontaneously hypertensive-stroke prone and Wistar rats. Physiol Res. 2018;67:535–541. doi: 10.33549/physiolres.933655. - DOI - PubMed
    1. ALEKSANDRIN VV, IVANOV AV, VIRUS ED, BULGAKOVA PO, KUBATIEV AA. Application of wavelet analysis to detect dysfunction in cerebral blood flow autoregulation during experimental hyperhomocysteinaemia. Lasers Med Sci. 2018;33:1327–1333. doi: 10.1007/s10103-018-2485-x. - DOI - PubMed
    1. CHAN AHW, SCHMID-SCHONBEIN GW. Pancreatic source of protease activity in the spontaneously hypertensive rat and its reduction during temporary food restriction. Microcirculation. 2019;26:e12548. doi: 10.1111/micc.12548. - DOI - PMC - PubMed
    1. DALYS GBD, COLLABORATORS H. Global, regional, and national disability-adjusted life-years (DALYs) for 315 diseases and injuries and healthy life expectancy (HALE), 1990–2015: a systematic analysis for the Global Burden of Disease Study 2015. Lancet. 2016;388:1603–1658. - PMC - PubMed
    1. De BOER MP, MEIJER RI, WIJNSTOK NJ, JONK AM, HOUBEN AJ, STEHOUWER CD, SMULDERS YM, ERINGA EC, SERNE EH. Microvascular dysfunction: a potential mechanism in the pathogenesis of obesity-associated insulin resistance and hypertension. Microcirculation. 2012;19:5–18. doi: 10.1111/j.1549-8719.2011.00130.x. - DOI - PubMed

Publication types