. 2021 Feb;160(3):781-796.
doi: 10.1053/j.gastro.2020.10.036. Epub 2020 Oct 29.

PD-1 Signaling Promotes Tumor-Infiltrating Myeloid-Derived Suppressor Cells and Gastric Tumorigenesis in Mice

Affiliations

PD-1 Signaling Promotes Tumor-Infiltrating Myeloid-Derived Suppressor Cells and Gastric Tumorigenesis in Mice

Woosook Kim et al. Gastroenterology. 2021 Feb.

Abstract

Background & aims: Immune checkpoint inhibitors have limited efficacy in many tumors. We investigated mechanisms of tumor resistance to inhibitors of programmed cell death-1 (PDCD1, also called PD-1) in mice with gastric cancer, and the role of its ligand, PD-L1.

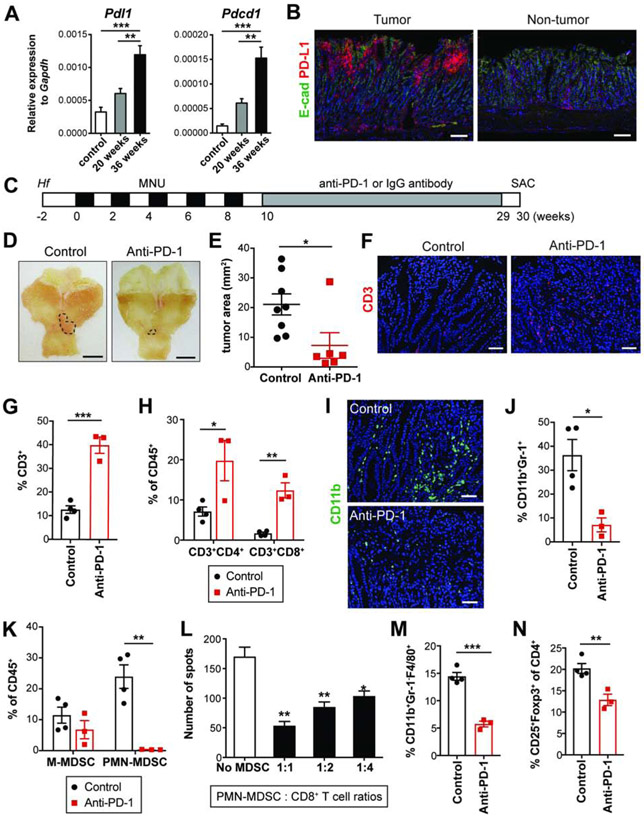
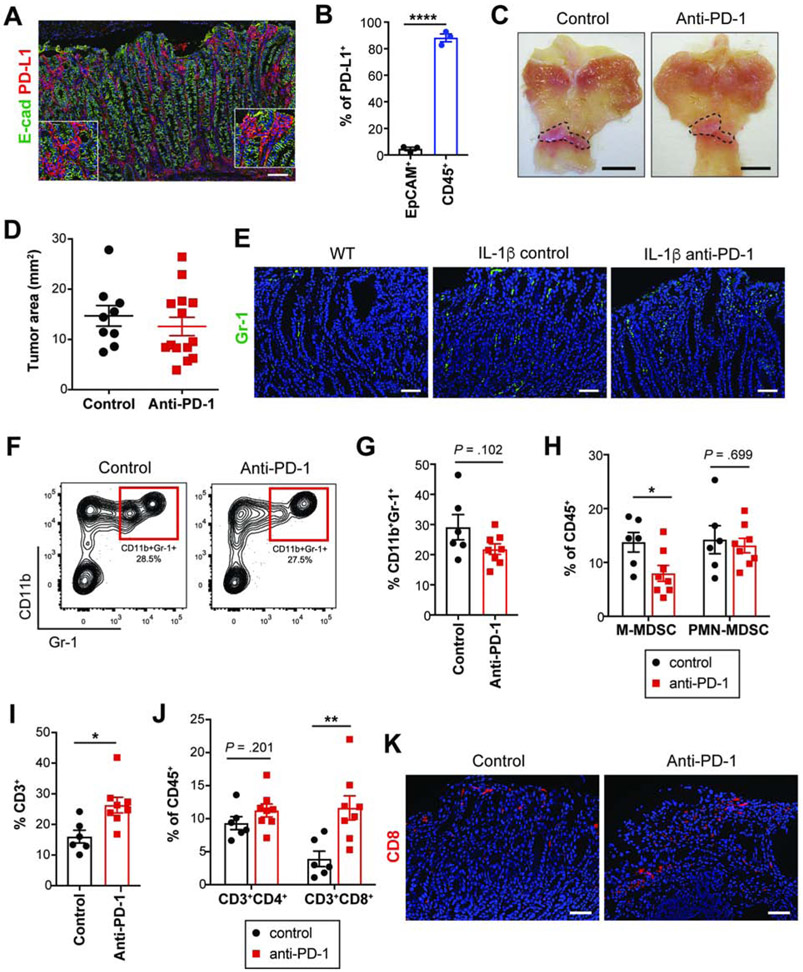
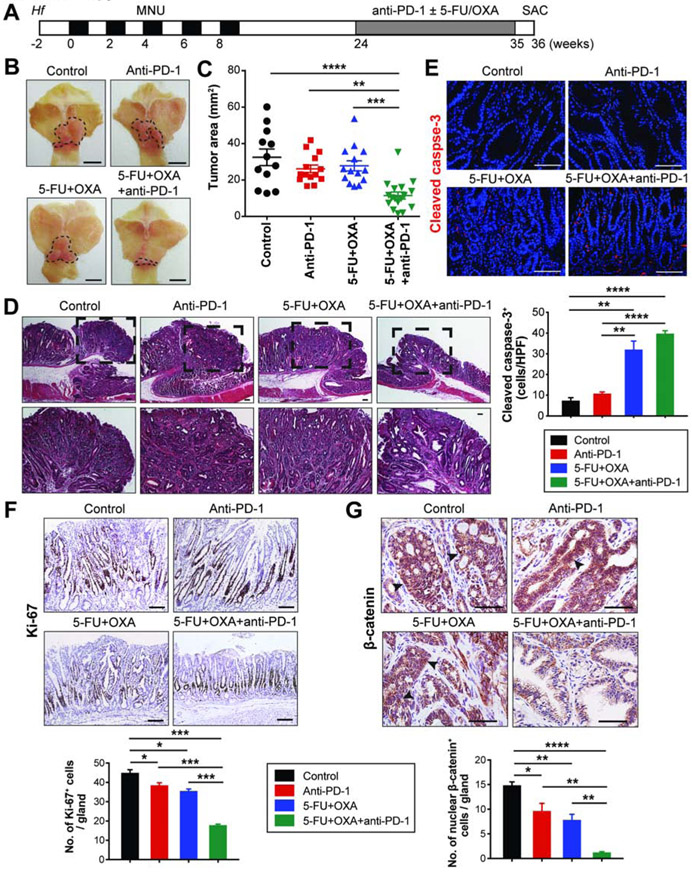
Methods: Gastrin-deficient mice were given N-methyl-N-nitrosourea (MNU) in drinking water along with Helicobacter felis to induce gastric tumor formation; we also performed studies with H/K-ATPase-hIL1B mice, which develop spontaneous gastric tumors at the antral-corpus junction and have parietal cells that constitutively secrete interleukin 1B. Mice were given injections of an antibody against PD-1 or an isotype control before tumors developed, or anti-PD-1 and 5-fluorouracil and oxaliplatin, or an antibody against lymphocyte antigen 6 complex locus G (also called Gr-1), which depletes myeloid-derived suppressor cells [MDSCs]), after tumors developed. We generated knock-in mice that express PD-L1 specifically in the gastric epithelium or myeloid lineage.

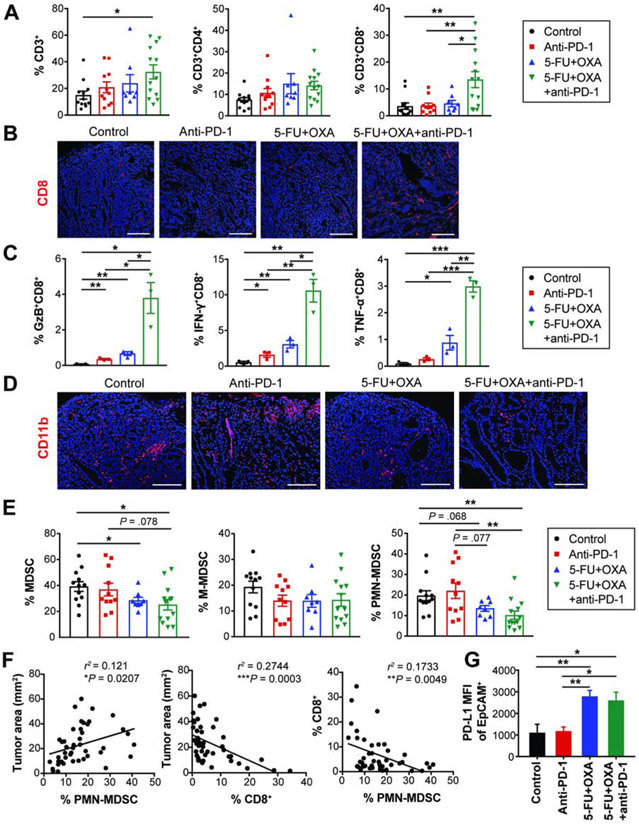
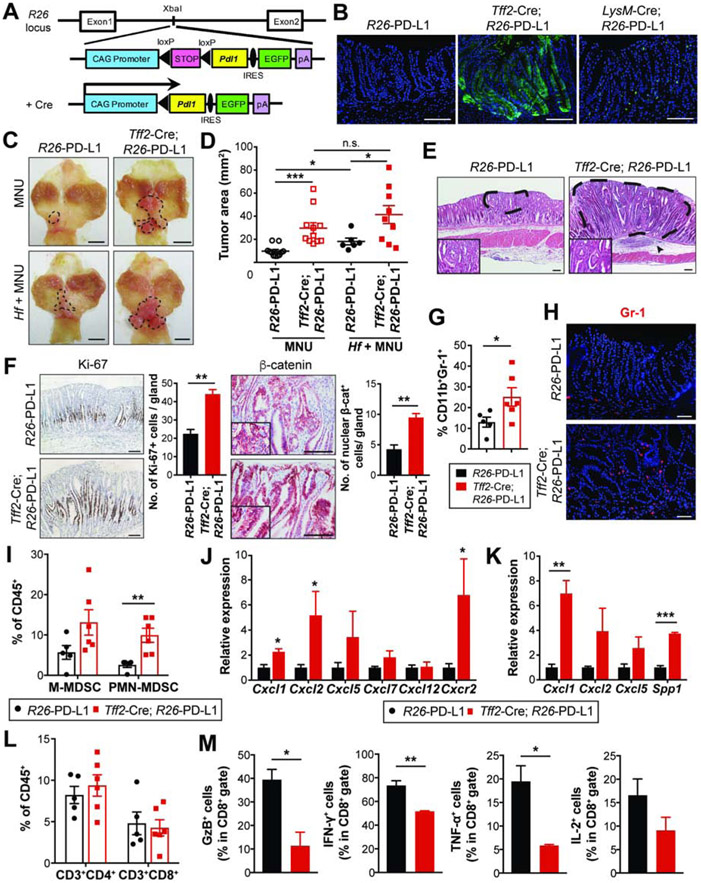
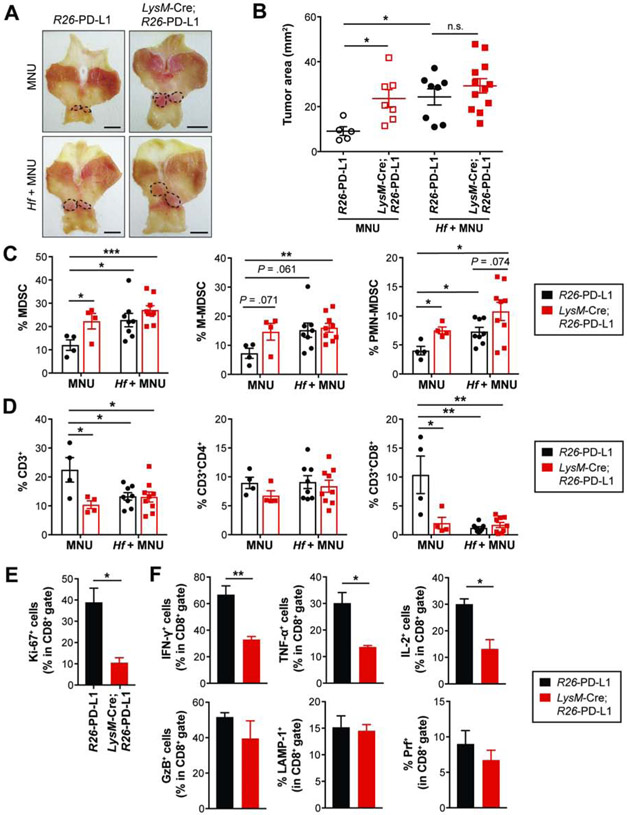
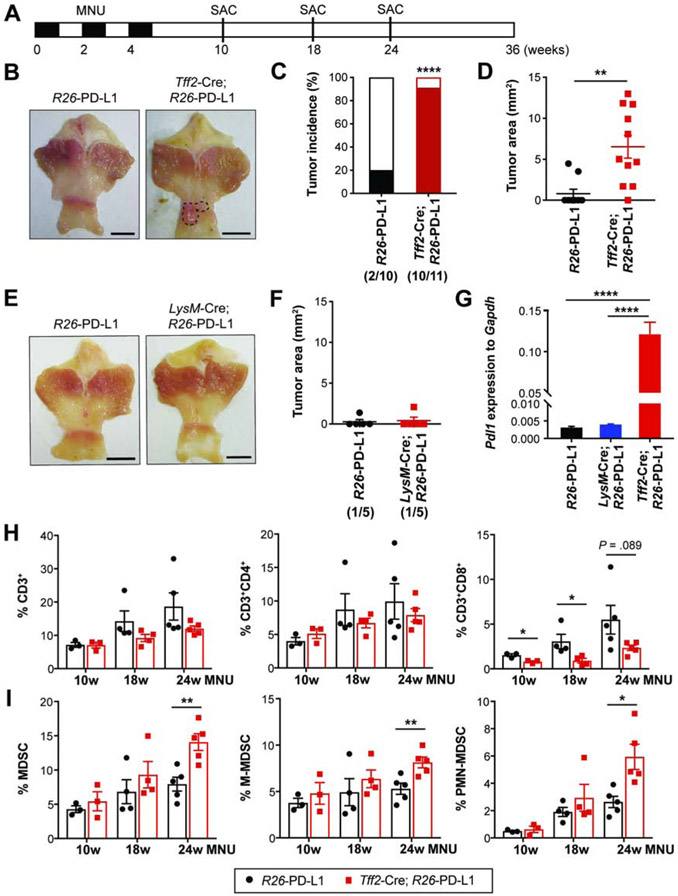
Results: When given to gastrin-deficient mice before tumors grew, anti-PD-1 significantly reduced tumor size and increased tumor infiltration by T cells. However, anti-PD-1 alone did not have significant effects on established tumors in these mice. Neither early nor late anti-PD-1 administration reduced tumor growth in the presence of MDSCs in H/K-ATPase-hIL-1β mice. The combination of 5-fluorouracil and oxaliplatin reduced MDSCs, increased numbers of intra-tumor CD8+ T cells, and increased the response of tumors to anti-PD-1; however, this resulted in increased tumor expression of PD-L1. Expression of PD-L1 by tumor or immune cells increased gastric tumorigenesis in mice given MNU. Mice with gastric epithelial cells that expressed PD-L1 did not develop spontaneous tumors, but they developed more and larger tumors after administration of MNU and H felis, with accumulation of MDSCs.

Conclusions: In mouse models of gastric cancer, 5-fluorouracil and oxaliplatin reduce numbers of MDSCs to increase the effects of anti-PD-1, which promotes tumor infiltration by CD8+ T cells. However, these chemotherapeutic agents also induce expression of PD-L1 by tumor cells. Expression of PD-L1 by gastric epithelial cells increases tumorigenesis in response to MNU and H felis, and accumulation of MDSCs, which promote tumor progression. The timing and site of PD-L1 expression is therefore important in gastric tumorigenesis and should be considered in design of therapeutic regimens.

Keywords: Immunosuppression; Mouse Model; Resistance; Stomach Cancer.


Figures

Figure 1.
Figure 1.. Early anti-PD-1 treatment inhibits tumor growth in GAS-KO mice
(A) Expression of Pdl1 and Pdcd1 in the antrum following Hf/MNU by qPCR (n = 4/group). (B) E-cadherin and PD-L1 immunostaining on Hf/MNU/GAS-KO tumors at 30 weeks post-MNU. (C) Experimental design for early treatment. (D-E) Gross images (D) and tumor area measured (E) from GAS-KO mice treated with isotype control (n = 8) or anti-PD-1 (n = 6). Dotted lines indicate tumor area. (F) CD3 immunostaining on treated tumors. (G-H) The proportion of tumor-infiltrating CD3+ T cells (G) and the subsets (H) among CD45+ cells in treated mice (n = 3-4/group) by flow cytometry. (I) CD11b immunostaining on treated tumors. (J-K) The percentage of intratumoral MDSCs (CD11b+Gr-1+) (J), M-MDSCs (CD11b+Ly6ChiLy6G) and PMN-MDSCs (CD11b+Ly6CloLy6G+) (K) among CD45+ cells from treated mice (n = 3-4/group). (L) Immunosuppressive activity of PMN-MDSCs isolated from tumors (n = 3/group). Statistically significant differences from No MDSC group. (M-N) The proportion of macrophages (CD11b+Gr-1F4/80+) among CD45+ cells (M) and Tregs (CD25+Foxp3+) in CD4+ T cells (N) in treated tumors (n = 3-4/group). Scale bars, 100 μm (B); 5 mm (D); 50 μm (F and I). Mean ± SEM. one-way ANOVA (A); Student’s t-test (E, G-H and J-N). *P < .05; **P < .01; ***P < .001.
Figure 2.
Figure 2.. Early anti-PD-1 treatment in H/K-ATPase-IL-1β mice fails to delay tumor growth
(A) E-cadherin and PD-L1 immunostaining on Hf/MNU/IL-1β tumors at 30 weeks post-MNU. (B) PD-L1+ cells in EpCAM+ and CD45+ cells isolated from 30-week IL-1β tumors by flow cytometry (n = 3). (C-D) Gross images (C) and tumor area measured (D) from control (n = 9) or anti-PD-1-treated (n = 14) IL-1β mice. Dotted lines indicate tumor area. (E) Gr-1 immunostaining on tumors from WT and treated IL-1β mice. (F-G) Contour plots showing tumor MDSCs (F) and quantification (G) from treated groups (n = 6-8/group). (H-J) The proportion of MDSC subsets (H), T cells (I-J) in treated tumors (n = 6-8/group). (K) CD8 immunostaining on treated tumors. Scale bars, 100 μm (A); 5 mm (C); 50 μm (E and K). Mean ± SEM. Student’s t-test. *P < .05; **P < .01; ****P < .0001.
Figure 3.
Figure 3.. Late treatment with anti-PD-1 is effective when administered in combination with chemotherapy
(A) Experimental scheme for late treatment. (B-C) Gross images (B) and tumor area measured (C) from GAS-KO mice in indicated treatment groups (n = 12-17/group). Dotted lines indicate tumor area. One-way ANOVA (C). (D) H&E stains of GAS-KO tumors in different treatment groups. Dashed boxes indicate magnified areas shown at the bottom. (E-G) Immunostaining for cleaved caspase-3 (E), Ki-67 (F) and β-catenin (G) on treated GAS-KO tumors and quantification (n = 3/group). Arrowheads indicate nuclear β-catenin (G). Student’s t-test. Scale bars, 5 mm (B); 100 μm (D-G). Mean ± SEM. *P < .05; **P < .01; ***P < .001; ****P < .0001.
Figure 4.
Figure 4.. Immune effects of combination chemo-immunotherapy
(A) The proportion of intratumoral T cells in treated GAS-KO tumors (n = 8-13/group). (B) CD8 immunostaining on treated tumors. (C) Frequency of effector cytokine-secreting CD8+ T cells (n = 3/group). (D) CD11b immunostaining on treated tumors. (E) The proportion of MDSCs in treated GAS-KO tumors (n = 8-13/group). (F) Linear regression analyses between tumor area and the percentage of CD8+ T cells and PMN-MDSCs in GAS-KO tumors (n = 44). r2 and P-values are shown. (G) MFI (mean fluorescence intensity) of PD-L1 expressed on EpCAM+ cells isolated from GAS-KO tumors treated as indicated (n = 3-5/group). Scale bars, 50 μm. Mean ± SEM. Student’s t-test. *P < .05; **P < .01; ***P < .001.
Figure 5.
Figure 5.. PD-L1 overexpression in gastric epithelial cells promotes gastric tumorigenesis
(A) Gene construct of R26-LSL-Pdl1-IRES-EGFP mice. (B) Endogenous GFP expression in the stomach. The targeted tissues by Cre-expressing mice are gastric epithelial cells (Tff2-Cre) and immune/myeloid cells (LysM-Cre). (C-D) Gross images (C) and tumor area measured (D) from R26-PD-L1 and Tff2-Cre; R26-PD-L1 mice at 36 weeks post-MNU +/− Hf. Dotted lines indicate tumor area (n = 6-11/group). (E) H&E stains of gastric tumors. Dashed lines indicate intramucosal well-differentiated adenocarcinoma. An arrowhead indicates submucosal immune cell infiltrates. (F) Ki-67 and β-catenin staining on gastric tissues and quantification (n = 3/group). (G-H) The proportion of MDSCs by flow cytometry (G) and Gr-1 immunostaining (H) on tumors (n = 5-6/group). (I) The percentage of intratumoral MDSC subsets (n = 5-6/group). (J-K) mRNA expression of chemokines in tumors (J, n = 4/group) and isolated EpCAM+ cells from tumors (K, n = 3/group) by qPCR. (L) The percentage of tumor-infiltrating T cells (n = 5-6/group). (M) The percentage of cytokine secreting-intratumoral CD8+ T cells (n = 3/group). Scale bars, 100 μm (B and E-F); 5 mm (C); 50 μm (H). Mean ± SEM. One-way ANOVA (D); Student’s t-test (F, G and I-M). *P < .05; **P < .01; ***P < .001; n.s., not significant.
Figure 6.
Figure 6.. PD-L1-overexpressing myeloid cells facilitate gastric tumorigenesis
(A-B) Gross images (A) and tumor area measured (B) from R26-PD-L1 and LysM-Cre; R26-PD-L1 mice at 36 weeks post-MNU +/− Hf (n = 5-12/group). Dotted lines indicate tumor area. Scale bars, 5 mm (A). (C-D) The percentage of tumor-infiltrating MDSCs and T cells (n = 4-9/group). (E-F) The percentage of Ki-67+ (E), effector cytokine-positive cells (F) in CD8+ T cells isolated from MNU-induced R26-PD-L1 and LysM-Cre; R26-PD-L1 tumors (n = 3/group). Mean ± SEM. one-way ANOVA (B); Student’s t-test (C-F). *P < .05; **P < .01; ***P < .001; n.s., not significant.
Figure 7.
Figure 7.. Epithelial-derived PD-L1 increases susceptibility to gastric carcinogenesis
(A) Experimental design to assess susceptibility to MNU-induced gastric tumorigenesis. (B-D) Gross images (B), tumor incidence rates (C), and tumor area measured (D) in R26-PD-L1 and Tff2-Cre; R26-PD-L1 mice (n = 10-11/group) at 24 weeks post-MNU. (E-F) Gross images (E) and tumor area measured (F) from R26-PD-L1 and LysM-Cre; R26-PD-L1 mice at 24 weeks (n = 5/group). (G) Pdl1 expression in antral tissues at 10 weeks by qPCR (n = 3/group). (H-I) The proportion of T cells (H) and MDSCs (I) in antral tissues from R26-PD-L1 and Tff2-Cre; R26-PD-L1 mice at various time points following MNU induction (n = 3-5/group). Scale bars, 5 mm (B and E). Mean ± SEM. Student’s t-test. *P < .05; **P < .01; ****p < .0001.

Comment in

References

    1. Bray F, Ferlay J, Soerjomataram I, et al. Global cancer statistics 2018: GLOBOCAN estimates of incidence and mortality worldwide for 36 cancers in 185 countries. CA Cancer J Clin 2018;68:394–424. - PubMed
    1. Howlader N, Noone AM, Krapcho M, et al. SEER Cancer Statistics Review, 1975-2016, National Cancer Institute; Bethesda, MD, https://seer.cancer.gov/csr/1975_2016/, based on November 2018 SEER data submission, posted to the SEER web site, April 2019. 2019.
    1. Smyth EC, Verheij M, Allum W, et al. Gastric cancer: ESMO Clinical Practice Guidelines for diagnosis, treatment and follow-up. Ann Oncol 2016;27:v38–v49. - PubMed
    1. Topalian SL, Hodi FS, Brahmer JR, et al. Safety, activity, and immune correlates of anti-PD-1 antibody in cancer. N Engl J Med 2012;366:2443–54. - PMC - PubMed
    1. Fashoyin-Aje L, Donoghue M, Chen H, et al. FDA Approval Summary: Pembrolizumab for Recurrent Locally Advanced or Metastatic Gastric or Gastroesophageal Junction Adenocarcinoma Expressing PD-L1. Oncologist 2019;24:103–109. - PMC - PubMed

Publication types

MeSH terms