

Evaluating Responses to Gluten Challenge: A Randomized, Double-Blind, 2-Dose Gluten Challenge Trial
- PMID: 33130104
- PMCID: PMC7878429
- DOI: 10.1053/j.gastro.2020.10.040
Evaluating Responses to Gluten Challenge: A Randomized, Double-Blind, 2-Dose Gluten Challenge Trial
Abstract
Background & aims: Gluten challenge is used to diagnose celiac disease (CeD) and for clinical research. Sustained gluten exposure reliably induces histologic changes but is burdensome. We investigated the relative abilities of multiple biomarkers to assess disease activity induced by 2 gluten doses, and aimed to identify biomarkers to supplement or replace histology.
Methods: In this randomized, double-blind, 2-dose gluten-challenge trial conducted in 2 US centers (Boston, MA), 14 adults with biopsy-proven CeD were randomized to 3 g or 10 g gluten/d for 14 days. The study was powered to detect changes in villous height to crypt depth, and stopped at planned interim analysis on reaching this end point. Additional end points included gluten-specific cluster of differentiation (CD)4 T-cell analysis with HLA-DQ2-gluten tetramers and enzyme-linked immune absorbent spot, gut-homing CD8 T cells, interleukin-2, symptoms, video capsule endoscopy, intraepithelial leukocytes, and tissue multiplex immunofluorescence.
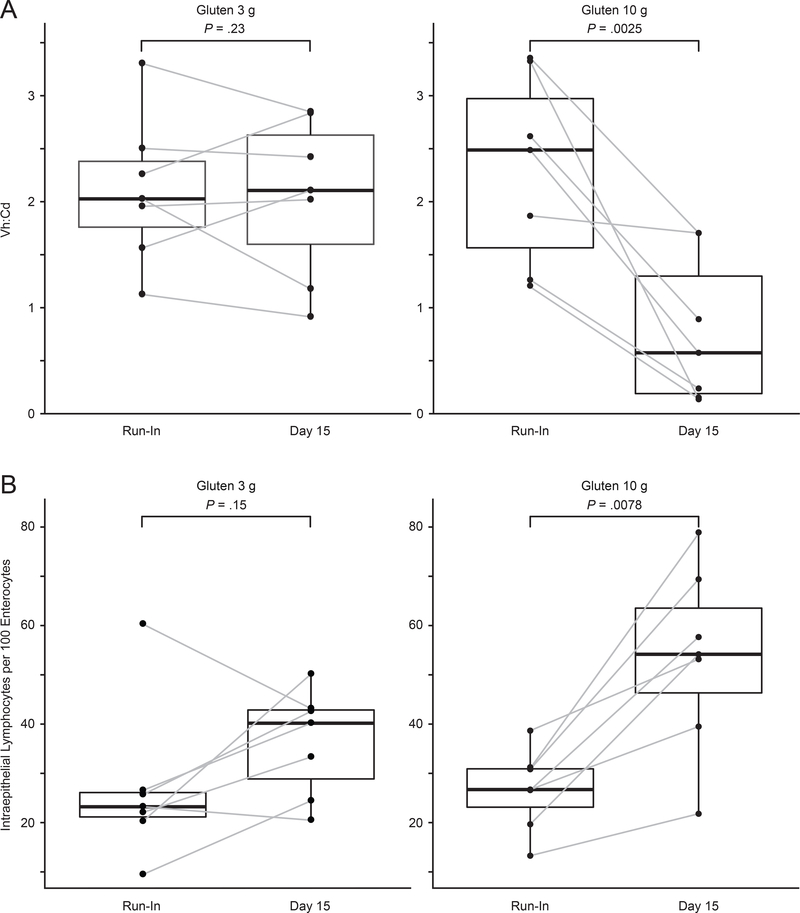
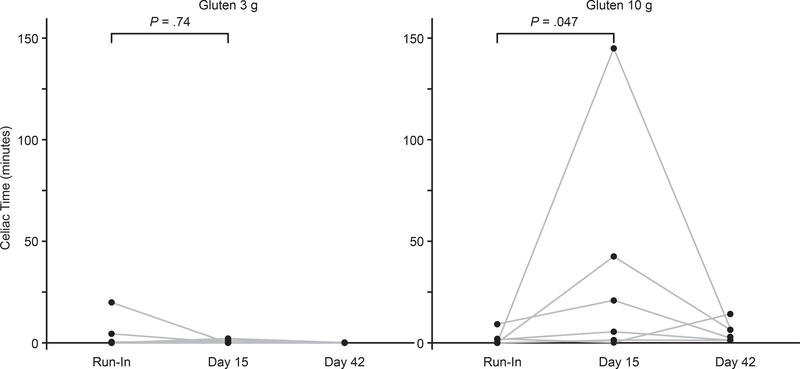
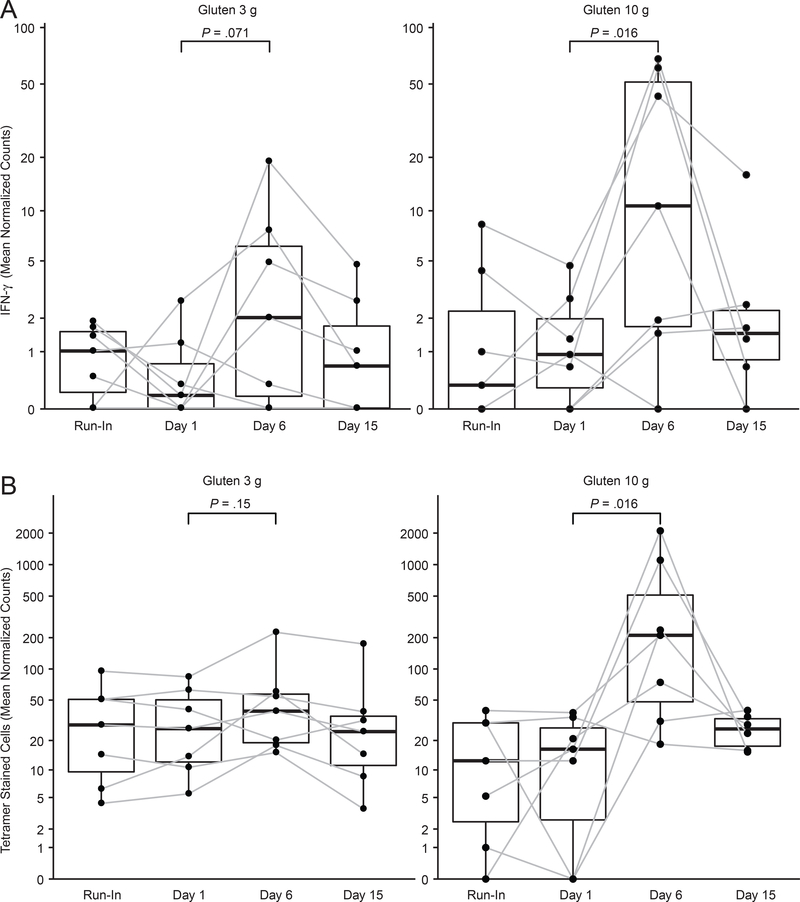
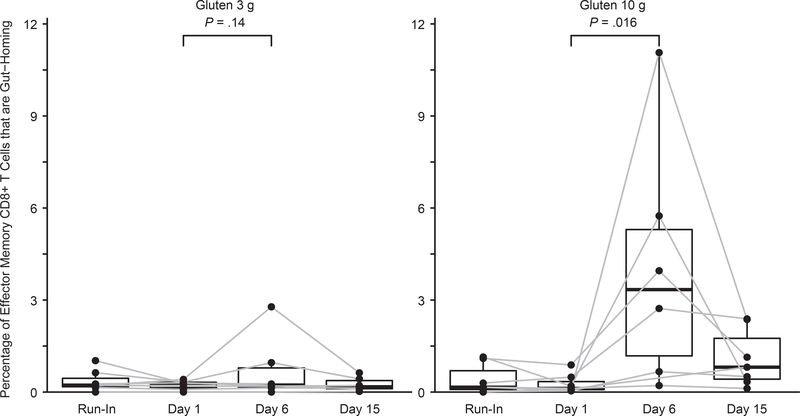
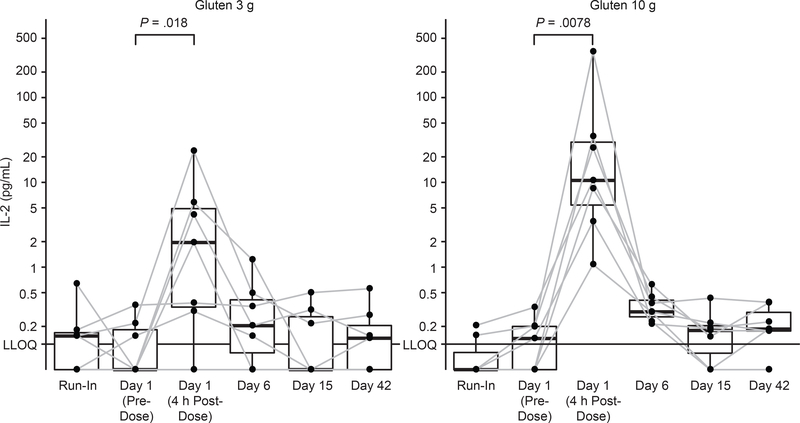
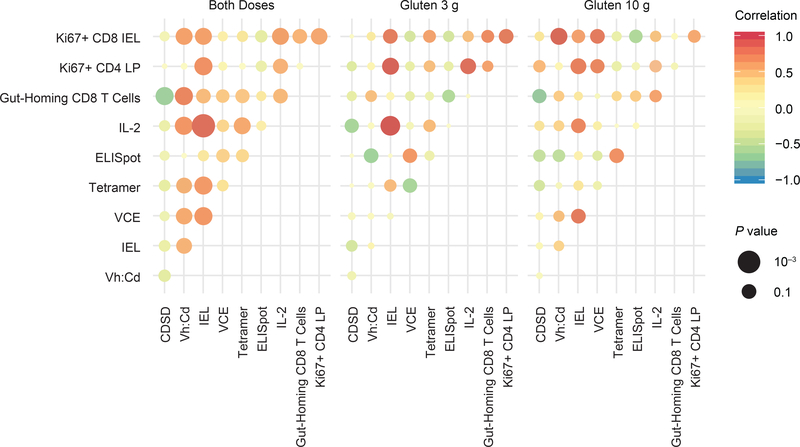
Results: All assessments showed changes with gluten challenge. However, time to maximal change, change magnitude, and gluten dose-response relationship varied. Villous height to crypt depth, video capsule endoscopy enteropathy score, enzyme-linked immune absorbent spot, gut-homing CD8 T cells, intraepithelial leukocyte counts, and HLA-DQ2-restricted gluten-specific CD4 T cells showed significant changes from baseline at 10 g gluten only; symptoms were significant at 3 g. Symptoms and plasma interleukin-2 levels increased significantly or near significantly at both doses. Interleukin-2 appeared to be the earliest, most sensitive marker of acute gluten exposure.
Conclusions: Modern biomarkers are sensitive and responsive to gluten exposure, potentially allowing less invasive, lower-dose, shorter-duration gluten ingestion. This work provides a preliminary framework for rational design of gluten challenge for CeD research. ClinicalTrials.gov number, NCT03409796.
Keywords: Biomarkers; Celiac Disease; Gluten Challenge; T Cells.
Copyright © 2021 The Authors. Published by Elsevier Inc. All rights reserved.
Figures
Similar articles
-
HLA-DQ:gluten tetramer test in blood gives better detection of coeliac patients than biopsy after 14-day gluten challenge.Gut. 2018 Sep;67(9):1606-1613. doi: 10.1136/gutjnl-2017-314461. Epub 2017 Aug 4. Gut. 2018. PMID: 28779027
-
HLA-DQ-Gluten Tetramer Blood Test Accurately Identifies Patients With and Without Celiac Disease in Absence of Gluten Consumption.Gastroenterology. 2018 Mar;154(4):886-896.e6. doi: 10.1053/j.gastro.2017.11.006. Epub 2017 Nov 14. Gastroenterology. 2018. PMID: 29146521
-
A bispecific antibody targeting HLA-DQ2.5-gluten peptides potently blocks gluten-specific T cells induced by gluten ingestion in patients with celiac disease.Clin Immunol. 2024 Jul;264:110259. doi: 10.1016/j.clim.2024.110259. Epub 2024 May 18. Clin Immunol. 2024. PMID: 38768856
-
Celiac disease: how complicated can it get?Immunogenetics. 2010 Oct;62(10):641-51. doi: 10.1007/s00251-010-0465-9. Epub 2010 Jul 27. Immunogenetics. 2010. PMID: 20661732 Free PMC article. Review.
-
HLA class II genes in precision-based care of childhood diseases: what we can learn from celiac disease.Pediatr Res. 2021 Jan;89(2):307-312. doi: 10.1038/s41390-020-01217-4. Epub 2020 Oct 29. Pediatr Res. 2021. PMID: 33122841 Review.
Cited by
-
Review article: Follow-up of coeliac disease.Aliment Pharmacol Ther. 2022 Jul;56 Suppl 1(Suppl 1):S49-S63. doi: 10.1111/apt.16847. Aliment Pharmacol Ther. 2022. PMID: 35815829 Free PMC article. Review.
-
Yield of Gluten Challenge in Patients on Self-Prescribed Gluten-Free Diets.Dig Dis Sci. 2024 Aug;69(8):2916-2921. doi: 10.1007/s10620-024-08399-5. Epub 2024 May 20. Dig Dis Sci. 2024. PMID: 38769224
-
Hereditary Alpha-Tryptasemia Is Associated With Ongoing Symptoms in Individuals With Celiac Disease Despite Following a Gluten-free Diet.Am J Gastroenterol. 2025 May 14:10.14309/ajg.0000000000003537. doi: 10.14309/ajg.0000000000003537. Online ahead of print. Am J Gastroenterol. 2025. PMID: 40367491
-
Gastrointestinal and Extraintestinal Symptoms Among Subjects With Celiac Disease Undergoing a Dose-Specified Gluten Challenge: A Systematic Review and Meta-Analysis.Am J Gastroenterol. 2025 Apr 29:10.14309/ajg.0000000000003506. doi: 10.14309/ajg.0000000000003506. Online ahead of print. Am J Gastroenterol. 2025. PMID: 40298233
-
Activated gut-homing CD8+ T cells for coeliac disease diagnosis on a gluten-free diet.BMC Med. 2021 Oct 6;19(1):237. doi: 10.1186/s12916-021-02116-z. BMC Med. 2021. PMID: 34610833 Free PMC article.
References
-
- Singh P, Arora A, Strand TA, et al. Global prevalence of celiac disease: systematic review and meta-analysis. Clin Gastroenterol Hepatol 2018;16:823–836 e2. - PubMed
-
- Fasano A, Catassi C. Clinical practice. Celiac disease. N Engl J Med 2012;367:2419–2426. - PubMed
-
- Lebwohl B, Sanders DS, Green PHR. Coeliac disease. Lancet 2018;391:70–81. - PubMed
-
- Leffler DA, Green PH, Fasano A. Extraintestinal manifestations of coeliac disease. Nat Rev Gastroenterol Hepatol 2015;12:561–571. - PubMed
Publication types
MeSH terms
Substances
Associated data
Grants and funding
LinkOut - more resources
Full Text Sources
Other Literature Sources
Medical
Research Materials
