. 2021 Jan:102:463-471.
doi: 10.1016/j.ijid.2020.10.075. Epub 2020 Oct 31.

Database of epidemic trends and control measures during the first wave of COVID-19 in mainland China

Affiliations

Database of epidemic trends and control measures during the first wave of COVID-19 in mainland China

Han Fu et al. Int J Infect Dis. 2021 Jan.

Abstract

Objectives: In this data collation study, we aimed to provide a comprehensive database describing the epidemic trends and responses during the first wave of coronavirus disease 2019 (COVID-19) throughout the main provinces in China.

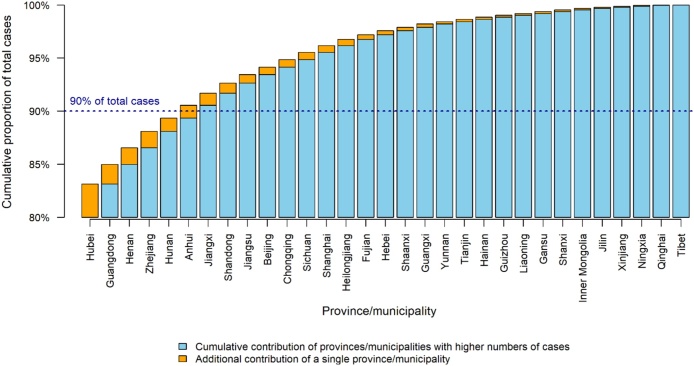
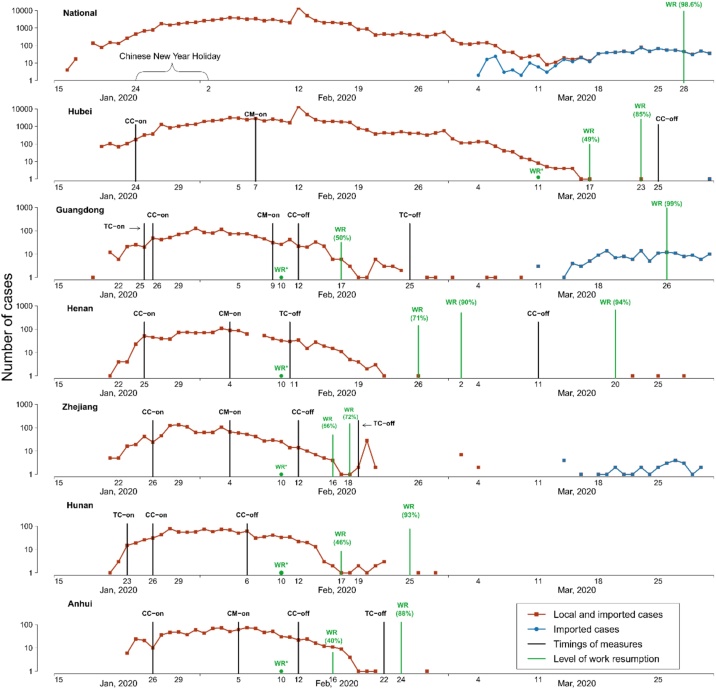
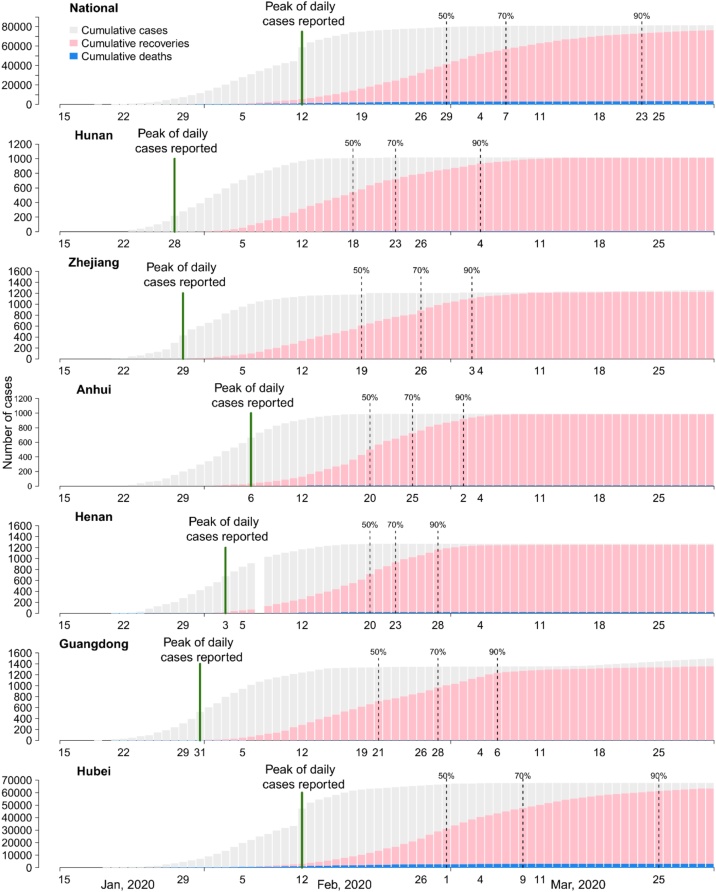
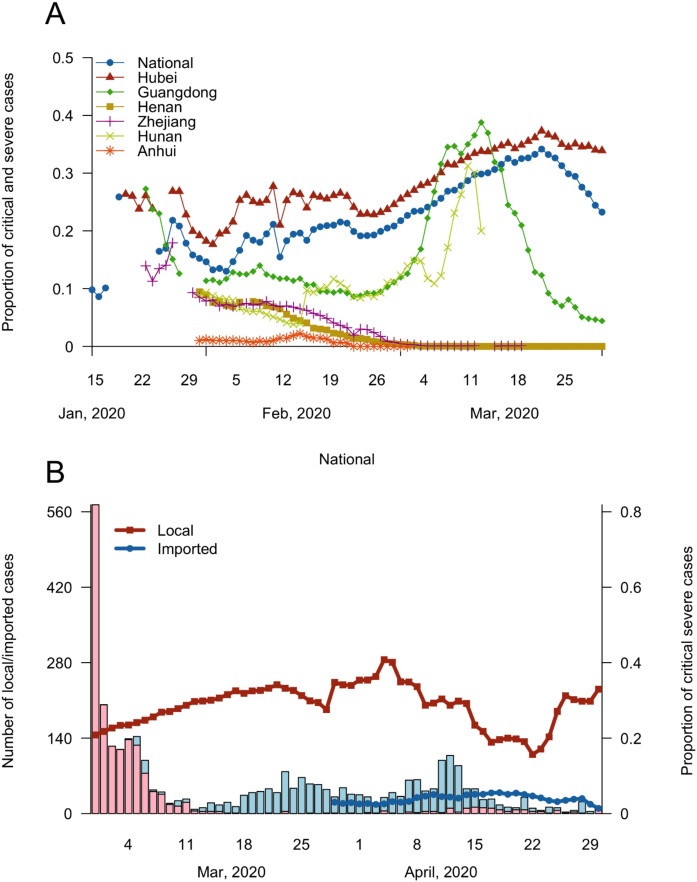
Methods: From mid-January to March 2020, we extracted publicly available data regarding the spread and control of COVID-19 from 31 provincial health authorities and major media outlets in mainland China. Based on these data, we conducted descriptive analyses of the epidemic in the six most-affected provinces.

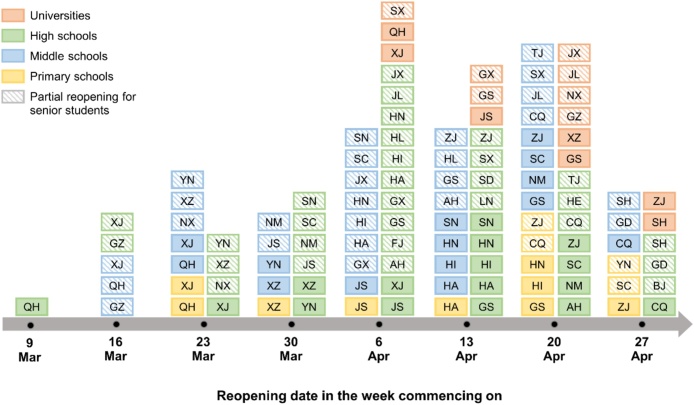
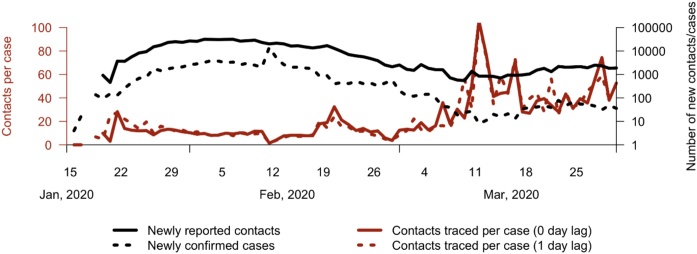
Results: School closures, travel restrictions, community-level lockdown, and contact tracing were introduced concurrently around late January but subsequent epidemic trends differed among provinces. Compared with Hubei, the other five most-affected provinces reported a lower crude case fatality ratio and proportion of critical and severe hospitalised cases. From March 2020, as the local transmission of COVID-19 declined, switching the focus of measures to the testing and quarantine of inbound travellers may have helped to sustain the control of the epidemic.

Conclusions: Aggregated indicators of case notifications and severity distributions are essential for monitoring an epidemic. A publicly available database containing these indicators and information regarding control measures is a useful resource for further research and policy planning in response to the COVID-19 epidemic.

Keywords: COVID-19; Case fatality ratio; China; Contact; Control measure; Epidemic.


Figures

Figure 1
Figure 1
Cumulative proportions of total cases contributed by province/municipality up to 31 March 2020. Thirty-one provinces/municipalities in China ranked in descending order (left to right) of total confirmed cases up to 31 March. Yellow bars represent the proportion of national confirmed cases contributed by a single province/municipality. Blue bars are the cumulative contributions from provinces/municipalities with higher numbers of reported cases.
Figure 2
Figure 2
Reopening dates for primary, middle, and high schools, and universities. Dates of school reopening are summarised weekly for March and April 2020. Each rectangle indicates the reopening of a specific level of school (denoted by colours) in a province/municipality (denoted by text abbreviations). Rectangles fully filled with colour represent reopening at full scale, whereas those filled with diagonal lines represent partial reopening for senior or research students. Reopening dates were extracted from official announcements and local news (available at Github: https://github.com/mrc-ide/covid19_mainland_China_report). Abbreviations for provinces/municipalities: AH – Anhui, BJ – Beijing, CQ – Chongqing, FJ – Fujian, GD – Guangdong, GS – Gansu, GZ – Guizhou, GX – Guangxi, HA – Henan, HE – Hebei, HI – Hainan, HL – Heilongjiang, HN – Hunan, JS – Jiangsu, JL – Jilin, JX – Jiangxi, LN – Liaoning, NM – Inner Mongolia, NX – Ningxia, QH – Qinghai, SC – Sichuan, SD – Shandong, SH – Shanghai, SN – Shaanxi, SX – Shanxi, TJ – Tianjin, XJ – Xinjiang, XZ – Tibet, YN – Yunan, and ZJ – Zhejiang.
Figure 3
Figure 3
Newly confirmed cases and timings of control measures by province. Numbers of confirmed cases at national and provincial levels are shown on a log scale. Vertical lines denote the timings of implementing and relaxing control measures (black), and related work resumption statistics (green). The asterisks (*) indicate the initiation date for work resumption. Abbreviations for control measures: CC – cancellation of cross-border public transportation, TC – temperature checks at provincial borders, and CM – closed-off management at community level.
Figure 4
Figure 4
Cumulative cases, deaths, and recoveries by province. Bars represent the cumulative numbers of cases (grey), recoveries (pink), and deaths (blue). Black vertical dashed lines show the dates when 50%, 70%, and 90% of recoveries among all cases were reached. Green vertical solid lines show the dates when the peak number of daily confirmed cases occurred. The six provinces are ranked from top to down by the date when 50% recovery was achieved. It should be noted the range for the y-axis differs among provinces to fit the magnitude of cases.
Figure 5
Figure 5
Severity of COVID-19 among current cases (A) by province and (B) by locally transmitted and imported cases. Proportions of critical and severe cases among all current cases are presented in the upper panel (A) by national and six provinces with the highest caseloads from 15 January to 31 March. In the lower panel (B), disease severity is shown according to locally transmitted (red) and imported (blue) cases from 1 March to 30 April. Solid lines represent the proportions of critical and severe cases at a level corresponding to the right y-axis, and bars denote the absolute numbers of total cases with the scale denoted on the left y-axis.
Figure 6
Figure 6
Contacts traced per newly confirmed case. The trends in contacts traced per newly confirmed case are presented by assuming 0 (red solid line) and 1 (red dashed line) day lags based on the y-axis shown on the left-hand side. Numbers of daily contacts and cases are shown on a log scale by black solid and black dashed lines, respectively, and they correspond to the y-axis on the right-hand side.

References

    1. China Central Television . 2020. The term date of each province is postponed again and many provinces will not reopen schools until the end of February.http://news.cctv.com/2020/02/08/ARTIjau34D2jKxLq3BwWUaTO200208.shtml [Accessed 20 March 2020]
    1. China Central Television . 2020. When does the term start? The Ministry of Education makes three principle requirements for reopening schools.https://www.youtube.com/watch?v=vXsnfqpPmc8 [Accessed 21 March 2020]
    1. Chinese Center for Disease Control and Prevention . 2020. Guidelines for COVID-19 epidemiological investigation.http://www.chinacdc.cn/jkzt/crb/zl/szkb_11803/jszl_11815/202003/W0202003... [Accessed 30 March 2020] - PMC - PubMed
    1. Chutian Metropolis Daily . 2020. The latest news of work resumption!http://www.hubei.gov.cn/zhuanti/2020/gzxxgzbd/qfqk/202003/t20200318_2184... [Accessed 2 June 2020]
    1. Cui J. 2020. Control tightened over imported cases.http://english.www.gov.cn/news/topnews/202003/17/content_WS5e700b77c6d0c... [Accessed 20 March 2020]