. 2021 Apr 12;23(4):638-649.
doi: 10.1093/neuonc/noaa248.

Functional analysis of low-grade glioma genetic variants predicts key target genes and transcription factors

Affiliations

Functional analysis of low-grade glioma genetic variants predicts key target genes and transcription factors

Mohith Manjunath et al. Neuro Oncol. .

Abstract

Background: Large-scale genome-wide association studies (GWAS) have implicated thousands of germline genetic variants in modulating individuals' risk to various diseases, including cancer. At least 25 risk loci have been identified for low-grade gliomas (LGGs), but their molecular functions remain largely unknown.

Methods: We hypothesized that GWAS loci contain causal single nucleotide polymorphisms (SNPs) that reside in accessible open chromatin regions and modulate the expression of target genes by perturbing the binding affinity of transcription factors (TFs). We performed an integrative analysis of genomic and epigenomic data from The Cancer Genome Atlas and other public repositories to identify candidate causal SNPs within linkage disequilibrium blocks of LGG GWAS loci. We assessed their potential regulatory role via in silico TF binding sequence perturbations, convolutional neural network trained on TF binding data, and simulated annealing-based interpretation methods.

Results: We built an interactive website (http://education.knoweng.org/alg3/) summarizing the functional footprinting of 280 variants in 25 LGG GWAS regions, providing rich information for further computational and experimental scrutiny. We identified as case studies PHLDB1 and SLC25A26 as candidate target genes of rs12803321 and rs11706832, respectively, and predicted the GWAS variant rs648044 to be the causal SNP modulating ZBTB16, a known tumor suppressor in multiple cancers. We showed that rs648044 likely perturbed the binding affinity of the TF MAFF, as supported by RNA interference and in vitro MAFF binding experiments.

Conclusions: The identified candidate (causal SNP, target gene, TF) triplets and the accompanying resource will help accelerate our understanding of the molecular mechanisms underlying genetic risk factors for gliomas.

Keywords: GWAS; functional genomics; genetic variants; low-grade glioma.


Figures

Fig. 1
Fig. 1
Integrated framework for functional analysis of LGG GWAS SNPs. Green: epigenomic data; pink: genomic information; blue: transcriptomic data and analysis; purple: motif and TF-gene expression correlation analyses; ocean blue: deep learning approaches for TF binding prediction; yellow: experimental validation; red: candidate triplets.
Fig. 2
Fig. 2
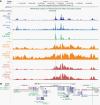
ZBTB16 intronic enhancer harboring rs648044 modulates mRNA expression of nearby genes. (A) A snapshot of the ZBTB16 locus where the GWAS SNP rs648044 is denoted by a blue vertical line. The shown epigenomic tracks are: TCGA-LGG ATAC-seq, oligodendrocytes ATAC-seq, and REMC data in fetal brain and prefrontal cortex. (B) A zoomed-out view of the ZBTB16 locus encompassing the eQTL target genes, NCAM1 and ZBTB16, indicated by red boxes.
Fig. 3
Fig. 3
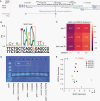
The GWAS SNP rs648044 likely perturbs the binding affinity of MAFF that represses ZBTB16. (A) Oligodendrocyte PLAC-seq track showing the rs648044 locus (blue vertical line) interacting with the ZBTB16 promoter, about 100 kb away. (B) JASPAR motif logo of the predicted TF MAFF and 2 variants of the flanking sequence harboring rs648044-A and rs648044-G alleles. Throughout the text, the risk and non-risk alleles of a SNP are colored orange and blue, respectively. (C) Pearson’s correlation coefficient between ZBTB16 and MAFF in the combined “IDHmut only” and TP group, “IDHmut only” subgroup and TP subgroup. (D) Gel picture from the EMSA experiment showing a ladder (“LD”) and eight lanes using the mixture of the recombinant MafF protein and 4 different DNA sequences (Supplementary Methods): 81 bp positive control (“PC”) sequence, 81 bp sequence flanking rs648044-A, 81 bp sequence flanking rs648044-G and negative control (“NC”) sequence. The lower molecular weight bands in black box correspond to free DNA. Orange box highlights the bands of MafF-bound DNA, corresponding to the results of “positive control DNA + MafF” and “rs648044-A flanking sequence + MafF.” (E) MAFF RNA interference knockdown experiment results, showing a significant increase in ZBTB16 mRNA expression after MAFF knockdown. One-sided t-test P-value between the control group and the combined group of 3 independent short hairpin RNA clones is shown.
Fig. 4
Fig. 4
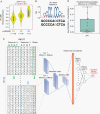
The high LD SNP rs12225399 likely modulates PHLDB1 expression by perturbing the binding affinity of SP1/SP2. (A) eQTL result for rs12803321 and PHLDB1 in the TCGA-LGG “IDHmut only” subgroup. (B) SP1 motif logo MA0079.3 (JASPAR) and two variants of the flanking sequence harboring rs12225399-C and rs12225399-G alleles. (C) CNN for predicting the binding pattern of SP1 based on DNA sequence and open chromatin information. From left to right: 1001 bp × 9 input matrix incorporating sequence information and quantile-normalized DNase-seq signal at each base; convolutional layer using filters of length 12 bp; maximum layer, extracting the maximum of the convolutional layer output from the positive and negative strands; maximum pooling layer; flatten and concatenate layer; fully connected layer with 80 neurons; fully connected layer with 10 neurons; output. (D) The difference of SP1 binding probability between the two alleles of rs12225399, predicted by the CNN model based on 13 REMC fetal brain DNase-seq datasets from 10 donors.
Fig. 5
Fig. 5
The GWAS SNP rs11706832 is associated with an increased expression of SLC25A26. (A) eQTL result for rs11706832 and SLC25A26 in the combined TCGA-LGG “IDHmut only” and TP group. (B) Similar to (A), but for the “IDHmut only” subgroup. (C) Similar to (A), but for the TP subgroup.

References

    1. Louis DN, Perry A, Reifenberger G, et al. . The 2016 World Health Organization classification of tumors of the central nervous system: a summary. Acta Neuropathol. 2016;131(6):803–820. - PubMed
    1. Eckel-Passow JE, Lachance DH, Molinaro AM, et al. . Glioma groups based on 1p/19q, IDH, and TERT promoter mutations in tumors. N Engl J Med. 2015;372(26):2499–2508. - PMC - PubMed
    1. Shete S, Hosking FJ, Robertson LB, et al. . Genome-wide association study identifies five susceptibility loci for glioma. Nat Genet. 2009;41(8):899–904. - PMC - PubMed
    1. Sanson M, Hosking FJ, Shete S, et al. . Chromosome 7p11.2 (EGFR) variation influences glioma risk. Hum Mol Genet. 2011;20(14):2897–2904. - PMC - PubMed
    1. Kinnersley B, Labussière M, Holroyd A, et al. . Genome-wide association study identifies multiple susceptibility loci for glioma. Nat Commun. 2015;6:8559. - PMC - PubMed

Publication types

MeSH terms

Substances