. 2021 Mar 25;23(3):376-386.
doi: 10.1093/neuonc/noaa249.

Optimal therapeutic targeting by HDAC inhibition in biopsy-derived treatment-naïve diffuse midline glioma models

Affiliations

Optimal therapeutic targeting by HDAC inhibition in biopsy-derived treatment-naïve diffuse midline glioma models

Nicholas A Vitanza et al. Neuro Oncol. .

Abstract

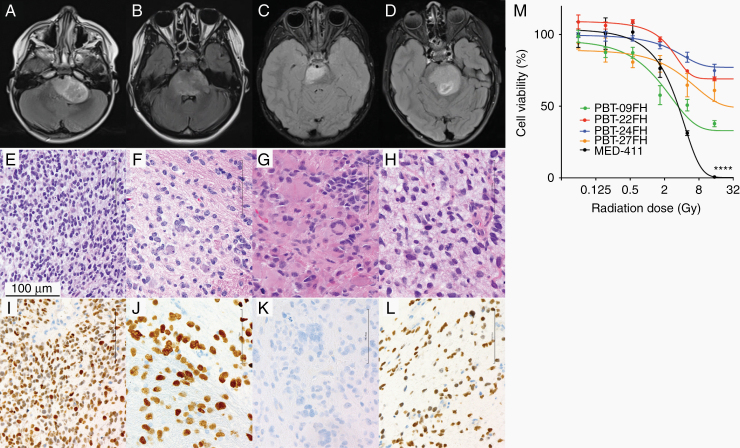
Background: Diffuse midline gliomas (DMGs), including diffuse intrinsic pontine gliomas (DIPGs), have a dismal prognosis, with less than 2% surviving 5 years postdiagnosis. The majority of DIPGs and all DMGs harbor mutations altering the epigenetic regulatory histone tail (H3 K27M). Investigations addressing DMG epigenetics have identified a few promising drugs, including the HDAC inhibitor (HDACi) panobinostat. Here, we use clinically relevant DMG models to identify and validate other effective HDACi and their biomarkers of response.

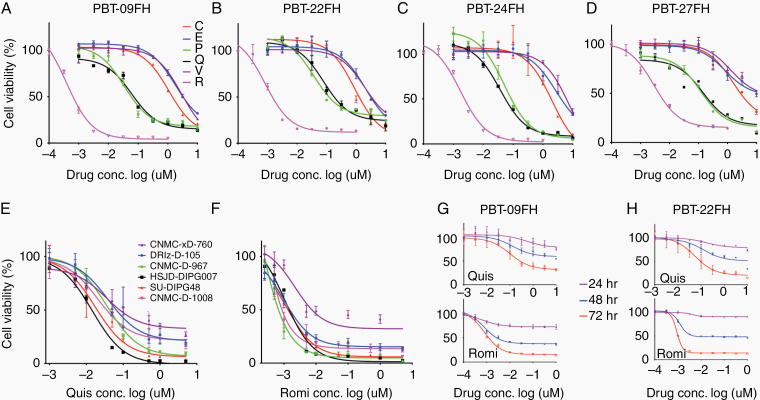
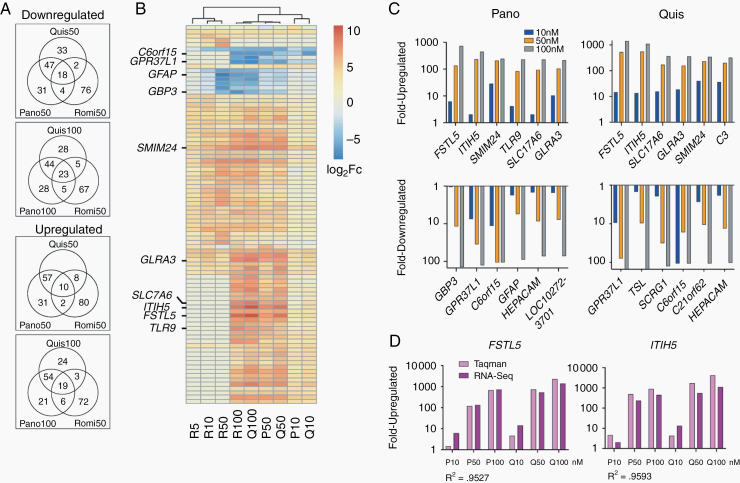
Methods: HDAC inhibitors were tested across biopsy-derived treatment-naïve in vitro and in vivo DMG models with biologically relevant radiation resistance. RNA sequencing was performed to define and compare drug efficacy and to map predictive biomarkers of response.

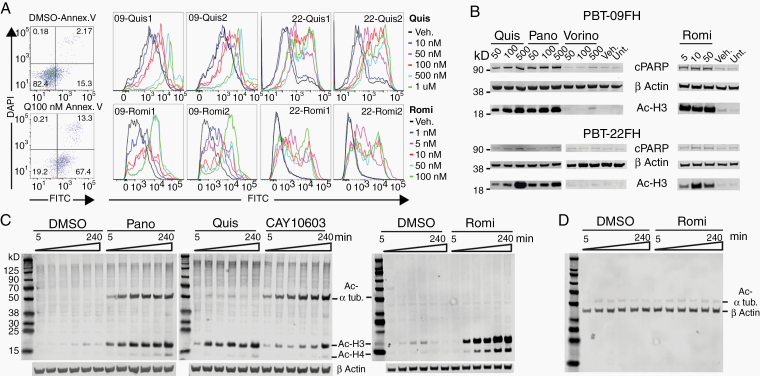
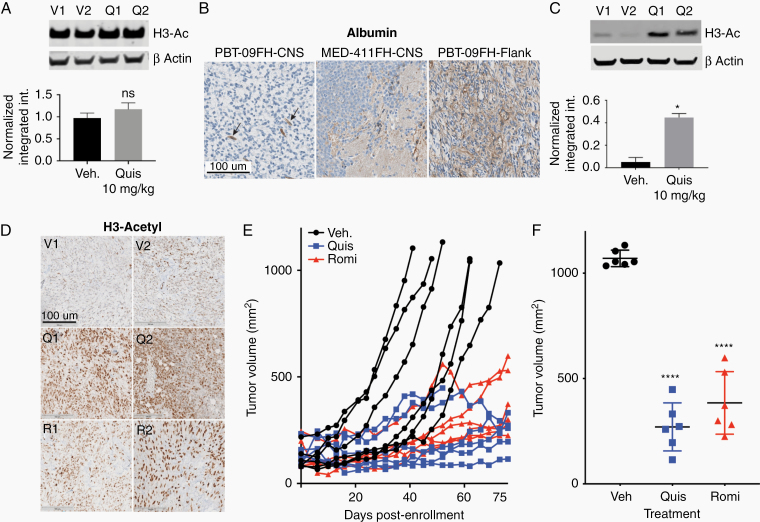
Results: Quisinostat and romidepsin showed efficacy with low nanomolar half-maximal inhibitory concentration (IC50) values (~50 and ~5 nM, respectively). Comparative transcriptome analyses across quisinostat, romidepsin, and panobinostat showed a greater degree of shared biological effects between quisinostat and panobinostat, and less overlap with romidepsin. However, some transcriptional changes were consistent across all 3 drugs at similar biologically effective doses, such as overexpression of troponin T1 slow skeletal type (TNNT1) and downregulation of collagen type 20 alpha 1 chain (COL20A1), identifying these as potential vulnerabilities or on-target biomarkers in DMG. Quisinostat and romidepsin significantly (P < 0.0001) inhibited in vivo tumor growth.

Conclusions: Our data highlight the utility of treatment-naïve biopsy-derived models; establishes quisinostat and romidepsin as effective in vivo; illuminates potential mechanisms and/or biomarkers of DMG cell lethality due to HDAC inhibition; and emphasizes the need for brain tumor-penetrant versions of potentially efficacious agents.

Keywords: H3 K27M-mutant (DMG); diffuse intrinsic pontine glioma (DIPG); diffuse midline glioma; histone deacetylase inhibitor (HDACi); quisinostat; romidepsin.


Figures

Fig. 1
Fig. 1
Formation of treatment-naïve biopsy-derived DMG cell cultures. Clinical correlates for patients providing PBT-09FH, PBT-22FH, PBT-24FH, and PBT-27FH including MRI brain axial T2 fluid attenuated inversion recovery postcontrast (A–D), H&E immunohistochemistry (E–H), and H3 K27M IHC (I–L). Scale bar 100 µm. Cell viability following in vitro radiation treatment (****P < 0.0001) (M).
Fig. 2
Fig. 2
Quisinostat and romidepsin exhibit low nanomolar efficacy against DMG cultures. Cell viability assay of HDACi (72 hours) in (A) PBT-09FH, (B) PBT-22FH, (C) PBT-24FH, and (D) PBT-27FH. C = CAY10603, E = entinostat, P = panobinostat, Q = quisinostat, R = romidepsin, and V = vorinostat. (E) Cell viability assay following 72 hours of quisinostat and (F) romidepsin treatment performed at University Children’s Hospital Zurich. Cell viability timecourse assay following quisinostat and romidepsin treatment in (G) PBT-09FH and (H) PBT-22FH.
Fig. 3
Fig. 3
Quisinostat and romidepsin induce apoptosis in DMG cultures. (A) Flow cytometry of PBT-22FH stained with DAPI and FITC-annexin V following 72 hour treatment with 100 nM quisinostat (left) and duplicate histogram overlays for annexin V staining over concentrations of quisinostat- and romidepsin-treated PBT-09FH and PBT-22FH (right). (B) Western blot of cPARP and Ac-histone 3 in lysates generated from HDACi treated PBT-09FH and PBT-22FH (concentrations in nM). (C) Four-hour timecourse western blot showing decreased acetyl α-tubulin but very similar H3 acetylation by 500 nM quisinostat and 50 nM romidepsin compared with 500 nM panobinostat (HDAC6 inhibitor CAY10603 as a positive control of α-tubulin acetylation) in PBT-22FH. (D) Western blot of acetyl α-tubulin–specific antibody, demonstrating no change over the timecourse of treatment of PBT-22FH with 50 nM romidepsin.
Fig. 4
Fig. 4
Quisinostat and romidepsin induce prolonged tumor growth inhibition in an in vivo DMG flank model. (A) Western blots for H3 acetylation in vehicle and quisinostat-treated orthotopic xenograft PBT-09FH tumor lysate, with corresponding histograms of β-actin normalized intensities below. V = vehicle, Q = quisinostat, ns = no significant difference. (B) IHC of albumin in orthotopic xenograft PBT-09FH tumor compared with orthotopic xenograft MED-411FH and flank PBT-09FH tumors. Arrows indicate albumin-positive blood vessels. Scale bar 100 µm. (C) Western blots for H3 acetylation in vehicle and quisinostat-treated flank PBT-09FH tumors, with corresponding histograms of β-actin normalized intensities below (*P < 0.05). (D) H3-Ac IHC replicates of xenograft PBT-09FH flank tumors following systemic vehicle, quisinostat (10 mg/kg, MWF), or romidepsin (1 mg/kg, MF). V = vehicle, Q = quisinostat, R = romidepsin. (E) Tumor volume over time in flank xenograft cohorts treated with vehicle, quisinostat (10 mg/kg MWF), or romidepsin (1 mg/kg MF). (F) Boxplot of tumor volumes at study endpoint showing significantly decreased tumor volume in quisinostat and romidepsin-treated cohorts when compared with vehicle (****P < 0.0001).
Fig. 5
Fig. 5
Transcriptomic studies reveal targets of cytotoxic HDAC inhibition. (A) Venn diagrams show the overlap between the 100 most up and downregulated genes for quisinostat, panobinostat, and romidepsin treated PBT-22FH cells relative to vehicle control. Comparisons are shown for equimolar treatment (50 nM) or 50 nM romidepsin versus 100 nM quisinostat and panobinostat. (B) Unsupervised hierarchical clustering of the union of the top 500 most differentially regulated genes, displaying union of top 20 for each treatment (87 genes total). (C) Modulation of expression levels with drug concentration for top 6 differentially up- and downregulated genes following panobinostat and quisinostat treatment. (D) TaqMan PCR validation of expression changes in FSTL5 and ITIH5, compared with RNA-seq (R2 = Pearson coefficient).

Comment in

References

    1. Ostrom QT, Gittleman H, Liao P, et al. . CBTRUS statistical report: primary brain and central nervous system tumors diagnosed in the United States in 2007–2011. Neuro Oncol. 2014;16(Suppl 4):iv1–iv63. - PMC - PubMed
    1. Cooney T, Lane A, Bartels U, et al. . Contemporary survival endpoints: an International Diffuse Intrinsic Pontine Glioma Registry study. Neuro Oncol. 2017;19(9):1279–1280. - PMC - PubMed
    1. Barkovich AJ, Krischer J, Kun LE, et al. . Brain stem gliomas: a classification system based on magnetic resonance imaging. Pediatr Neurosurg. 1990;16(2):73–83. - PubMed
    1. Albright AL, Packer RJ, Zimmerman R, Rorke LB, Boyett J, Hammond GD. Magnetic resonance scans should replace biopsies for the diagnosis of diffuse brain stem gliomas: a report from the Children’s Cancer Group. Neurosurgery. 1993;33(6):1026–1029; discussion 1029–1030. - PubMed
    1. Grasso CS, Tang Y, Truffaux N, et al. . Functionally defined therapeutic targets in diffuse intrinsic pontine glioma. Nat Med. 2015;21(6):555–559. - PMC - PubMed

Publication types