. 2020 Dec;34(12):16676-16692.
doi: 10.1096/fj.202001880R. Epub 2020 Nov 1.

Metabolic profiling reveals dysregulated lipid metabolism and potential biomarkers associated with the development and progression of Fragile X-Associated Tremor/Ataxia Syndrome (FXTAS)

Affiliations

Metabolic profiling reveals dysregulated lipid metabolism and potential biomarkers associated with the development and progression of Fragile X-Associated Tremor/Ataxia Syndrome (FXTAS)

Marwa Zafarullah et al. FASEB J. 2020 Dec.

Abstract

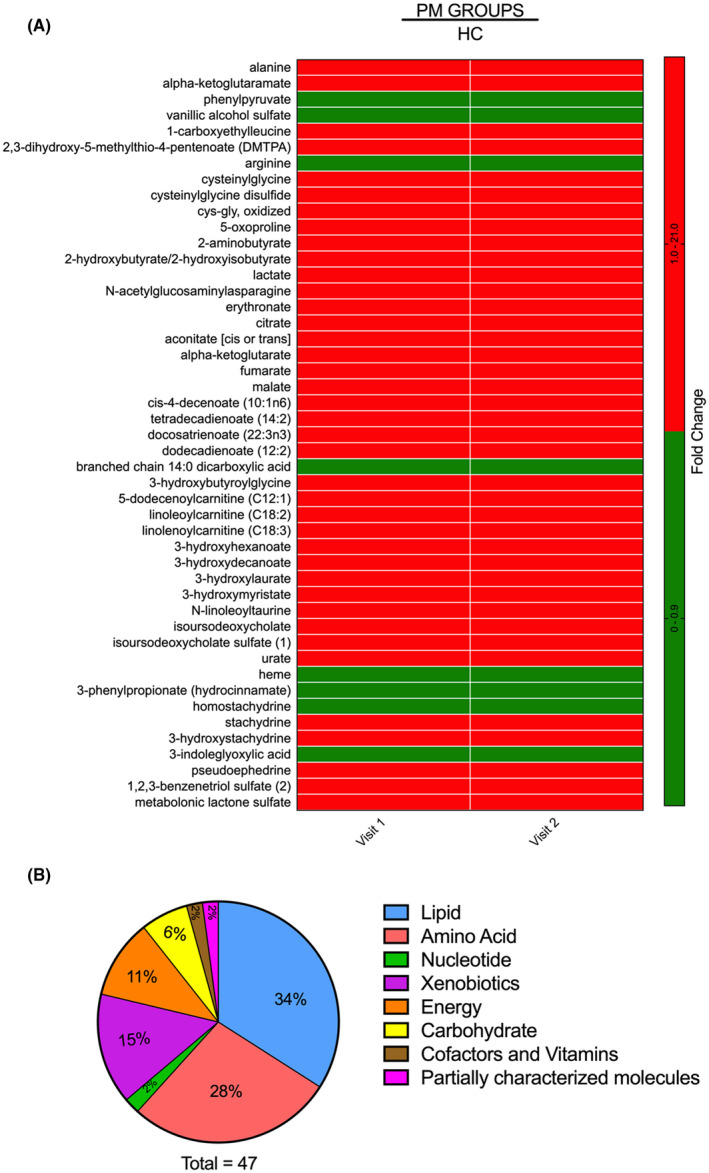
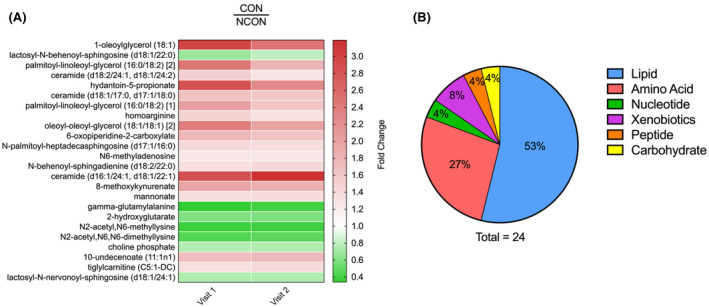
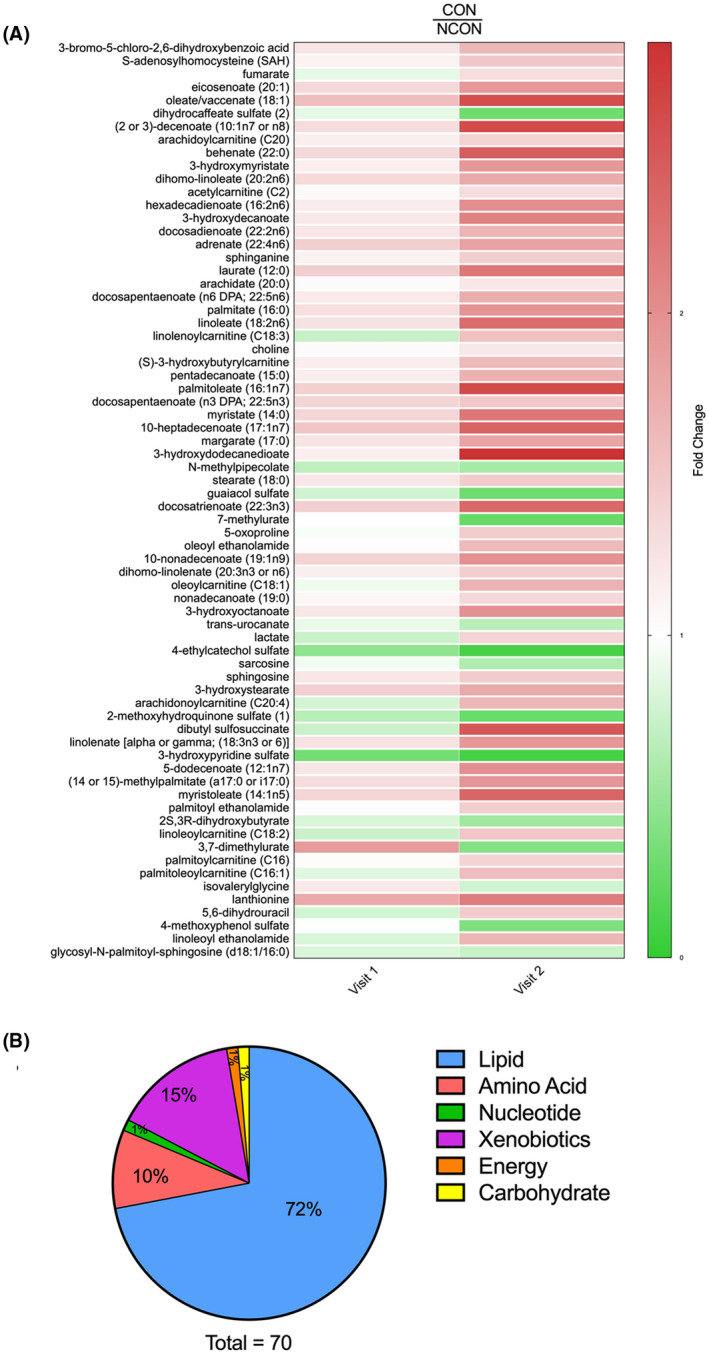
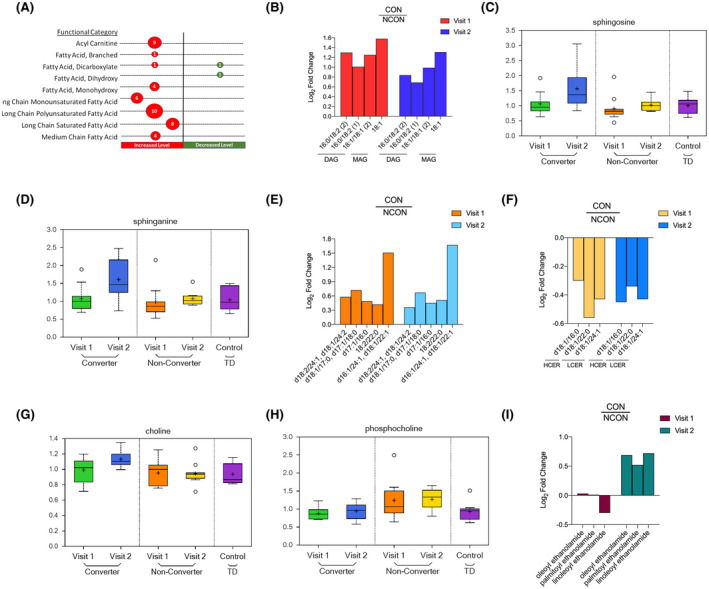
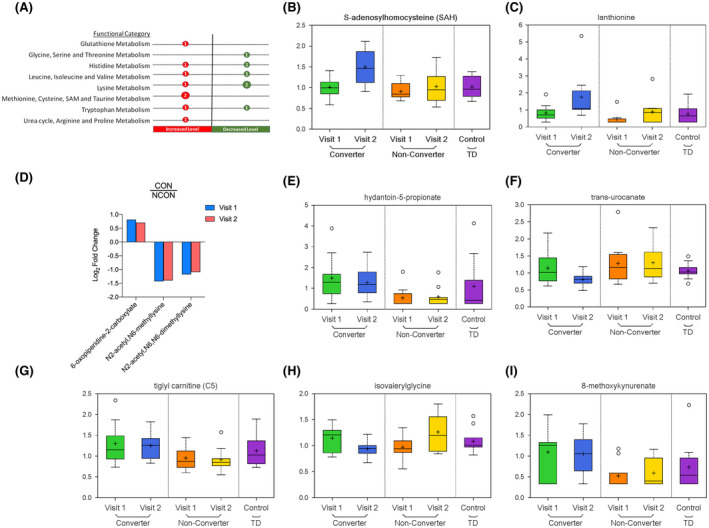
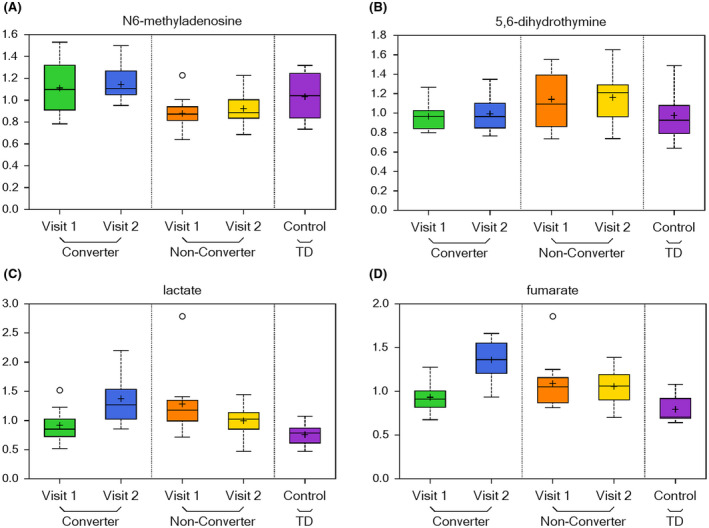
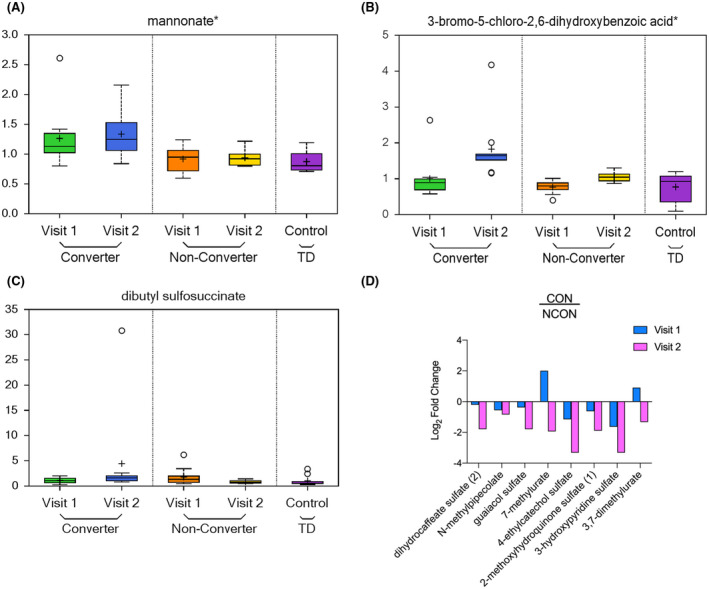
Fragile X-associated Tremor/Ataxia Syndrome (FXTAS) is a neurodegenerative disorder associated with the FMR1 premutation. It is currently unknown when, and if, individual premutation carriers will develop FXTAS. Thus, with the aim of identifying biomarkers for early diagnosis, development, and progression of FXTAS, we performed global metabolomic profiling of premutation carriers (PM) who, as part of an ongoing longitudinal study, emerged into two distinct categories: those who developed symptoms of FXTAS (converters, CON) at subsequent visits and those who did not (non-converters, NCON) and we compared to age-matched healthy controls (HC). We assessed CGG repeat allele size by Southern Blot and PCR analysis. Metabolomic profile was obtained by ultra-performance liquid chromatography, accurate mass spectrometer, and an Orbitrap mass analyzer. In this study we found 47 metabolites were significantly dysregulated between HC and the premutation groups (PM). Importantly, we identified 24 metabolites that showed significant changes in expression in the CON as compared to the NCON both at V1 and V2, and 70 metabolites in CON as compared to NCON but only at V2. These findings suggest the potential role of the identified metabolites as biomarkers for early diagnosis and for FXTAS disease progression, respectively. Interestingly, the majority of the identified metabolites were lipids, followed by amino acids. To our knowledge, this the first report of longitudinal metabolic profiling and identification of unique biomarkers of FXTAS. The lipid metabolism and specifically the sub pathways involved in mitochondrial bioenergetics, as observed in other neurodegenerative disorders, are significantly altered in FXTAS.

Keywords: FMR1; fatty acids; fragile X-associated tremor/ataxia syndrome; metabolomic; molecular biomarkers.


Conflict of interest statement

M. Zafarullah, G. Palczewski and S.M. Rivera: No disclosures to report.

D.R. Hessl: Has received the funding from Novartis, Roche, Seaside Therapeutics LLC and Marinus Pharmaceuticals, Inc. for designing Fragile X clinical Trials.

F. Tassone: Has received the funding from Azrieli Foundation, Zynerba and Asuragen, Inc. for studies in Fragile X syndrome.

Figures

FIGURE 1
FIGURE 1
Differential metabolite expression levels among the HC and the PM groups. A, Heatmap of the 47 most significantly altered metabolites (P < .05) in the PM group as compared to HC at both V1 and V2. Heatmap was generated using PRISM software; red indicates high and green indicates low intensity of the metabolite. B, Representation of the super pathways of metabolism affected in these 47 significantly altered metabolites (P < .05)
FIGURE 2
FIGURE 2
Identification of metabolic biomarkers for early diagnosis of FXTAS. A, Heatmap of the 24 most significantly altered metabolite expression levels (P ≤ .05) in CON at V1 and V2 which distinguish the CON from the NCON. Heatmap was generated using PRISM software; red indicates high and green indicates low intensity of the metabolite compare to the median (white). B, Representation of the super pathways of metabolism involved in these 24 significantly altered metabolites (P ≤ .05)
FIGURE 3
FIGURE 3
Metabolic profiling identified biomarkers of FXTAS disease progression. A, Heatmap of the 70 most significantly altered metabolites (P ≤ .05) in CON compared to NCON at V2 which represent biomarkers of FXTAS disease progression. Heatmap was generated using PRISM software; red indicates high and green indicates low intensity of the metabolite compare to the median (white). B, Representation of the super pathways of metabolism affected in these 70 significantly altered metabolites (P ≤ .05)
FIGURE 4
FIGURE 4
Lipid metabolism is dysregulated in individuals who develop FXTAS over time. A, Number of differentially expressed metabolites by functional categories are shown; circle sizes are proportional to the number of metabolites; red indicates increased and green indicates decrease level in CON as compared to NCON. B, Log2 Fold Change representation of diacylglycerides (DAG) and monoacylglycerides (MAG) in CON as compared to NCON both at V1 and V2. C, Box plots showing increased levels of sphingosine in CON as compared to NCON at V2. The heavy line in each box represents the median, the lower and upper box edges represent the 25th and 75th percentiles, respectively, and the lower and upper whiskers represent the smallest and largest observations, respectively. D, Box plots showing increased levels of sphingosine and sphinganine in CON as compared to NCON at V2. E, Log2 Fold Change representation of ceramides in CON as compared to NCON at V1 and V2. F, Log2 Fold Change representation of Hexocylceramides (HCER) and of Lactosylceramides (LCER) in CON as compared to NCON at V1 and V2. G, Box plots showing increased level of choline in CON as compared to NCON at V2. H, Box plots showing decreased levels of choline phosphate in CON as compared to NCON at V1 and V2. I, Log2 Fold Change representation of endocannabinoids in CON as compared to NCON at V1 and V2
FIGURE 5
FIGURE 5
Altered amino‐acid profiling observed in CON group. A, Number of differentially expressed metabolites by functional categories are shown, circle sizes are proportional to the number of metabolites, red indicates increased and green indicates decrease level in CON as compared to NCON. B, Box plots showing increased levels of S‐adenosylhomocysteine in CON as compared to NCON at V2. For Box Plots the heavy line in each box represents the median, the lower and upper box edges represent the 25th and 75th percentiles, respectively, and the lower and upper whiskers represent the smallest and largest observations, respectively. C, Box plots showing increased levels of lanthionine in CON as compared to NCON at V2. D, Log2 Fold Change representation of metabolites associates with Lysine metabolism in CON as compared to NCON at V1 and V2. E, Box plots showing increased levels of hydantoin‐5‐propionate in CON as compared to NCON at V1 and V2. F, Box plots showing decreased levels of trans‐urocanate in CON as compared to NCON at V2. G, Box plots showing increased level of tiglylcarnitine (C5:1‐DC) in CON as compared to NCON at V1 and V2. H, Box plots showing decreased level of isovalerylglycine in CON as compared to NCON at V2. I, Box plots showing increased level of 8‐methoxykynurenate in CON as compared to NCON at V1 and V2.
FIGURE 6
FIGURE 6
Nucleotide, carbohydrate, energy, and peptide pathways are dysregulated in individuals who develop symptoms of FXTAS over time. A, Box plots showing a biomarker of early disease diagnosis N6‐methyladenosine increased levels in CON as compared to NCON at V1 and V2. For Box Plots the heavy line in each box represents the median, the lower and upper box edges represent the 25th and 75th percentiles, respectively, and the lower and upper whiskers represent the smallest and largest observations, respectively. B, Box plots showing a biomarker of disease progression 5,6‐dihydrouracil increased levels in CON as compared to NCON at V2. C, Box plots showing decreased levels of lactate CON as compared to NCON at V1 that significantly increased at V2. D, Box plots showing increased levels of fumarate in CON as compared to NCON at V2
FIGURE 7
FIGURE 7
Xenobiotics metabolism is perturbed in CON group. A, Box plots showing increased level of mannonate in CON as compared to NCON at V1 and V2. For Box Plots the heavy line in each box represents the median, the lower and upper box edges represent the 25th and 75th percentiles, respectively, and the lower and upper whiskers represent the smallest and largest observations, respectively. B,C, Box plots showing an increased level of 3‐bromo‐5‐chloro‐2,6‐dihydroxybenzoic acid and dibutyl sulfosuccinate in CON as compared to NCON at V2. D, Log2 Fold Change representation of remaining 8 xenobiotics that are decreasing in CON as compared to NCON at V2

References

    1. Heemels M‐T. Neurodegenerative diseases. Nature. 2016;539:179. - PubMed
    1. Hagerman RJ, Hagerman P. Fragile X‐associated tremor/ataxia syndrome — features, mechanisms and management. Nat Rev Neurol. 2016;12:403‐412. - PubMed
    1. Hagerman RJ, Berry‐Kravis E, Hazlett HC, et al. Fragile X syndrome. Nat Rev Dis Primers. 2017;3:17065. - PubMed
    1. Jacquemont S. Penetrance of the Fragile X‐associated tremor/ataxia syndrome in a premutation carrier population. JAMA. 2004;291:460. - PubMed
    1. Tassone F, Iong K, Tong T‐H, et al. FMR1 CGG allele size and prevalence ascertained through newborn screening in the United States. Genome Med. 2012;4:100. - PMC - PubMed

Publication types

Substances

Supplementary concepts