

Individual variation and interactions explain food web responses to global warming
- PMID: 33131431
- PMCID: PMC7662199
- DOI: 10.1098/rstb.2019.0449
Individual variation and interactions explain food web responses to global warming
Abstract
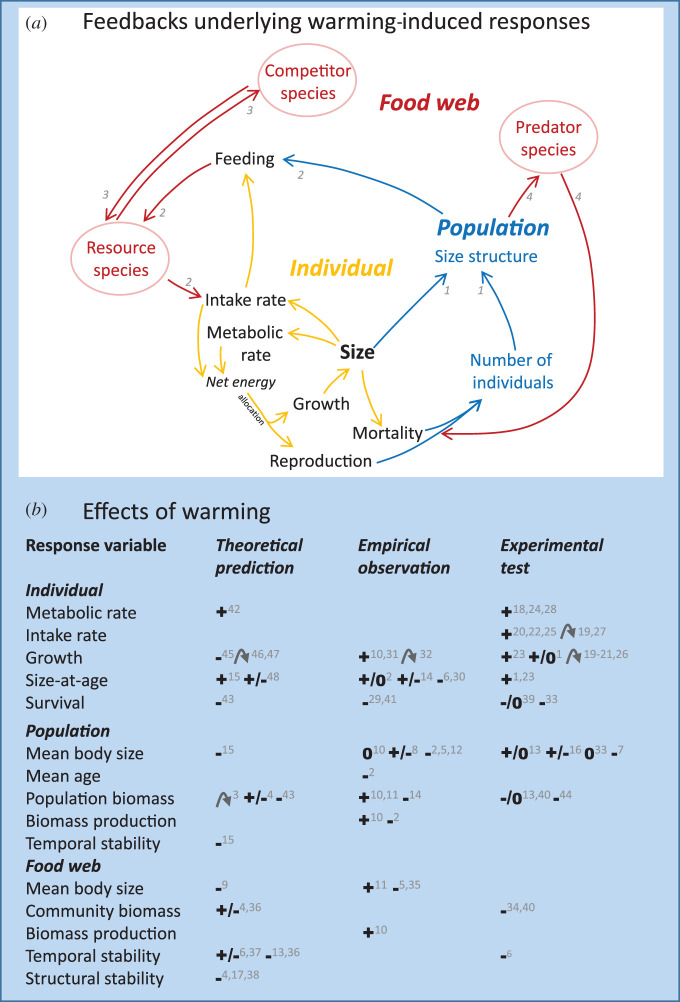
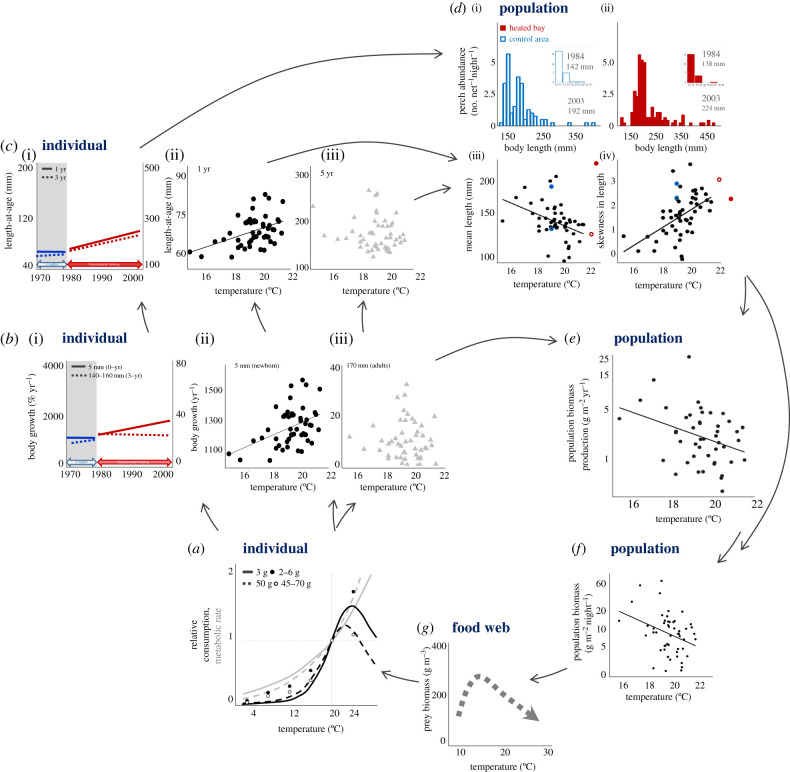
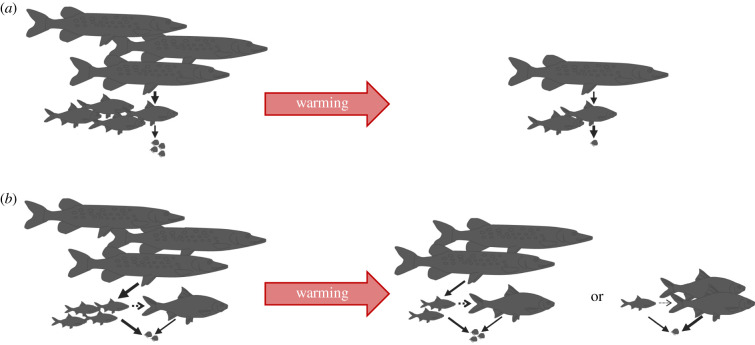
Understanding food web responses to global warming, and their consequences for conservation and management, requires knowledge on how responses vary both among and within species. Warming can reduce both species richness and biomass production. However, warming responses observed at different levels of biological organization may seem contradictory. For example, higher temperatures commonly lead to faster individual body growth but can decrease biomass production of fishes. Here we show that the key to resolve this contradiction is intraspecific variation, because (i) community dynamics emerge from interactions among individuals, and (ii) ecological interactions, physiological processes and warming effects often vary over life history. By combining insights from temperature-dependent dynamic models of simple food webs, observations over large temperature gradients and findings from short-term mesocosm and multi-decadal whole-ecosystem warming experiments, we resolve mechanisms by which warming waters can affect food webs via individual-level responses and review their empirical support. We identify a need for warming experiments on food webs manipulating population size structures to test these mechanisms. We stress that within-species variation in both body size, temperature responses and ecological interactions are key for accurate predictions and appropriate conservation efforts for fish production and food web function under a warming climate. This article is part of the theme issue 'Integrative research perspectives on marine conservation'.
Keywords: body growth; climate change; fish production; population size structure; predator–prey; trait variation.
Conflict of interest statement
We declare we have no competing interests.
Figures
Similar articles
-
Combining mesocosms with models reveals effects of global warming and ocean acidification on a temperate marine ecosystem.Ecol Appl. 2024 Jun;34(4):e2977. doi: 10.1002/eap.2977. Epub 2024 May 5. Ecol Appl. 2024. PMID: 38706047
-
Temperature impacts on fish physiology and resource abundance lead to faster growth but smaller fish sizes and yields under warming.Glob Chang Biol. 2022 Nov;28(21):6239-6253. doi: 10.1111/gcb.16341. Epub 2022 Aug 11. Glob Chang Biol. 2022. PMID: 35822557 Free PMC article.
-
Bottom-up and top-down effects of browning and warming on shallow lake food webs.Glob Chang Biol. 2019 Feb;25(2):504-521. doi: 10.1111/gcb.14521. Epub 2018 Dec 14. Glob Chang Biol. 2019. PMID: 30430702
-
Causes and consequences of ontogenetic dietary shifts: a global synthesis using fish models.Biol Rev Camb Philos Soc. 2019 Apr;94(2):539-554. doi: 10.1111/brv.12468. Epub 2018 Sep 24. Biol Rev Camb Philos Soc. 2019. PMID: 30251433 Review.
-
Climate change effects on fishes and fisheries: towards a cause-and-effect understanding.J Fish Biol. 2010 Nov;77(8):1745-79. doi: 10.1111/j.1095-8649.2010.02783.x. Epub 2010 Sep 23. J Fish Biol. 2010. PMID: 21078088 Review.
Cited by
-
Multi-decadal warming alters predator's effect on prey community composition.Proc Biol Sci. 2024 Aug;291(2028):20240511. doi: 10.1098/rspb.2024.0511. Epub 2024 Aug 7. Proc Biol Sci. 2024. PMID: 39110169 Free PMC article.
-
Effects of temporal abiotic drivers on the dynamics of an allometric trophic network model.Ecol Evol. 2023 Mar 23;13(3):e9928. doi: 10.1002/ece3.9928. eCollection 2023 Mar. Ecol Evol. 2023. PMID: 36969931 Free PMC article.
-
Increased importance of cool-water fish at high latitudes emerges from individual-level responses to warming.Ecol Evol. 2023 Jun 6;13(6):e10185. doi: 10.1002/ece3.10185. eCollection 2023 Jun. Ecol Evol. 2023. PMID: 37293123 Free PMC article.
-
Effects of warming on the structure of aquatic communities in tropical bromeliad microecosystems.Ecol Evol. 2023 Feb 22;13(2):e9824. doi: 10.1002/ece3.9824. eCollection 2023 Feb. Ecol Evol. 2023. PMID: 36844665 Free PMC article.
-
Larger but younger fish when growth outpaces mortality in heated ecosystem.Elife. 2023 May 9;12:e82996. doi: 10.7554/eLife.82996. Elife. 2023. PMID: 37157843 Free PMC article.
References
-
- Gruner DS, Bracken MES, Berger SA, Eriksson BK, Gamfeldt L, Matthiessen B, Moorthi S, Sommer U, Hillebrand H. 2017. Effects of experimental warming on biodiversity depend on ecosystem type and local species composition. Oikos 126, 8–17. (10.1111/oik.03688) - DOI
Publication types
MeSH terms
Associated data
LinkOut - more resources
Full Text Sources
