. 2020 Dec 21;375(1814):20190445.
doi: 10.1098/rstb.2019.0445. Epub 2020 Nov 2.

Linking dimensions of data on global marine animal diversity

Affiliations

Linking dimensions of data on global marine animal diversity

Thomas J Webb et al. Philos Trans R Soc Lond B Biol Sci. .

Abstract

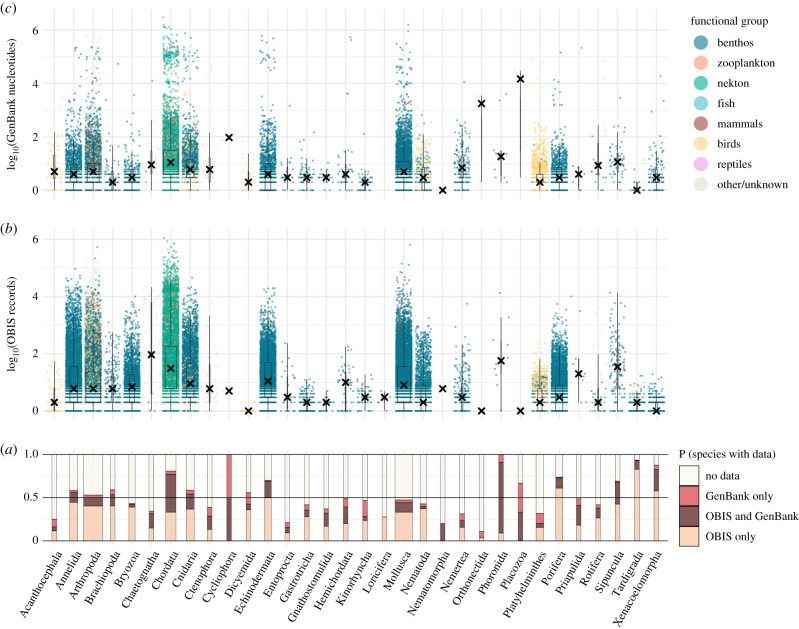
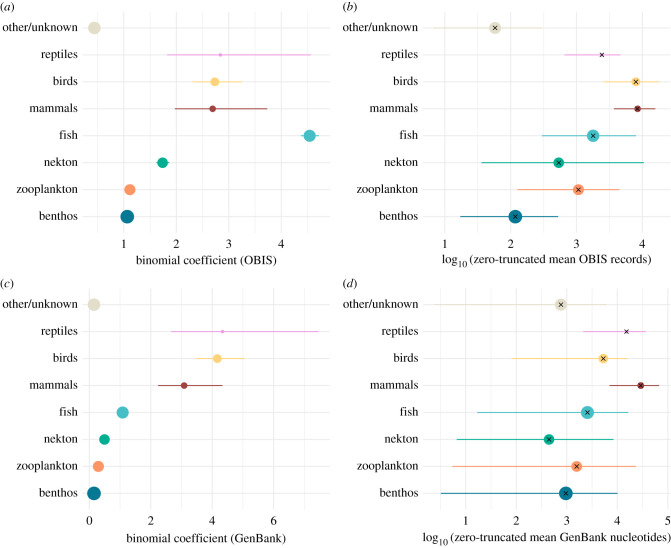
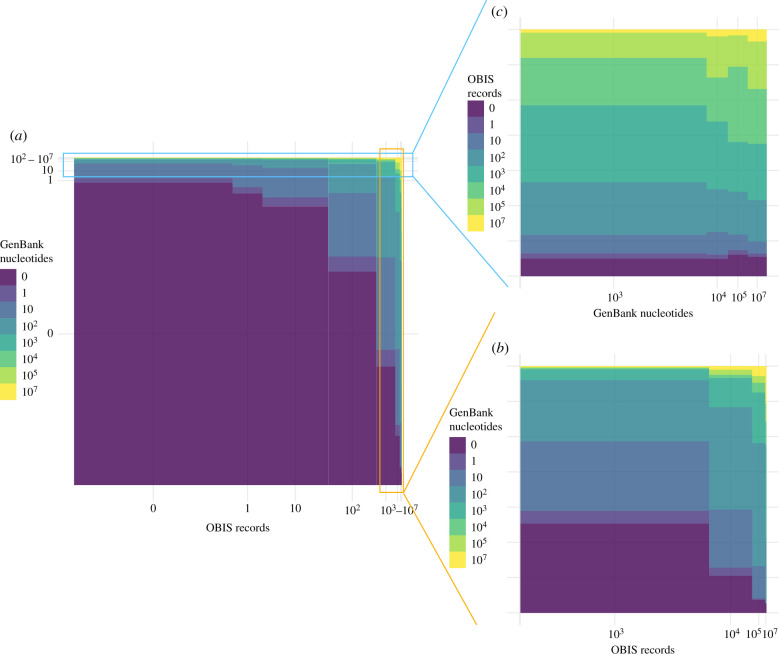
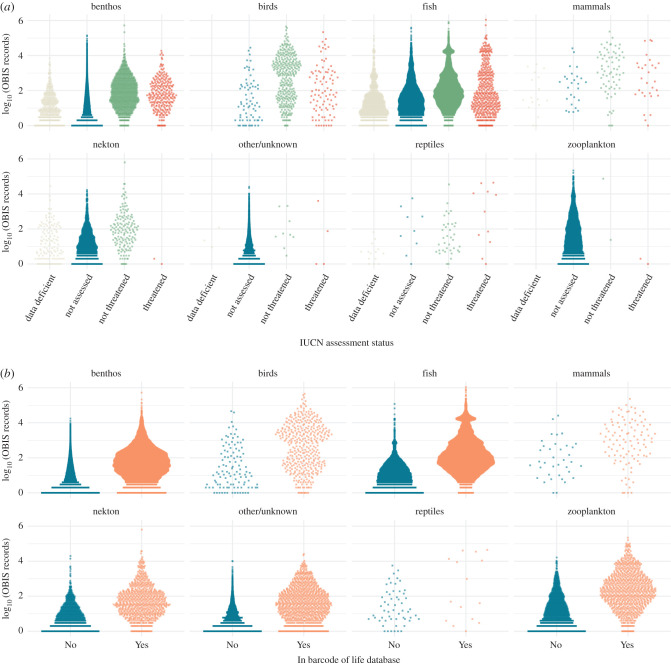
Recent decades have seen an explosion in the amount of data available on all aspects of biodiversity, which has led to data-driven approaches to understand how and why diversity varies in time and space. Global repositories facilitate access to various classes of species-level data including biogeography, genetics and conservation status, which are in turn required to study different dimensions of diversity. Ensuring that these different data sources are interoperable is a challenge as we aim to create synthetic data products to monitor the state of the world's biodiversity. One way to approach this is to link data of different classes, and to inventory the availability of data across multiple sources. Here, we use a comprehensive list of more than 200 000 marine animal species, and quantify the availability of data on geographical occurrences, genetic sequences, conservation assessments and DNA barcodes across all phyla and broad functional groups. This reveals a very uneven picture: 44% of species are represented by no record other than their taxonomy, but some species are rich in data. Although these data-rich species are concentrated into a few taxonomic and functional groups, especially vertebrates, data are spread widely across marine animals, with members of all 32 phyla represented in at least one database. By highlighting gaps in current knowledge, our census of marine diversity data helps to prioritize future data collection activities, as well as emphasizing the importance of ongoing sustained observations and archiving of existing data into global repositories. This article is part of the theme issue 'Integrative research perspectives on marine conservation'.

Keywords: conservation status; ecoinformatics; global occurrences; linked data; marine biodiversity.


Conflict of interest statement

We declare we have no competing interests.

Figures

Figure 1.
Figure 1.
Availability of biogeographic (over 45 M OBIS occurrence records) and genetic (over 56 M GenBank nucleotides) data across 206 849 marine animal species, summarized by phylum and by broad functional group. (a) Proportion of species in each phylum with data in either database, both databases, or neither. Bar width is proportional to the number of species in each phylum. The number of (b) OBIS occurrence records and (c) GenBank nucleotide sequences are shown for species that occur in the respective database. Each point represents a species, coloured by functional group. Box plots are superimposed with X marking the median number of records within each phylum. Phylum size varies from two species (Cycliophora) to 57 336 species (Arthropoda).
Figure 2.
Figure 2.
Coefficients from the hurdle models of data availability across functional groups, first modelling presence in a database with a binomial model, and then non-zero counts of records in a database with a negative binomial model. Species presence in OBIS (a) or GenBank nucleotide database (c) across functional groups is indicated with binomial coefficients (with 95% confidence intervals) on the response scale, representing the ratio of the probabilities of species within a group having records in the database versus not having records in the database. For the subset of species present in (b) OBIS or (d) GenBank, the empirical mean number of records per species is plotted together with bootstrapped 95% confidence intervals. For each group, the predicted non-zero count from the hurdle model is indicated with an X. Point size is scaled to the total number of species in each functional group (a,c, ranging from 96 reptiles to 146 551 benthos) and to the number of species in each group with records in OBIS (b, 71 reptiles to 75 604 benthos) or GenBank (d, 78 reptiles to 19 235 benthos).
Figure 3.
Figure 3.
Mosaic plot showing the joint distribution of species between categories of OBIS records and GenBank nucleotides. Panel (a) shows all species, and is dominated by species with no records in either database, (b) zooms in on species with high numbers (greater than 100) of OBIS records and (c) reverses the axes and zooms in on species with high numbers (greater than 100) of GenBank nucleotides. Axis labels indicate the number of records at the right-hand bound of each category.
Figure 4.
Figure 4.
Distribution of occurrence records across 106 213 marine animal species present in OBIS by functional group and by (a) IUCN assessment status and (b) presence in the Barcode of Life Data System. Each point represents a species.

Similar articles

Cited by

References

    1. Redelings BD, Holder MT. 2017. A supertree pipeline for summarizing phylogenetic and taxonomic information for millions of species. PeerJ 5, e3058 (10.7717/peerj.3058) - DOI - PMC - PubMed
    1. Hinchliff CE, et al. 2015. Synthesis of phylogeny and taxonomy into a comprehensive tree of life. Proc. Natl Acad. Sci. USA 112, 12 764–12 769. (10.1073/pnas.1423041112) - DOI - PMC - PubMed
    1. Clark K, Karsch-Mizrachi I, Lipman DJ, Ostell J, Sayers EW. 2016. GenBank. Nucleic Acids Res. 44, D67–D72. (10.1093/nar/gkv1276) - DOI - PMC - PubMed
    1. Leray M, Knowlton N, Ho S-L, Nguyen BN, Machida RJ. 2019. GenBank is a reliable resource for 21st century biodiversity research. Proc. Natl Acad. Sci. USA 116, 22 651–22 656. (10.1073/pnas.1911714116) - DOI - PMC - PubMed
    1. GBIF. 2020. GBIF Home Page. See https://www.gbif.org.

Publication types

LinkOut - more resources