. 2021 Jan 5:890:173666.
doi: 10.1016/j.ejphar.2020.173666. Epub 2020 Oct 24.

Imatinib improves insulin resistance and inhibits injury-induced neointimal hyperplasia in high fat diet-fed mice

Affiliations

Imatinib improves insulin resistance and inhibits injury-induced neointimal hyperplasia in high fat diet-fed mice

Prahalathan Pichavaram et al. Eur J Pharmacol. .

Abstract

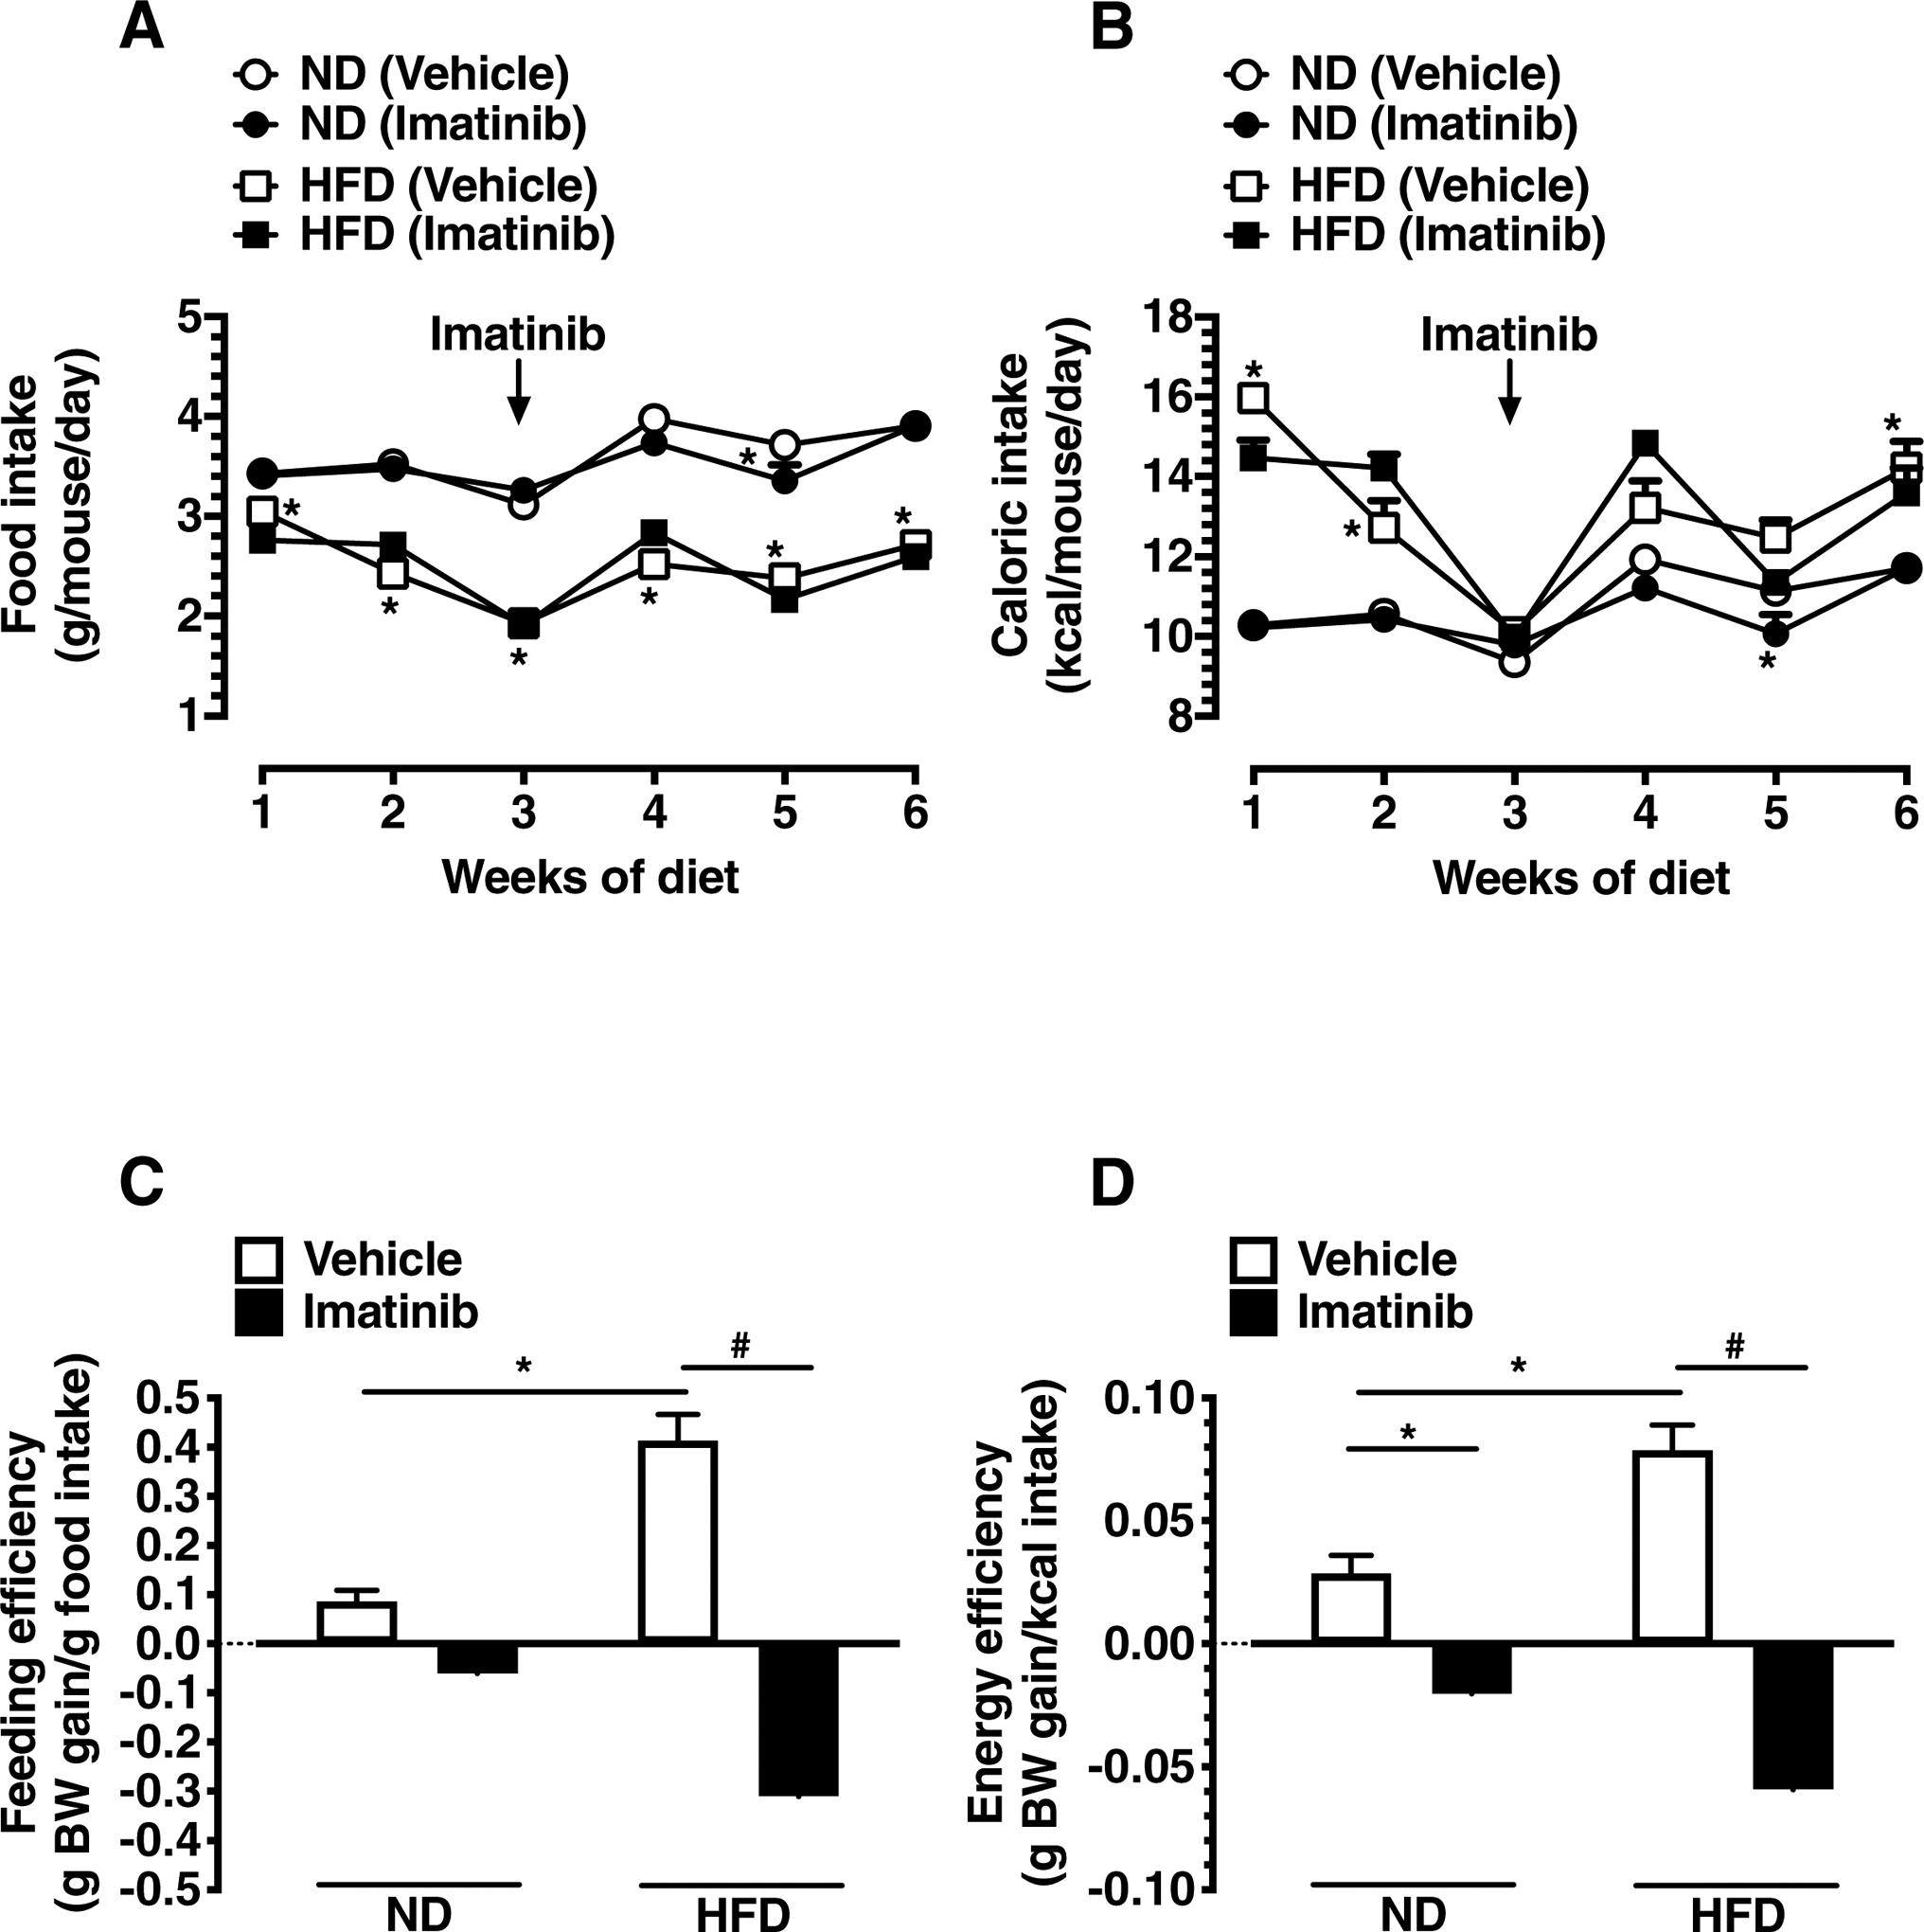
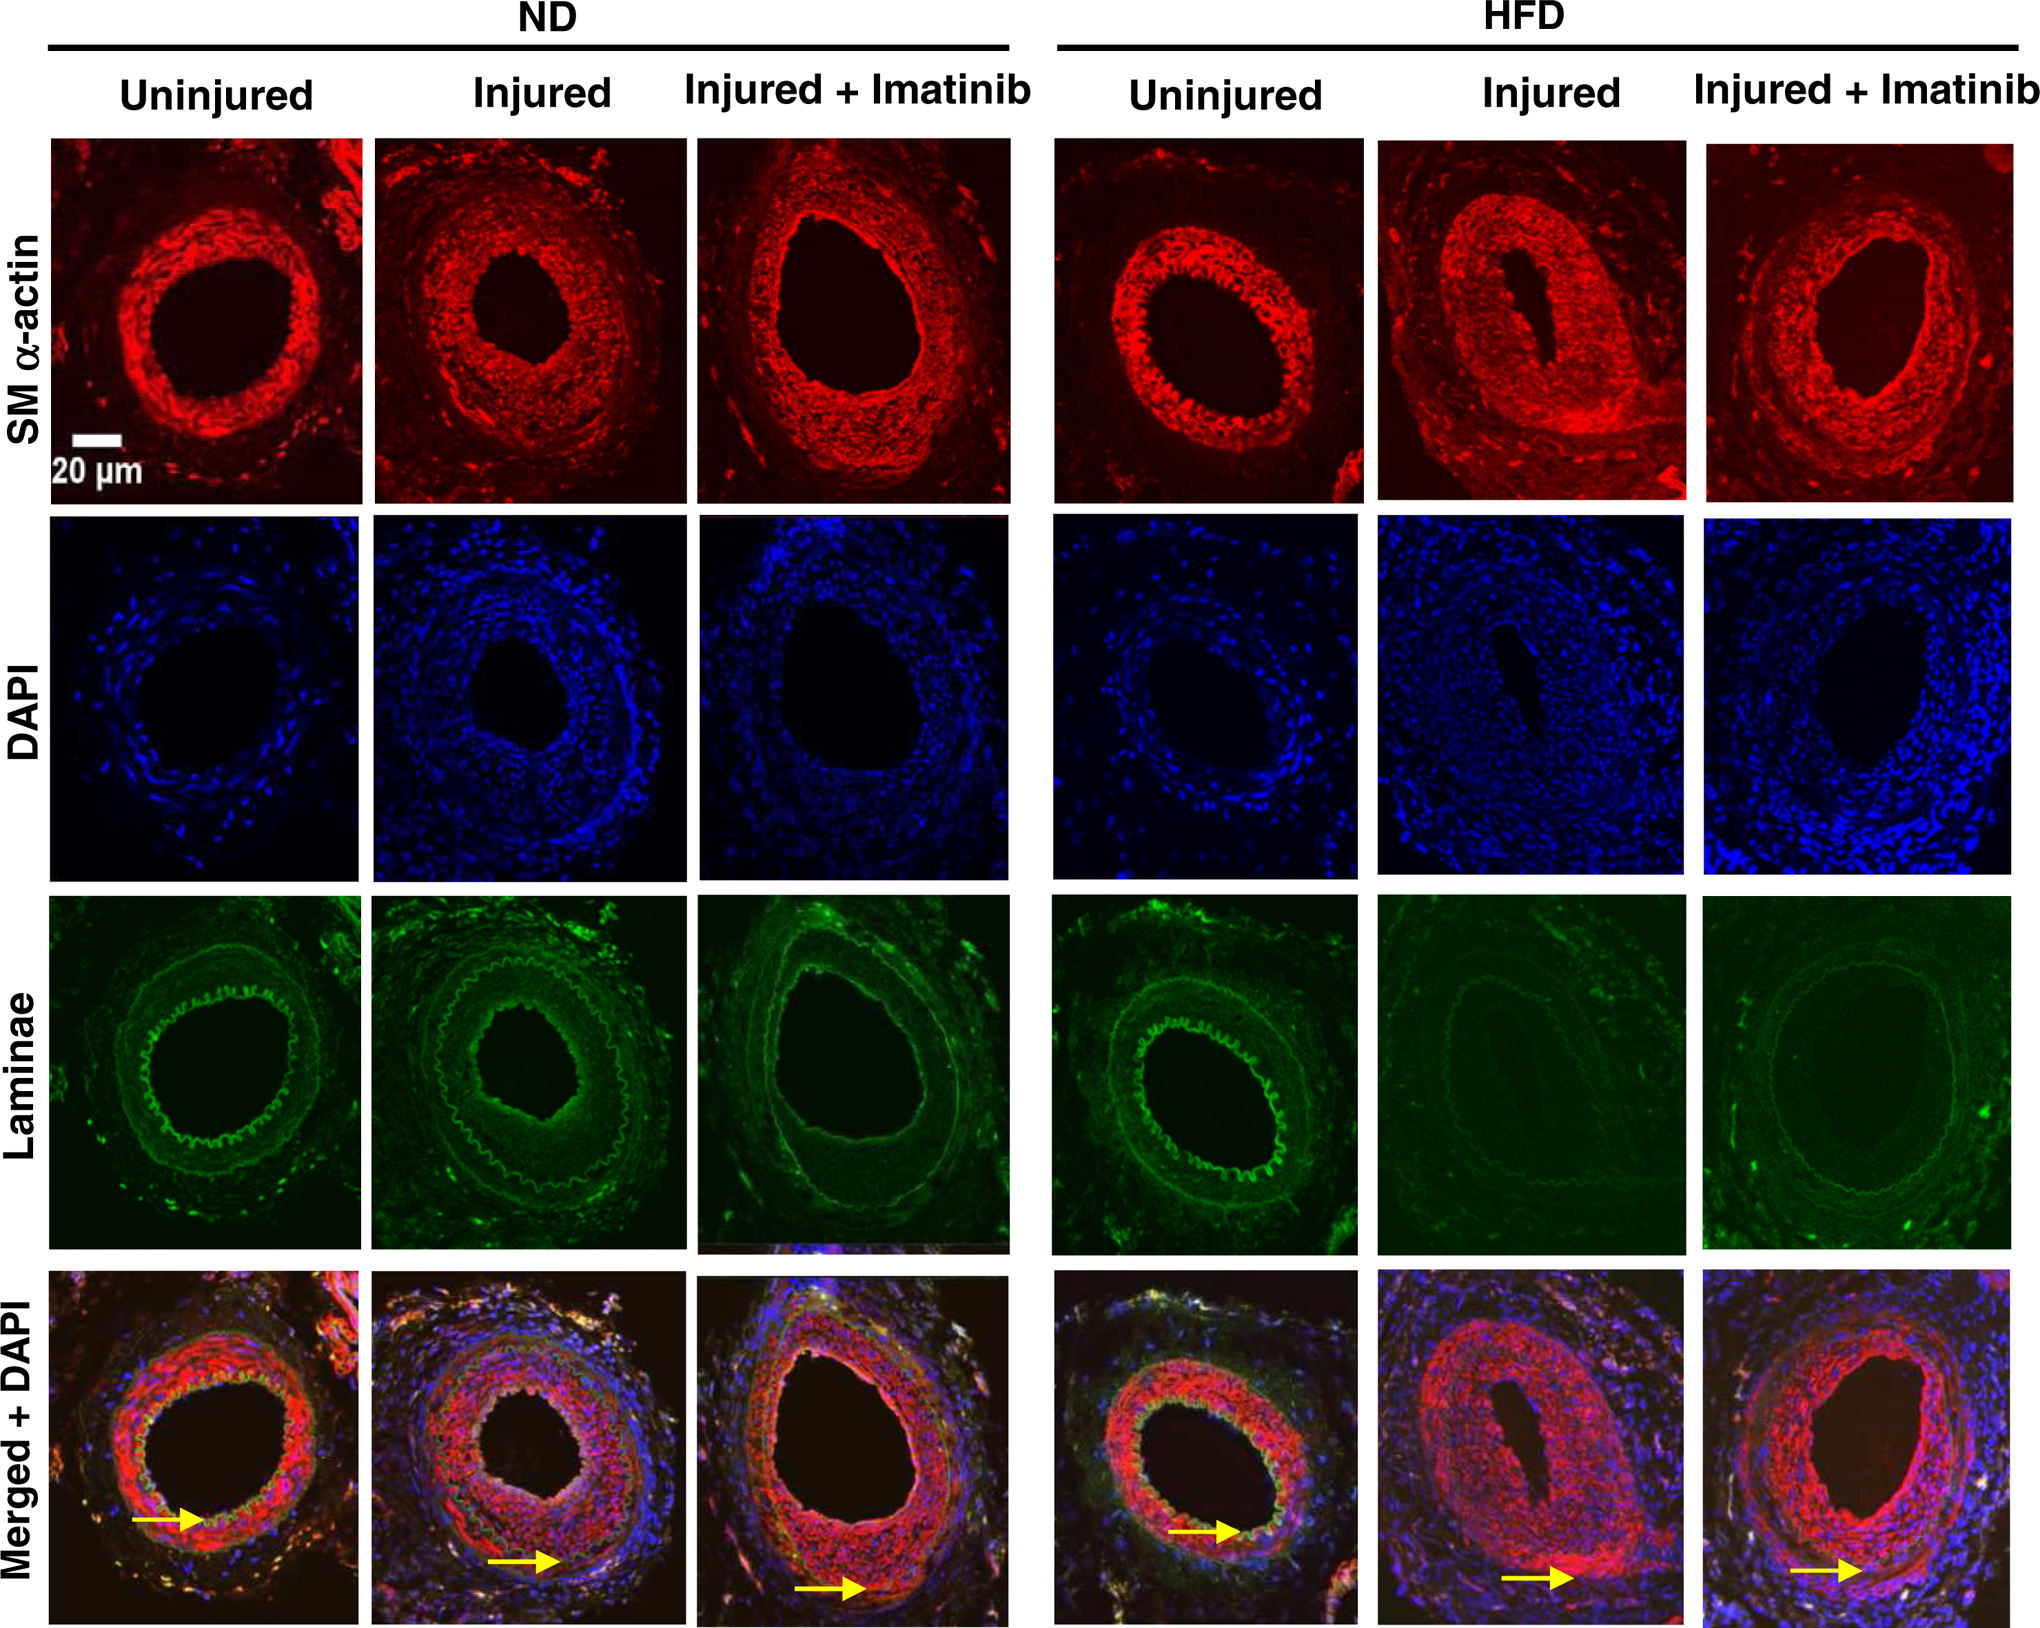
Imatinib, a PDGF receptor tyrosine kinase inhibitor, has been shown to suppress intimal hyperplasia in different animal models under normal metabolic milieu, diabetic, and/or hypercholesterolemic conditions. However, the impact of imatinib treatment on injury-induced neointimal hyperplasia has not yet been investigated in the setting of insulin resistance without frank diabetes. Using a mouse model of high fat diet (HFD)-induced insulin resistance and guidewire-induced arterial injury, the present study demonstrates that intraperitoneal administration of imatinib (25 mg/kg/day) for ~3 weeks resulted in a marked attenuation of neointimal hyperplasia (intima/media ratio) by ~78% (n = 6-9 per group; P < 0.05). Imatinib treatment also led to significant improvements in key metabolic parameters. In particular, imatinib improved insulin resistance and glucose tolerance, as revealed by complete inhibition of HFD-induced increase in HOMA-IR index and AUCIPGTT, respectively. In addition, imatinib treatment led to diminutions in HFD-induced increases in plasma total cholesterol and triglycerides by ~73% and ~59%, respectively. Furthermore, imatinib decreased HFD-induced increase in visceral fat accumulation by ~51% (as determined by epididymal white adipose tissue weight). Importantly, imatinib treatment in HFD-fed mice enhanced plasma levels of high-molecular-weight adiponectin by ~2-fold without affecting total adiponectin. However, there were no significant changes in mean arterial pressure in insulin-resistant state or after imatinib exposure, as measured by tail-cuff method. Together, the present findings suggest that targeting PDGF receptor tyrosine kinase using imatinib may provide a realistic treatment option to prevent injury-induced neointimal hyperplasia and diet-induced insulin resistance in obesity.

Keywords: Adiponectin; Arterial injury; Imatinib; Insulin resistance; Neointimal hyperplasia; PDGF.


Conflict of interest statement

Declaration of competing interest

The authors declare no conflict of interests.

Figures

Fig. 1.
Fig. 1.
Effects of imatinib on body weight in HFD-fed mice. Eight-week old mice were fed a ND or HFD for 6 weeks (42 days). Imatinib was injected intraperitoneally (25 mg/kg/day) on the day prior to femoral artery injury (day 21) and for 3 weeks post-femoral artery injury (day 22 to day 42). A) Linear graph shows body weights determined once a week for 6 weeks. B) Bar graph shows changes in body weights after imatinib treatment (body weight at the end of 6th week of diet minus body weight before starting imatinib/vehicle treatment). The data shown are means ± S.E.M. (n = 5–6 mice/group). * P < 0.05 compared with ND; # P < 0.05 compared with HFD, using repeated measures two-way ANOVA followed by Bonferroni multiple comparisons test (A) or regular two-way ANOVA followed by Tukey multiple comparisons test (B). ND: normal diet; HFD: high fat diet.
Fig. 2.
Fig. 2.
Effects of imatinib on food and caloric intakes, and feeding and energy efficiencies in HFD-fed mice. A) Linear graph shows average daily food intakes in ND- and HFD-fed mice. B) Linear graph shows changes in caloric intakes for 6 weeks. C-D) Bar graphs show changes in feeding and caloric efficiencies after imatinib treatment (day 21–42). The data shown are the means ± S.E.M. (n = 6 mice/group). * P < 0.05 compared with ND; # P < 0.05 compared with HFD, using repeated measures two-way ANOVA followed by Bonferroni multiple comparisons test (A-B) or regular two-way ANOVA followed by Tukey multiple comparisons test (C-D). BW, body weight.
Fig. 3.
Fig. 3.
Effects of imatinib on glucose tolerance in HFD-fed mice. A) Linear graph shows changes in blood glucose levels during IPGTT. IPGTT was performed in mice on day 41 by injecting fresh glucose solution (2 g/kg) and determining blood glucose at the indicated time points. B) Bar graph shows changes in AUCIPGTT. The data shown are the means ± S.E.M. (n = 6 mice/group). * P < 0.05 compared with ND; # P < 0.05 compared with HFD, using repeated measures two-way ANOVA followed by Bonferroni multiple comparisons test (A) or regular two-way ANOVA followed by Tukey multiple comparisons test (B). IPGTT: intraperitoneal glucose tolerance test; AUC: area under the curve.
Fig. 4.
Fig. 4.
Effects of imatinib on injury-induced neointimal hyperplasia in HFD-fed mice. Imatinib was administered intraperitoneally (25 mg/kg/day) on the day prior to femoral artery injury and for 3 weeks post-femoral artery injury. Subsequently, uninjured and injured femoral artery segments from ND-fed mice and HFD-fed mice (− or + imatinib treatment) were subjected to staining procedures for: A) H&E and B) EVG, as described in ‘Materials and methods’. The arrowheads indicate internal and external elastic laminae; scale bars represent 20 μm; magnification. C-D) Morphometric analyses of injured femoral arteries that include neointima/media ratio and neointimal area. The data shown are the means ± S.E.M. (n = 6–9 mice/group). * P < 0.05 compared with ND; # P < 0.05 compared with HFD; using regular two-way ANOVA followed by Tukey multiple comparisons test.
Fig. 4.
Fig. 4.
Effects of imatinib on injury-induced neointimal hyperplasia in HFD-fed mice. Imatinib was administered intraperitoneally (25 mg/kg/day) on the day prior to femoral artery injury and for 3 weeks post-femoral artery injury. Subsequently, uninjured and injured femoral artery segments from ND-fed mice and HFD-fed mice (− or + imatinib treatment) were subjected to staining procedures for: A) H&E and B) EVG, as described in ‘Materials and methods’. The arrowheads indicate internal and external elastic laminae; scale bars represent 20 μm; magnification. C-D) Morphometric analyses of injured femoral arteries that include neointima/media ratio and neointimal area. The data shown are the means ± S.E.M. (n = 6–9 mice/group). * P < 0.05 compared with ND; # P < 0.05 compared with HFD; using regular two-way ANOVA followed by Tukey multiple comparisons test.
Fig. 5.
Fig. 5.
Effects of imatinib on injury-induced neointimal hyperplasia as revealed by SM α-actin immunoreactivity. Confocal immunofluorescence analysis of SM α-actin in femoral artery sections: uninjured, left panel; injured, middle panel; and injured + imatinib, right panel. The representative images for SM α-actin immunoreactivity (red) are shown along with nuclei staining (DAPI, blue), elastin autofluorescence (laminae, green), and merged images. The arrowheads indicate internal and external elastic laminae; scale bars represent 20 μm. The images shown are representative of arterial injury from 3 mice/group.

References

    1. Abderrahmani A, Yengo L, Caiazzo R, Canouil M, Cauchi S, Raverdy V, Plaisance V, Pawlowski V, Lobbens S, Maillet J, Rolland L, Boutry R, Queniat G, Kwapich M, Tenenbaum M, Bricambert J, Saussenthaler S, Anthony E, Jha P, Derop J, Sand O, Rabearivelo I, Leloire A, Pigeyre M, Daujat-Chavanieu M, Gerbal-Chaloin S, Dayeh T, Lassailly G, Mathurin P, Staels B, Auwerx J, Schurmann A, Postic C, Schafmayer C, Hampe J, Bonnefond A, Pattou F, Froguel P, 2018. Increased Hepatic PDGF-AA Signaling Mediates Liver Insulin Resistance in Obesity-Associated Type 2 Diabetes. Diabetes 67, 1310–1321. - PubMed
    1. Auger KR, Serunian LA, Soltoff SP, Libby P, Cantley LC, 1989. PDGF-dependent tyrosine phosphorylation stimulates production of novel polyphosphoinositides in intact cells. Cell 57, 167–175. - PubMed
    1. Baroni MG, D’Andrea MP, Montali A, Pannitteri G, Barilla F, Campagna F, Mazzei E, Lovari S, Seccareccia F, Campa PP, Ricci G, Pozzilli P, Urbinati G, Arca M, 1999. A common mutation of the insulin receptor substrate-1 gene is a risk factor for coronary artery disease. Arterioscler. Thromb. Vasc. Biol 19, 2975–2980. - PubMed
    1. Barrett TB, Benditt EP, 1987. sis (platelet-derived growth factor B chain) gene transcript levels are elevated in human atherosclerotic lesions compared to normal artery. Proc. Natl. Acad. Sci. USA 84, 1099–1103. - PMC - PubMed
    1. Boucher P, Gotthardt M, Li WP, Anderson RG, Herz J, 2003. LRP: role in vascular wall integrity and protection from atherosclerosis. Science 300, 329–332. - PubMed

MeSH terms

Substances