

Sensitivity analysis for publication bias in meta-analyses
- PMID: 33132447
- PMCID: PMC7590147
- DOI: 10.1111/rssc.12440
Sensitivity analysis for publication bias in meta-analyses
Abstract
We propose sensitivity analyses for publication bias in meta-analyses. We consider a publication process such that 'statistically significant' results are more likely to be published than negative or "non-significant" results by an unknown ratio, η. Our proposed methods also accommodate some plausible forms of selection based on a study's standard error. Using inverse probability weighting and robust estimation that accommodates non-normal population effects, small meta-analyses, and clustering, we develop sensitivity analyses that enable statements such as 'For publication bias to shift the observed point estimate to the null, "significant" results would need to be at least 30 fold more likely to be published than negative or "non-significant" results'. Comparable statements can be made regarding shifting to a chosen non-null value or shifting the confidence interval. To aid interpretation, we describe empirical benchmarks for plausible values of η across disciplines. We show that a worst-case meta-analytic point estimate for maximal publication bias under the selection model can be obtained simply by conducting a standard meta-analysis of only the negative and 'non-significant' studies; this method sometimes indicates that no amount of such publication bias could 'explain away' the results. We illustrate the proposed methods by using real meta-analyses and provide an R package: PublicationBias.
Keywords: File drawer; Meta‐analysis; Publication bias; Sensitivity analysis.
© 2020 The Authors Journal of the Royal Statistical Society: Series C (Applied Statistics) Published by John Wiley & Sons Ltd on behalf of the Royal Statistical Society.
Figures
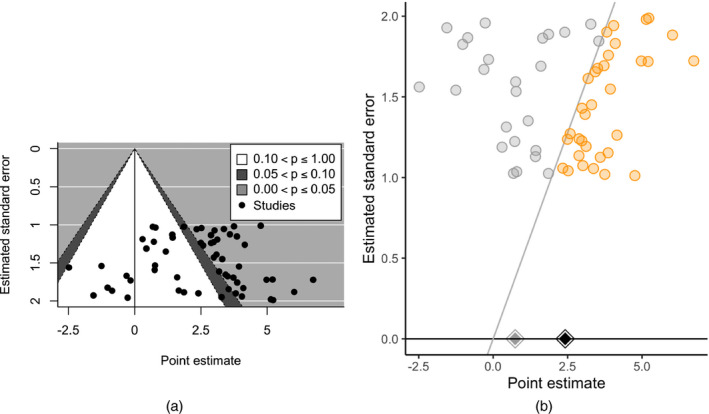
 , non‐affirmative;
  , affirmative;
  , robust independent point estimate within all studies;
  , robust independent point estimate within only the non‐affirmative studies
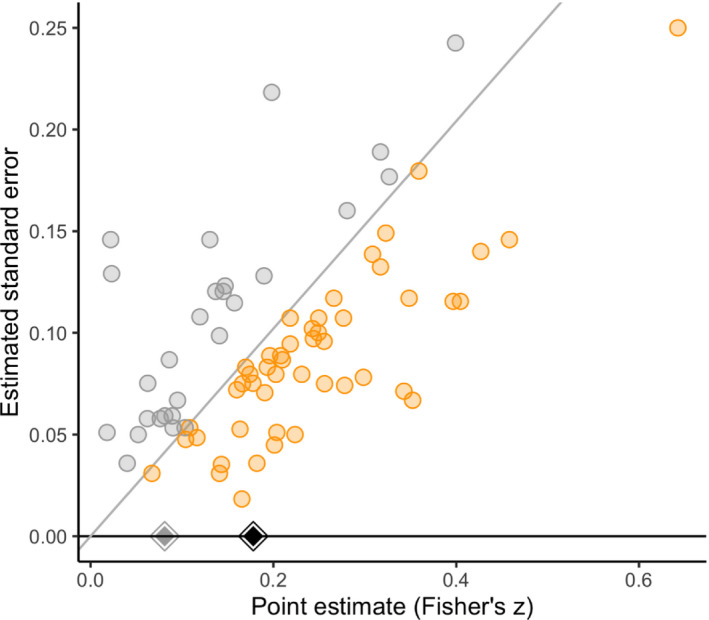 , non‐affirmative; , affirmative; , robust clustered estimate in non‐affirmative studies only; , robust clustered estimate in all studies
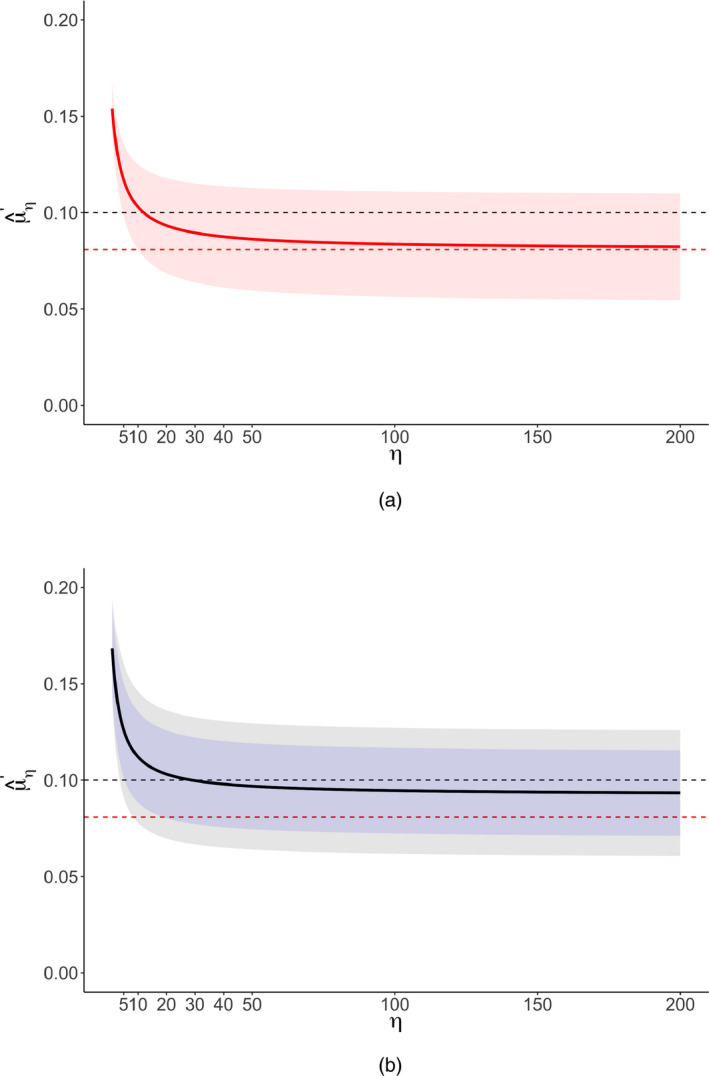
 , non‐null value q
′;
, non‐null value q
′;  , worst‐case estimates): (a) common effect specification; (b) robust specifications (
 , CI assuming independence;
  , CI allowing for clustering)
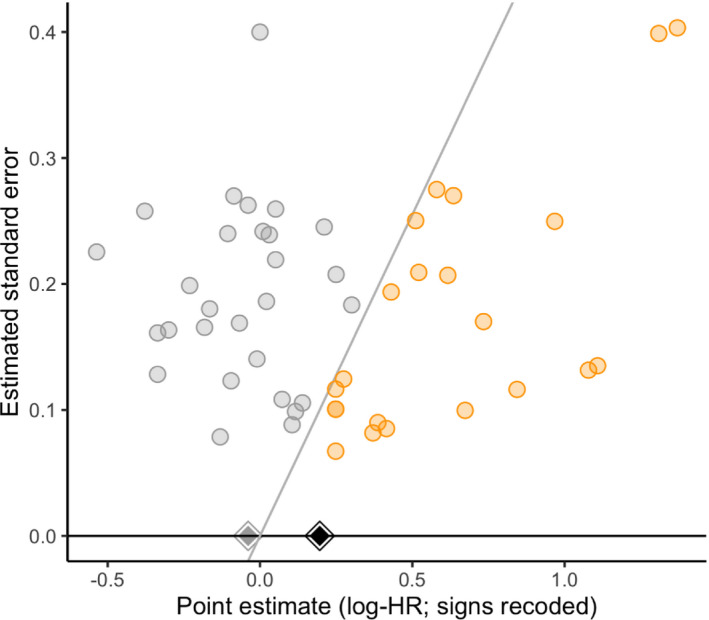 , non‐affirmative; , affirmative; , robust clustered estimate in non‐affirmative studies only; , robust clustered estimate in all studies
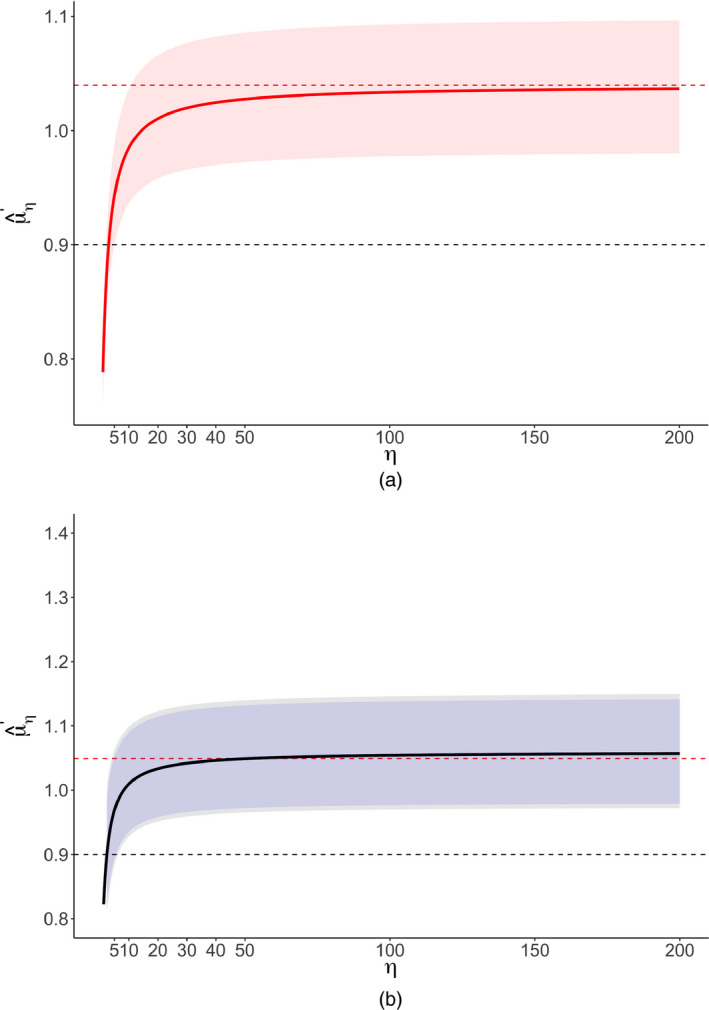 , non‐null value q
′; , worst‐case estimates): (a) common effect specification; (b) robust specifications (, CI assuming independence; , CI allowing for clustering)
, non‐null value q
′; , worst‐case estimates): (a) common effect specification; (b) robust specifications (, CI assuming independence; , CI allowing for clustering)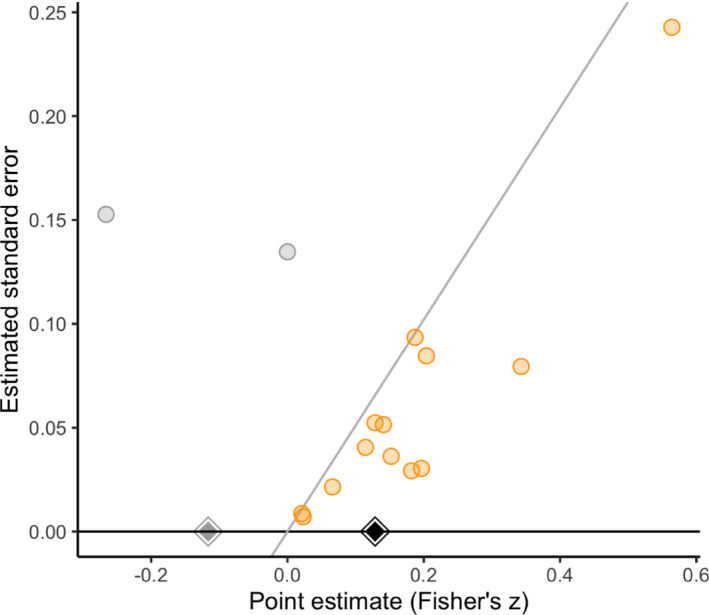 , non‐affirmative; , affirmative; , robust clustered estimate in non‐affirmative studies only; , robust clustered estimate in all studies
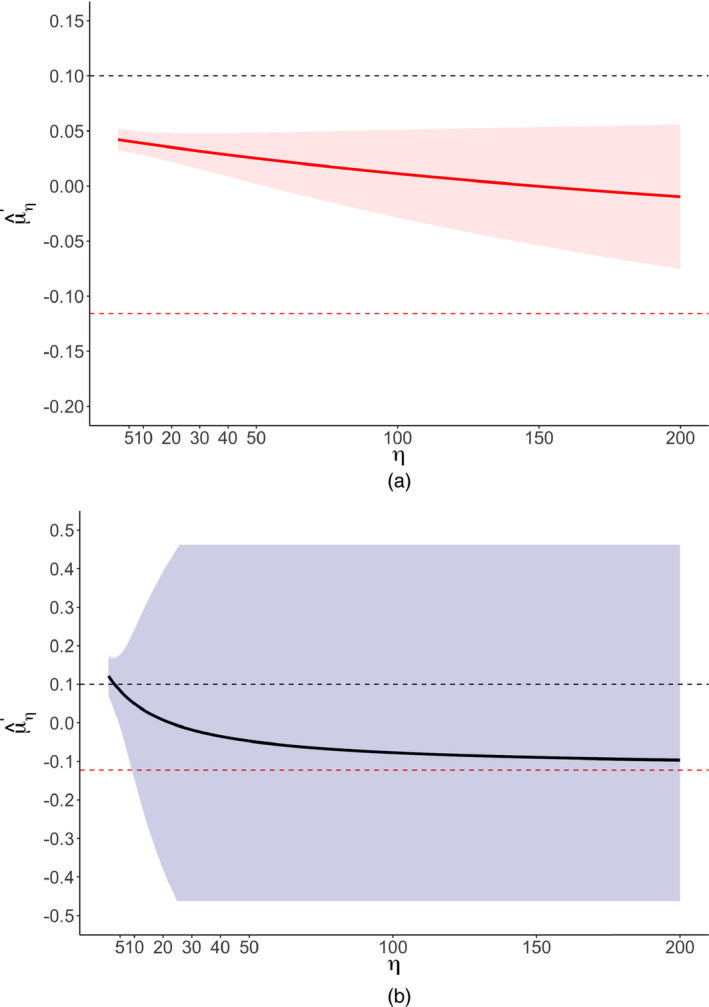 , non‐null value q
′; , worst‐case estimates): (a) common effect specification; (b) robust specifications ( CI assuming independence; , CI allowing for clustering)
, non‐null value q
′; , worst‐case estimates): (a) common effect specification; (b) robust specifications ( CI assuming independence; , CI allowing for clustering)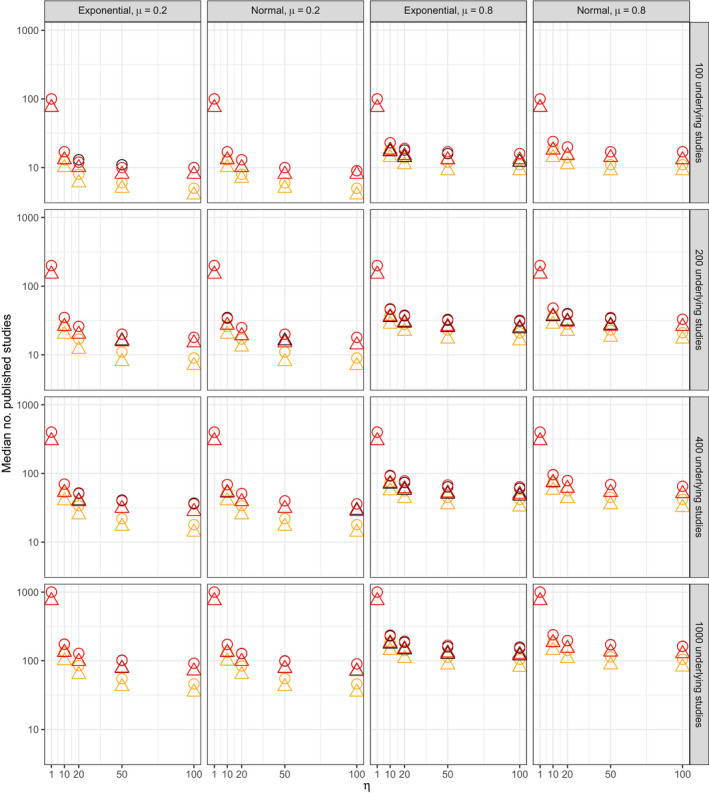
 , not selected on standard error;
  , selected for small standard error;
  , common effect;
  , robust clustered;
  , robust independent
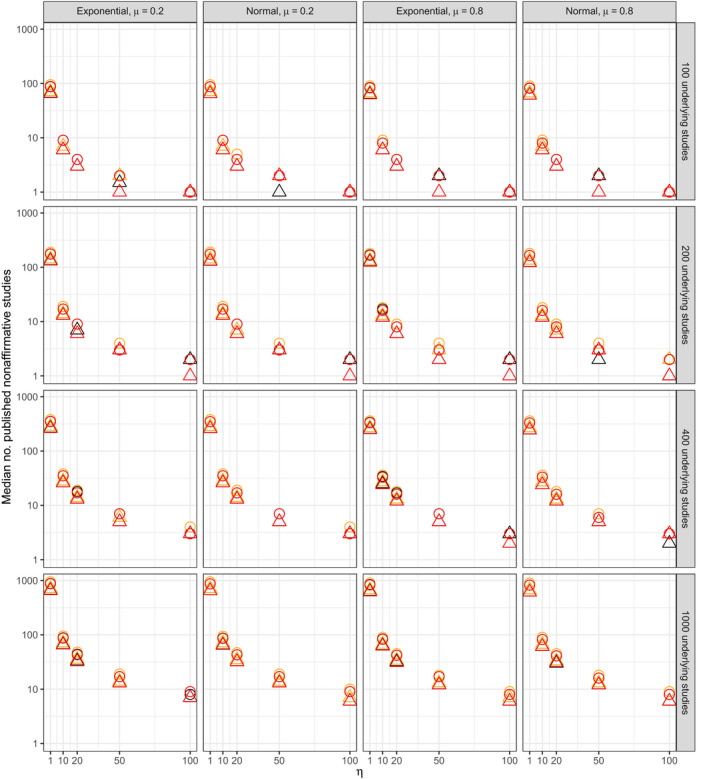 , not selected on standard error; , selected for small standard error; , common effect; , robust clustered; , robust independent
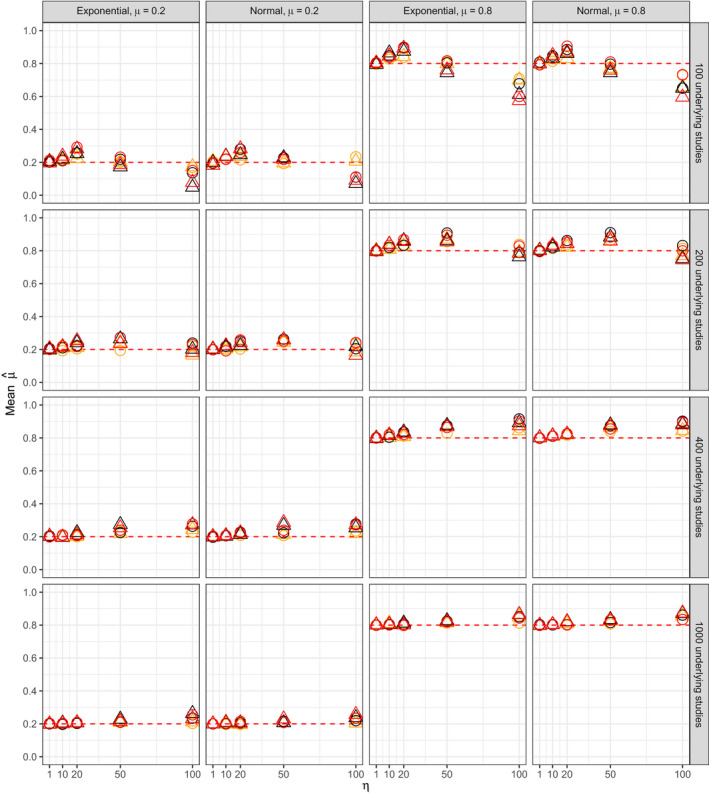 , μ; , not selected on standard error; , selected for small standard error; , common effect; , robust clustered; , robust independent
References
-
- Anderson, C. A. , Shibuya, A. , Ihori, N. , Swing, E. L. , Bushman, B. J. , Sakamoto, A. , Rothstein, H. R. and Saleem, M. (2010) Violent video game effects on aggression, empathy, and prosocial behavior in Eastern and Western countries: a meta‐analytic review. Psychol. Bull., 136, 151–173. - PubMed
-
- Andrews, I. and Kasy, M. (2019) Identification of and correction for publication bias. Am. Econ. Rev., 109, 2766–2794.
-
- Boehm, J. K. , Chen, Y. , Koga, H. , Mathur, M. B. , Vie, L. L. and Kubzansky, L. D. (2018) Is optimism associated with healthier cardiovascular‐related behavior?: Meta‐analyses of 3 health behaviors. Circuln Res., 122, 1119–1134. - PubMed
-
- Bom, P. R. and Rachinger, H. (2019) A kinked meta‐regression model for publication bias correction. Res. Synth. Meth., 10, 497–514. - PubMed
Grants and funding
LinkOut - more resources
Full Text Sources