. 2020 Oct;51(10):1951-1959.
doi: 10.1002/jrs.5816. Epub 2020 Jan 3.

Broadband stimulated Raman scattering microscopy with wavelength-scanning detection

Affiliations

Broadband stimulated Raman scattering microscopy with wavelength-scanning detection

Alejandro De la Cadena et al. J Raman Spectrosc. 2020 Oct.

Abstract

We introduce a high-sensitivity broadband stimulated Raman scattering (SRS) setup featuring wide spectral coverage (up to 500 cm-1) and high-frequency resolution (≈20 cm-1). The system combines a narrowband Stokes pulse, obtained by spectral filtering an Yb laser, with a broadband pump pulse generated by a home-built optical parametric oscillator. A single-channel lock-in amplifier connected to a single-pixel photodiode measures the stimulated Raman loss signal, whose spectrum is scanned rapidly using a galvanometric mirror after the sample. We use the in-line balanced detection approach to suppress laser fluctuations and achieve close to shot-noise-limited sensitivity. The setup is capable of measuring accurately the SRS spectra of several solvents and of obtaining hyperspectral data cubes consisting in the broadband SRS microscopy images of polymer beads test samples as well as of the distribution of different biological substances within plant cell walls.

Keywords: coherent Raman spectroscopy; hyperspectral microscopy; nonlinear optical microscopy; optical parametric oscillators; stimulated Raman scattering.


Figures

Figure 1
Figure 1
(a) Spectra of the OPO at different cavity lengths, covering the 715–870‐nm wavelength range, and of the Yb:fiber laser frequency filtered by an etalon. (b) Relative intensity noise of the Yb:fiber laser and the OPO with BBO and with LBO crystal. The dashed line indicates the shot‐noise limit of the OPO based on the LBO crystal. BBO, β‐barium‐borate; LBO, lithium triborate; OPO, optical parametric oscillator
Figure 2
Figure 2
Scheme of the broadband stimulated Raman scattering system. L1 and L2 are spherical lenses both with a focal length of 200 mm. λ/2, half‐wave plate; AOM, acousto‐optic modulator; GS, galvanometric scanning mirror; OPO, optical parametric oscillator; PBS, polarizing beam splitter; SPF, short‐pass filter; YVO4, birefringent plate to create the signal and reference pulses
Figure 3
Figure 3
Stimulated Raman loss spectra of reference solvents. The scanning frequency of the galvanometer was fixed at 500 Hz and the integration time of the lock‐in amplifier set to τ = 1.8 μs
Figure 4
Figure 4
Assessment of the influence of in‐line balanced detection (IBD) on image quality. Panel (a) shows an image of a cluster of polystyrene and poly‐methyl methacrylate beads acquired with IBD at a modulation frequency of 1 MHz, whereas panel (b) shows the same cluster acquired without the IBD. Panels (c) and (d) show images acquired at a 7‐MHz modulation frequency with and without IBD, respectively. Image parameters: pixel dwell time: 10 ms, resolution: 110 × 110 pixels, spectral points acquired per pixel: 50, lo τ = 1.8 μs, total image acquisition time: 120 s
Figure 5
Figure 5
Broadband stimulated Raman scattering imaging of micrometric polystyrene and poly‐methyl methacrylate beads. Panel (a) shows as solid lines and symbols the stimulated Raman loss spectra measured from the beads at the points labeled as P1 and P2 in Panel (e) and as thin dashed lines the two main components of multivariate curve resolution. The gray bars indicate the spectral points used to form the contrast in panels (b–d). Panels (b), (c), and (d) show stimulated Raman loss images at 2,950, 3,025 and 3,055 cm−1, respectively. Panel (e) shows the overlay image of poly‐methyl methacrylate (green) and polystyrene (red) concentrations obtained using multivariate curve resolution. Image parameters: pixel dwell time: 10 ms, resolution: 110 × 110 pixels, spectral points acquired per pixel: 50, lock‐in amplifier time constant 1.8 μs, total image acquisition time: 120 s
Figure 6
Figure 6
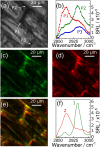
Chemical imaging of a leaf of an Elodea Canadensis. (a) Linear transmission image, (b) stimulated Raman loss spectra at the points labeled as P1, P2, and P3 and indicated with the arrows in panel (a); panels (c) and (d) are SRL images at 2,890 and 2,947 cm−1, respectively; (e) the overlay image of the concentration distributions of the two main components of MCR; (f) corresponding spectra. Image parameters: pixel dwell time: 10 ms, resolution: 110 × 110 pixels, spectral points acquired per pixel: 50, lock‐in amplifier τ = 50 μs, total image acquisition time: 120 s

References

    1. Cheng J.‐X., Xie X. S., Coherent Raman scattering microscopy, CRC press; 2012.
    1. Chung C.‐Y., Potma E. O., Annu. Rev. Phys. Chem. 2013, 64, 77. - PMC - PubMed
    1. Rigneault H., Berto P., APL Photonics 2018, 3, 091101.
    1. Zumbusch A., Holtom G. R., Xie X. S., Phys. Rev. Lett. 1999, 82, 4142.
    1. Pezacki J. P., Blake J. A., Danielson D. C., Kennedy D. C., Lyn R. K., Singaravelu R., Nat. Chem. Biol. 2011, 7, 137. - PMC - PubMed

LinkOut - more resources