

Renal ultrasonographic shear-wave elastography and urinary procollagen type III amino-terminal propeptide in chronic kidney disease dogs
- PMID: 33132611
- PMCID: PMC7566241
- DOI: 10.14202/vetworld.2020.1955-1965
Renal ultrasonographic shear-wave elastography and urinary procollagen type III amino-terminal propeptide in chronic kidney disease dogs
Abstract
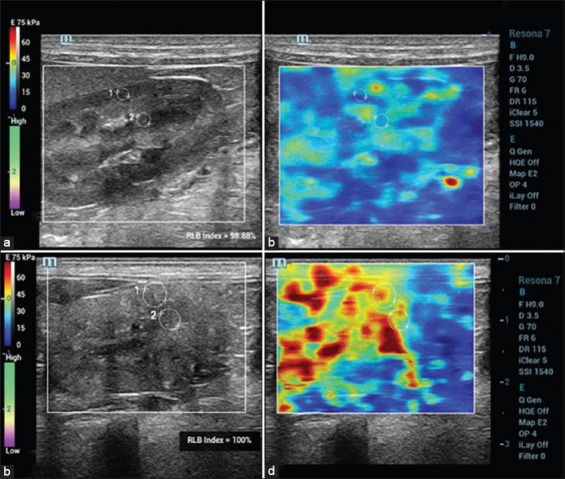
Background and aim: Renal fibrosis is a well-established pathological alteration associated with chronic kidney disease (CKD) in several species and progresses as CKD advances. Although a renal biopsy is the gold standard for determining renal fibrosis, it is an invasive, impractical method for clinical practice. In humans, ultrasonographic shear-wave elastography (SWE), a novel advanced diagnostic imaging tool, can evaluate renal parenchyma stiffness, and urinary procollagen type III amino-terminal propeptide (uPIIINP), a promising renal fibrosis biomarker in humans, has increasingly been use applied to reduce the biopsies. This study compares renal tissue elasticity observed through SWE Young's modulus (E) values between healthy dogs (HD) and those with CKD.
Materials and methods: The E value acquired by SWE, uPIIINP levels, and renal function were evaluated in 15 CKD dogs and 15 HD.
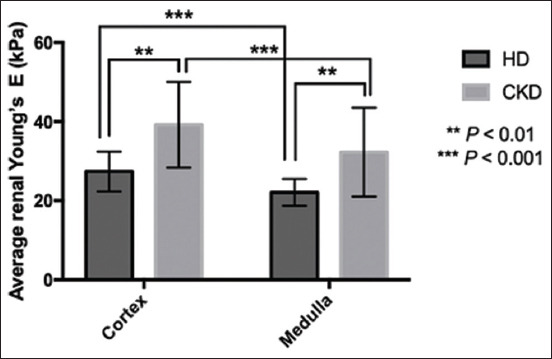
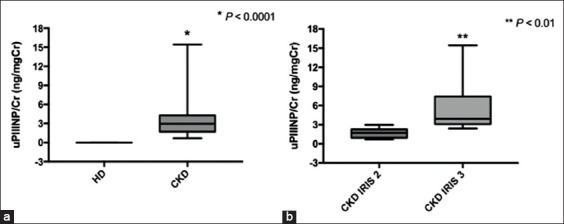
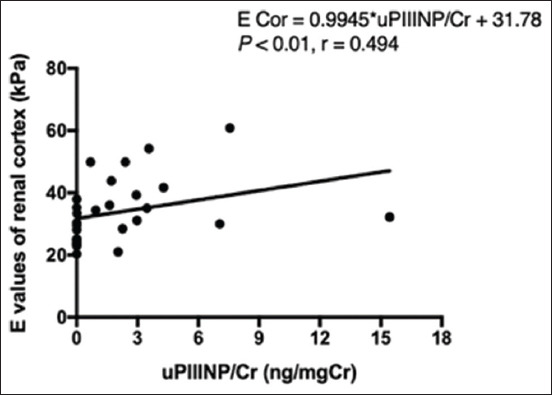
Results: The renal cortical E values were significantly higher than the renal medullary E values in both groups (p<0.001). Renal cortical and medullary E values in CKD dogs were significantly higher than in HD (p<0.01). Cortical E values had greater significant correlations with renal functional parameters than the medullary E values and had a significant positive correlation with concentrations of plasma creatinine (Cr) (p<0.001); blood urea nitrogen (p<0.01); urine protein Cr ratio (p<0.01); and fractional excretions of sodium (p<0.05), potassium (p<0.05), chloride (p<0.05), and magnesium (p<0.001) while they had a negative correlation with urine specific gravity (p<0.05) and urine osmolality to plasma osmolality ratio (p<0.05). The uPIIINP to Cr (uPIIINP/Cr) ratios of CKD dogs were higher than those of HD (p<0.001). Moreover, the uPIIINP/Cr levels presented significant correlations with the renal cortical E values (p<0.01) and also the renal functional parameters.
Conclusion: SWE offers a complementary, non-invasive diagnostic imaging tool for evaluating renal tissue stiffness in CKD dogs with renal function deterioration. In addition, uPIIINP levels are associated with renal function and structural changes in dogs. Therefore, the uPIIINP level might be a non-invasive, complementary, and promising biomarker for evaluating renal fibrosis in canine CKD.
Keywords: chronic kidney disease; dog; renal fibrosis; shear-wave elastography; urinary procollagen type III amino-terminal propeptide.
Copyright: © Thanaboonnipat, et al.
Figures
Similar articles
-
Renal shear wave elastography and urinary procollagen type III amino-terminal propeptide (uPIIINP) in feline chronic kidney disease.BMC Vet Res. 2019 Feb 11;15(1):54. doi: 10.1186/s12917-019-1801-4. BMC Vet Res. 2019. PMID: 30744640 Free PMC article.
-
Urinary procollagen III aminoterminal propeptide (PIIINP): a fibrotest for the nephrologist.Clin J Am Soc Nephrol. 2010 Feb;5(2):205-10. doi: 10.2215/CJN.06610909. Epub 2010 Jan 14. Clin J Am Soc Nephrol. 2010. PMID: 20089486 Free PMC article.
-
Renal ultrasonographic strain elastography and symmetric dimethylarginine (SDMA) in canine and feline chronic kidney disease.J Vet Med Sci. 2020 Aug 19;82(8):1104-1112. doi: 10.1292/jvms.19-0496. Epub 2020 Jun 18. J Vet Med Sci. 2020. PMID: 32554935 Free PMC article.
-
[SWE elastography in assessment of liver fibrosis].Postepy Hig Med Dosw (Online). 2015 Feb 15;69:221-6. doi: 10.5604/17322693.1140338. Postepy Hig Med Dosw (Online). 2015. PMID: 25720608 Review. Polish.
-
Challenges and Considerations When Using Shear Wave Elastography to Evaluate the Transplanted Kidney, With Pictorial Review.J Ultrasound Med. 2017 Sep;36(9):1771-1782. doi: 10.1002/jum.14217. Epub 2017 May 4. J Ultrasound Med. 2017. PMID: 28471017 Review.
Cited by
-
Shear wave elastography for assessing kidneys in pediatric patients with primary nephrotic syndrome.Insights Imaging. 2025 Aug 23;16(1):183. doi: 10.1186/s13244-025-02070-x. Insights Imaging. 2025. PMID: 40848202
-
Diagnostic assessment of two-dimensional shear wave elastography in relation to dimethyl arginine levels in dogs with chronic kidney disease.J Vet Sci. 2023 Nov;24(6):e75. doi: 10.4142/jvs.23101. Epub 2023 Sep 26. J Vet Sci. 2023. PMID: 37904637 Free PMC article.
-
Post-Chemotherapy Canine Lymphomatous Lymph Node Observations on B-Mode and Strain Elastographic Ultrasound.Vet Sci. 2024 Aug 4;11(8):352. doi: 10.3390/vetsci11080352. Vet Sci. 2024. PMID: 39195806 Free PMC article.
-
Diagnostic utility of two-dimensional shear wave elastography in nephropathic dogs and its correlation with renal contrast-enhanced ultrasound in course of acute kidney injury.J Vet Med Sci. 2023 Nov 18;85(11):1216-1225. doi: 10.1292/jvms.23-0065. Epub 2023 Oct 5. J Vet Med Sci. 2023. PMID: 37793837 Free PMC article.
-
Effectiveness of 2-dimensional shear wave elastography for noninvasive and reliable estimation of right atrial pressure in dogs with induced volume overload.J Vet Intern Med. 2023 May-Jun;37(3):866-874. doi: 10.1111/jvim.16705. Epub 2023 Apr 10. J Vet Intern Med. 2023. PMID: 37036333 Free PMC article.
References
-
- Polzin D.J. Chronic kidney disease in small animals. Vet. Clin. Small Anim. Pract. 2014;41(1):15–30. - PubMed
-
- Guidi G, Rossini C, Cinelli C, Meucci V, Lippi I. In:Veterinary Science, Current Aspects in Biology, Animal Pathology, Clinic and Food Hygiene. Verlag Berlin Heidelberg: Springer; 2012. Canine chronic kidney disease:Retrospective study of a 10-year period of clinical activity; pp. 115–118.
-
- Foster J.D. Canine Chronic Kidney Disease. Current Diagnostics and Goals for Long-Term Management Today's Veterinary Practice. 2013:21–26.
-
- O'Neill D.G, Elliott J, Church D.B, McGreevy P.D, Thomson P.C, Brodbelt D.C. Chronic kidney disease in dogs in UK veterinary practices:Prevalence, risk factors, and survival. J. Vet. Intern. Med. 2013;27(4):814–821. - PubMed
-
- Brown S.A. Management of chronic kidney disease. In: Elliot J, editor. BSAVA Manual of Canine and Feline Nephrology and Urology. 2nd ed. Gloucester: British Small Animal Veterinary Association; 2007. pp. 223–230.
LinkOut - more resources
Full Text Sources