

Effects of respiratory disease on Kele piglets lung microbiome, assessed through 16S rRNA sequencing
- PMID: 33132613
- PMCID: PMC7566272
- DOI: 10.14202/vetworld.2020.1970-1981
Effects of respiratory disease on Kele piglets lung microbiome, assessed through 16S rRNA sequencing
Abstract
Background and aim: Due to the incomplete development of the immune system in immature piglets, the respiratory tract is susceptible to invasion by numerous pathogens that cause a range of potential respiratory diseases. However, few studies have reported the changes in pig lung microorganisms during respiratory infection. Therefore, we aimed to explore the differences in lung environmental microorganisms between healthy piglets and piglets with respiratory diseases.
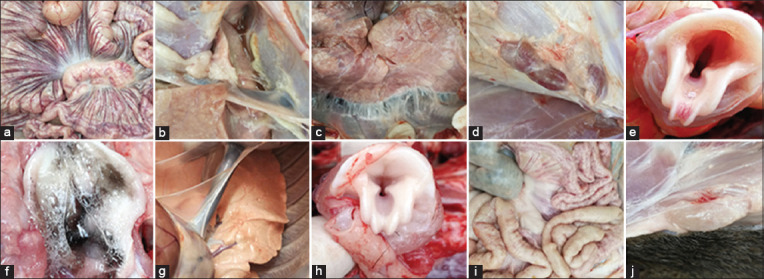
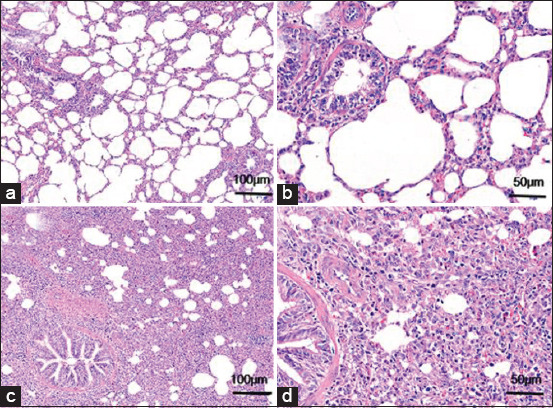
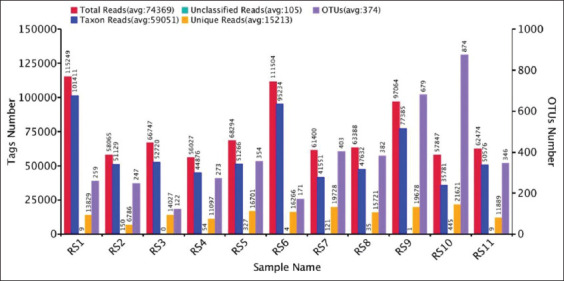
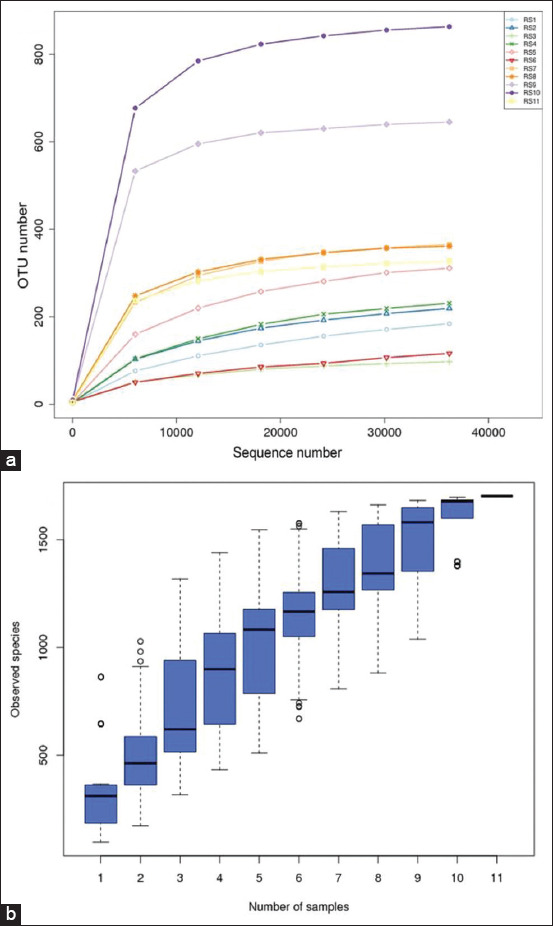
Materials and methods: Histopathological changes in lung sections were observed in both diseased and healthy pigs. Changes in the composition and abundance of microbiomes in alveolar lavage fluid from eleven 4-week-old Chinese Kele piglets (three clinically healthy and eight diseased) were studied by IonS5™ XL sequencing of the bacterial16S rRNA genes.
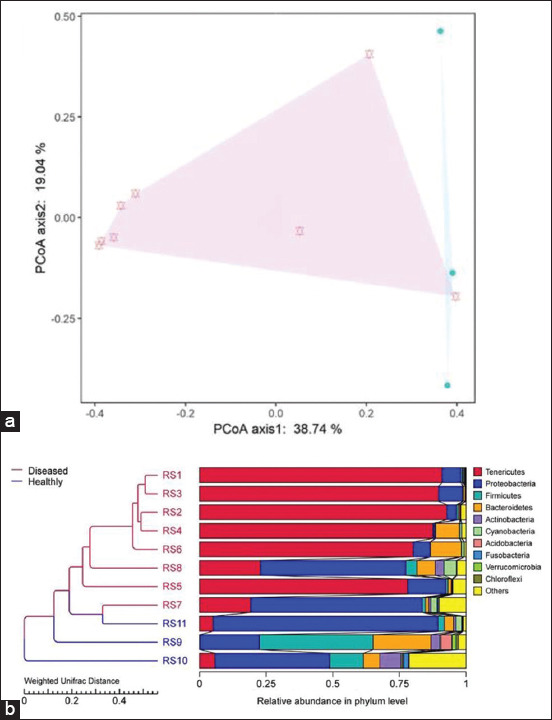
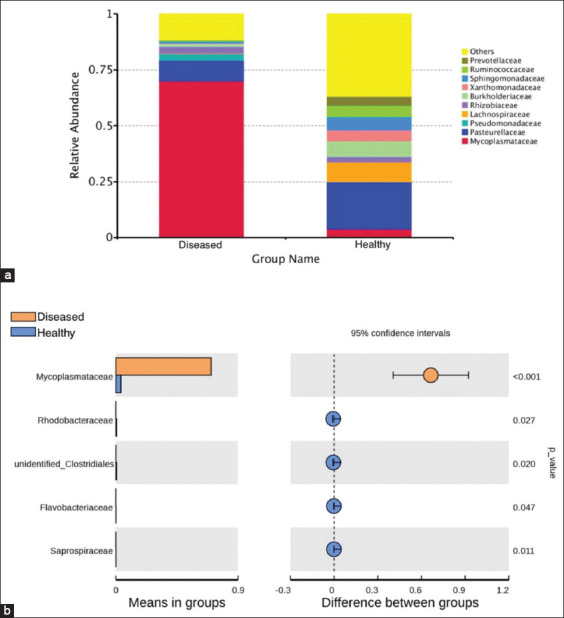
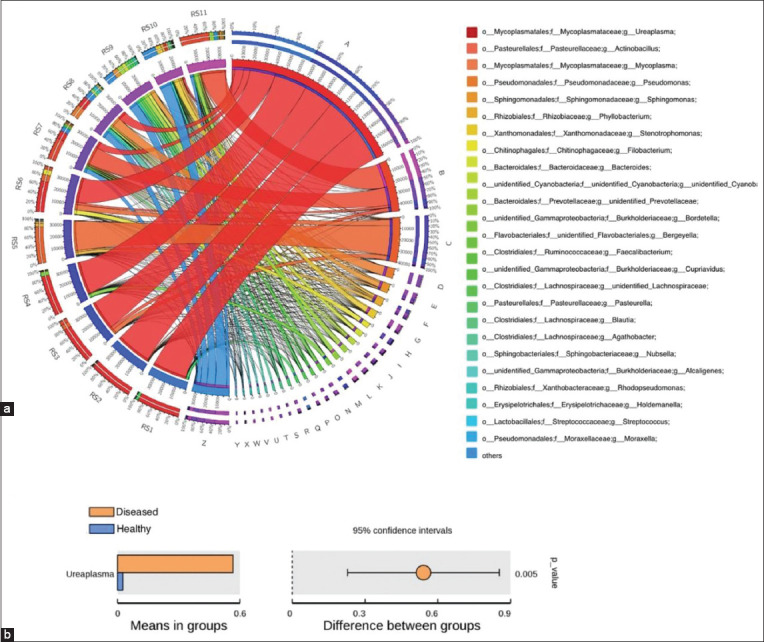
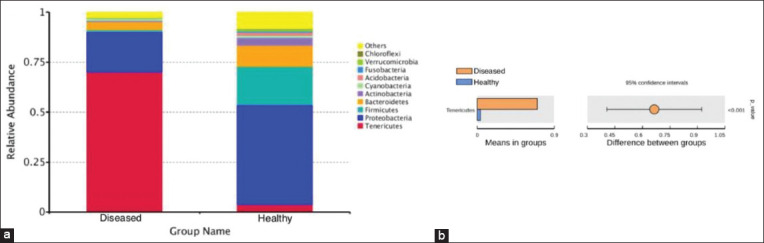
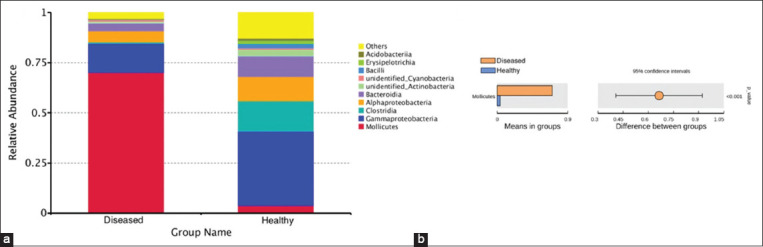
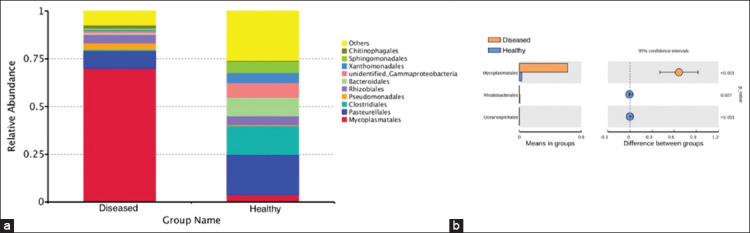
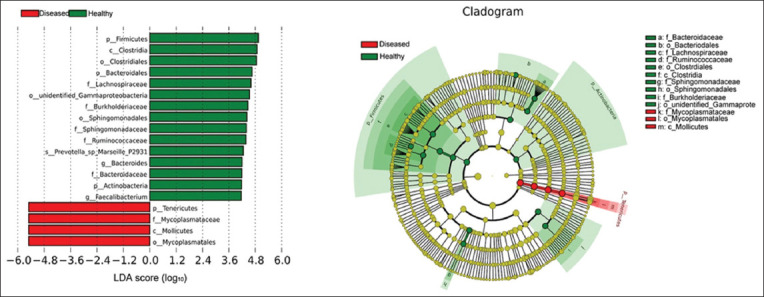
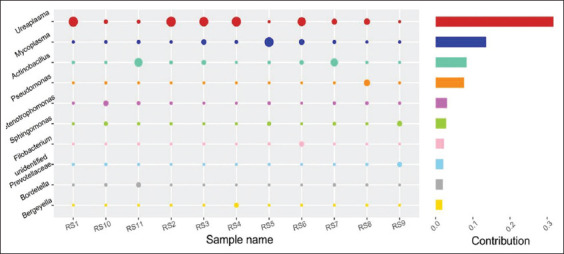
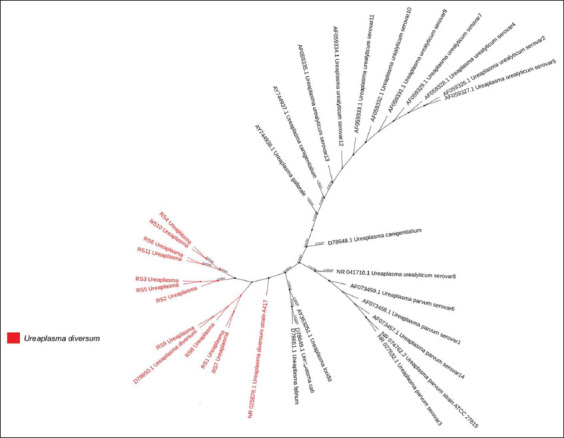
Results: Histopathological sections showed that diseased pigs displayed more lung lesions than healthy pigs. Diseased piglets harbored lower bacterial operational taxonomic units, α-diversity, and bacterial community complexity in comparison to healthy piglets. Taxonomic composition analysis showed that in the diseased piglets, the majority of flora was composed of Ureaplasma, Mycoplasma, and Actinobacillus; while Actinobacillus, Sphingomonas, and Stenotrophomonas were dominant in the control group. The abundance of Ureaplasma was significantly higher in ill piglets (p<0.05), and the phylogenetic tree indicated that Ureaplasma was clustered in Ureaplasma diversum, a conditional pathogen that has the potential to affect the swine respiratory system.
Conclusion: The results of this study show that the microbial species and structure of piglets' lungs were changed during respiratory tract infection. The finding of Ureaplasma suggested that besides known pathogens such as Mycoplasma and Actinobacillus, unknown pathogens can exist in the respiratory system of diseased pigs and provide a potential basis for clinical treatment.
Keywords: 16S rRNA sequencing; Kele piglets; Ureaplasma; Ureaplasma diversum; microbial diversity; respiratory diseases.
Copyright: © Zhang, et al.
Figures
Similar articles
-
Comparative analysis of the pulmonary microbiome in healthy and diseased pigs.Mol Genet Genomics. 2021 Jan;296(1):21-31. doi: 10.1007/s00438-020-01722-5. Epub 2020 Sep 17. Mol Genet Genomics. 2021. PMID: 32944788
-
Isolation of mycoplasma species from the lower respiratory tract of healthy cattle and cattle with respiratory disease in Belgium.Vet Rec. 2002 Oct 19;151(16):472-6. doi: 10.1136/vr.151.16.472. Vet Rec. 2002. PMID: 12418530
-
Comparison of Oropharyngeal Microbiota in Healthy Piglets and Piglets With Respiratory Disease.Front Microbiol. 2018 Dec 21;9:3218. doi: 10.3389/fmicb.2018.03218. eCollection 2018. Front Microbiol. 2018. PMID: 30627125 Free PMC article.
-
Roles of Probiotic Lactobacilli Inclusion in Helping Piglets Establish Healthy Intestinal Inter-environment for Pathogen Defense.Probiotics Antimicrob Proteins. 2018 Jun;10(2):243-250. doi: 10.1007/s12602-017-9273-y. Probiotics Antimicrob Proteins. 2018. PMID: 28361445 Review.
-
A Review of Ureaplasma diversum: A Representative of the Mollicute Class Associated With Reproductive and Respiratory Disorders in Cattle.Front Vet Sci. 2021 Feb 18;8:572171. doi: 10.3389/fvets.2021.572171. eCollection 2021. Front Vet Sci. 2021. PMID: 33681318 Free PMC article. Review.
Cited by
-
Probiotics in milk replacer affect the microbiome of the lung in neonatal dairy calves.Front Microbiol. 2024 Jan 5;14:1298570. doi: 10.3389/fmicb.2023.1298570. eCollection 2023. Front Microbiol. 2024. PMID: 38249465 Free PMC article.
References
-
- Lyte J.M, Lyte M. Review:Microbial endocrinology:Intersection of microbiology and neurobiology matters to swine health from infection to behavior. Animal. 2019;13(11):2689–2698. - PubMed
-
- Davies R.L. Genetic diversity among Pasteurella multocida strains of avian, bovine, ovine and porcine origin from England and Wales by comparative sequence analysis of the 16S rRNA gene. Microbiology. 2004;150(12):4199–4210. - PubMed
-
- Asai T, Namimatsu T, Osumi T, Kojima A, Harada K, Aoki H, Sameshima T, Takahashi T. Molecular typing and antimicrobial resistance of Salmonella enterica subspecies enterica serovar Choleraesuis isolates from diseased pigs in Japan. Comp. Immunol. Microbiol. Infect. Dis. 2010;33(2):109–119. - PubMed
LinkOut - more resources
Full Text Sources