

Dynamic contrast-enhanced magnetic resonance imaging and diffusion-weighted imaging in the activity staging of terminal ileum Crohn's disease
- PMID: 33132655
- PMCID: PMC7584052
- DOI: 10.3748/wjg.v26.i39.6057
Dynamic contrast-enhanced magnetic resonance imaging and diffusion-weighted imaging in the activity staging of terminal ileum Crohn's disease
Abstract
Background: The activity staging of Crohn's disease (CD) in the terminal ileum is critical in developing an accurate clinical treatment plan. The activity of terminal ileum CD is associated with the microcirculation of involved bowel walls. Dynamic contrast-enhanced magnetic resonance imaging (DCE-MRI) and diffusion-weighted imaging (DWI) can reflect perfusion and permeability of bowel walls by providing microcirculation information. As such, we hypothesize that DCE-MRI and DWI parameters can assess terminal ileum CD, thereby providing an opportunity to stage CD activity.
Aim: To evaluate the value of DCE-MRI and DWI in assessing activity of terminal ileum CD.
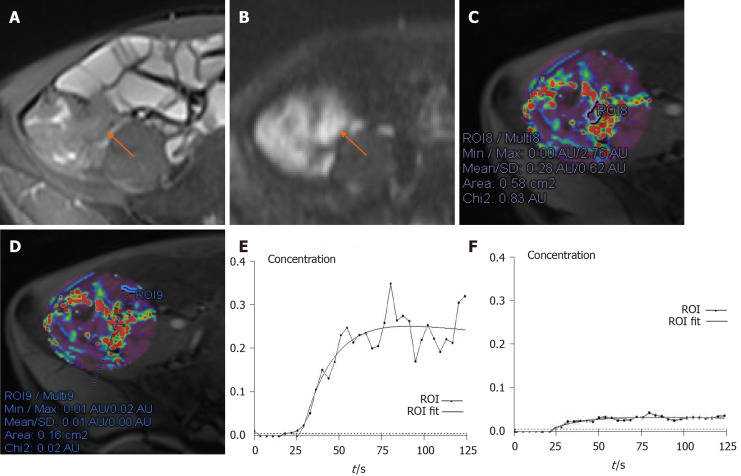
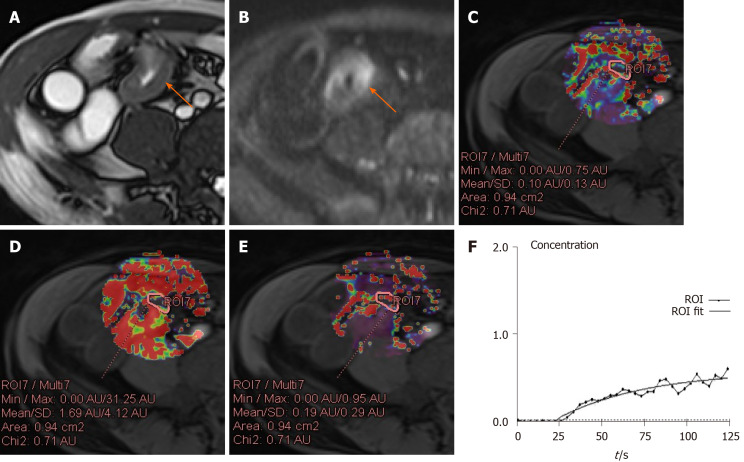
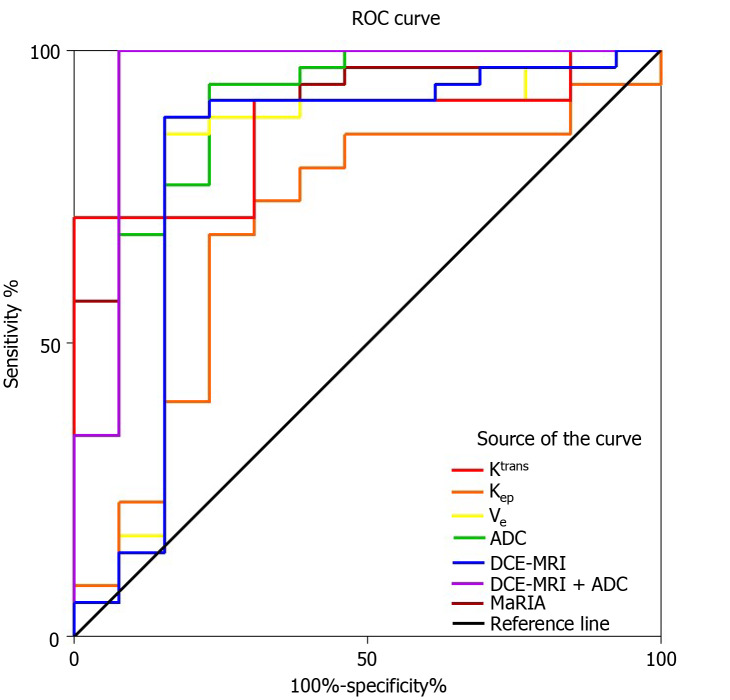
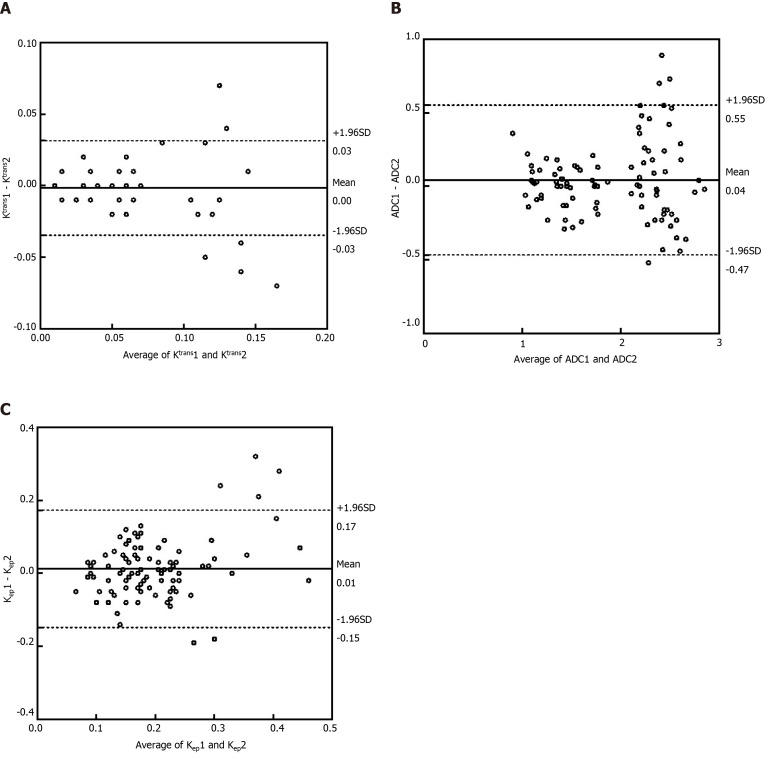
Methods: Forty-eight patients with CD who underwent DCE-MRI and DWI were enrolled. The patients' activity was graded as remission, mild and moderate-severe. The transfer constant (Ktrans), wash-out constant (Kep), and extravascular extracellular volume fraction (Ve) were calculated from DCE-MRI and the apparent diffusion coefficient (ADC) was obtained from DWI. Magnetic Resonance Index of Activity (MaRIA) was calculated from magnetic resonance enterography. Differences in these quantitative parameters were compared between normal ileal loop (NIL) and inflamed terminal ileum (ITI) and among different activity grades. The correlations between these parameters, MaRIA, the Crohn's Disease Activity Index (CDAI), and Crohn's Disease Endoscopic Index of Severity (CDEIS) were examined. Receiver operating characteristic curve analyses were used to determine the diagnostic performance of these parameters in differentiating between CD activity levels.
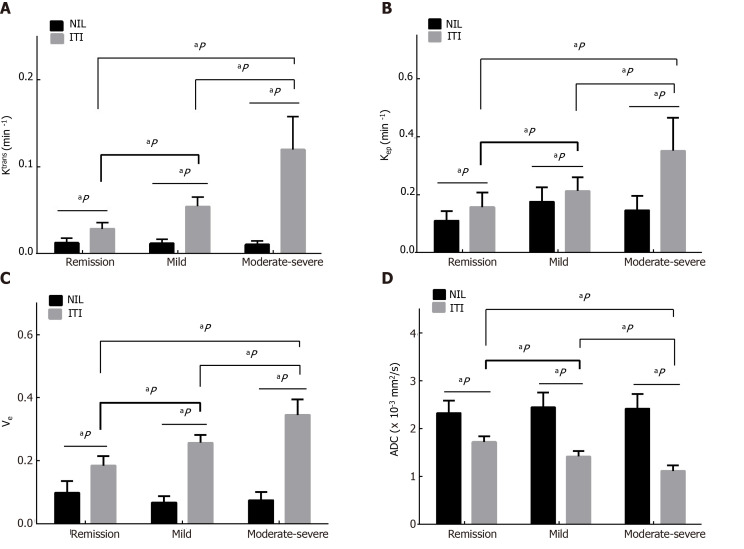
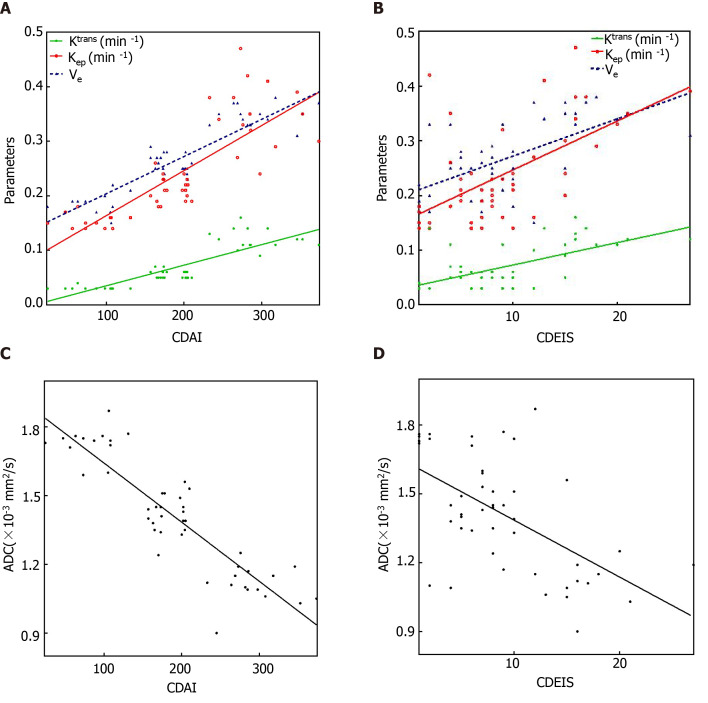
Results: Higher Ktrans (0.07 ± 0.04 vs 0.01 ± 0.01), Kep (0.24 ± 0.11 vs 0.15 ± 0.05) and Ve (0.27 ± 0.07 vs 0.08 ± 0.03), but lower ADC (1.41 ± 0.26 vs 2.41 ± 0.30) values were found in ITI than in NIL (all P < 0.001). The Ktrans, Kep, Ve and MaRIA increased with disease activity, whereas the ADC decreased (all P < 0.001). The Ktrans, Kep, Ve and MaRIA showed positive correlations with the CDAI (r = 0.866 for Ktrans, 0.870 for Kep, 0.858 for Ve, 0.890 for MaRIA, all P < 0.001) and CDEIS (r = 0.563 for Ktrans, 0.567 for Kep, 0.571 for Ve, 0.842 for MaRIA, all P < 0.001), while the ADC showed negative correlations with the CDAI (r = -0.857, P < 0.001) and CDEIS (r = -0.536, P < 0.001). The areas under the curve (AUC) for the Ktrans, Kep, Ve, ADC and MaRIA values ranged from 0.68 to 0.91 for differentiating inactive CD (CD remission) from active CD (mild to severe CD). The AUC when combining the Ktrans, Kep and Ve was 0.80, while combining DCE-MRI parameters and ADC values yielded the highest AUC of 0.95.
Conclusion: DCE-MRI and DWI parameters all serve as measures to stage CD activity. When they are combined, the assessment performance is improved and better than MaRIA.
Keywords: Crohn’s disease; Diffusion-weighted imaging; Ileum; Magnetic resonance imaging; Perfusion imaging.
©The Author(s) 2020. Published by Baishideng Publishing Group Inc. All rights reserved.
Conflict of interest statement
Conflict-of-interest statement: The authors declare that they have no conflict of interest.
Figures
Similar articles
-
Diffusion and perfusion MRI quantification in ileal Crohn's disease.Eur Radiol. 2019 Feb;29(2):993-1002. doi: 10.1007/s00330-018-5627-4. Epub 2018 Jul 17. Eur Radiol. 2019. PMID: 30019143
-
Multiparametric MRI for Staging of Bowel Inflammatory Activity in Crohn's Disease with MUSE-IVIM and DCE-MRI: A Preliminary Study.Acad Radiol. 2024 Mar;31(3):880-888. doi: 10.1016/j.acra.2023.08.028. Epub 2023 Sep 18. Acad Radiol. 2024. PMID: 37730492
-
Intravoxel incoherent motion diffusion-weighted imaging in quantitative evaluation of Ileal Crohn's disease - A comparison with dynamic contrast-enhanced magnetic resonance imaging and ileocolonoscopy.Magn Reson Imaging. 2023 Apr;97:82-90. doi: 10.1016/j.mri.2022.12.020. Epub 2023 Jan 3. Magn Reson Imaging. 2023. PMID: 36608907
-
Gastric cancer and image-derived quantitative parameters: Part 2-a critical review of DCE-MRI and 18F-FDG PET/CT findings.Eur Radiol. 2020 Jan;30(1):247-260. doi: 10.1007/s00330-019-06370-x. Epub 2019 Aug 7. Eur Radiol. 2020. PMID: 31392480 Free PMC article. Review.
-
Diagnosing osteomyelitis in diabetic foot by diffusion-weighted imaging and dynamic contrast material-enhanced magnetic resonance imaging: a systematic review and meta-analysis.Clin Radiol. 2024 Nov;79(11):805-817. doi: 10.1016/j.crad.2024.07.015. Epub 2024 Jul 26. Clin Radiol. 2024. PMID: 39168784
Cited by
-
Application of Dynamic Contrast-Enhanced MRI in the Diagnosis of Rheumatoid Arthritis.Contrast Media Mol Imaging. 2022 Jun 21;2022:3055465. doi: 10.1155/2022/3055465. eCollection 2022. Contrast Media Mol Imaging. 2022. Retraction in: Contrast Media Mol Imaging. 2023 Jul 19;2023:9782028. doi: 10.1155/2023/9782028. PMID: 35833077 Free PMC article. Retracted.
-
A British Society of Gastrointestinal and Abdominal Radiology multi-centre audit of imaging investigations in inflammatory bowel disease.Br J Radiol. 2025 May 1;98(1169):734-743. doi: 10.1093/bjr/tqaf050. Br J Radiol. 2025. PMID: 40065511 Free PMC article.
-
Apparent diffusion coefficient for assessing Crohn's disease activity: a meta-analysis.Eur Radiol. 2023 Mar;33(3):1677-1686. doi: 10.1007/s00330-022-09149-9. Epub 2022 Sep 28. Eur Radiol. 2023. PMID: 36169687 Free PMC article.
-
Gadoxetic acid-enhanced MRI with a focus on LI-RADS v2018 imaging features predicts the prognosis after radiofrequency ablation in small hepatocellular carcinoma.Front Oncol. 2023 Feb 2;13:975216. doi: 10.3389/fonc.2023.975216. eCollection 2023. Front Oncol. 2023. PMID: 36816925 Free PMC article.
-
Dynamic contrast-enhanced (DCE) imaging: state of the art and applications in whole-body imaging.Jpn J Radiol. 2022 Apr;40(4):341-366. doi: 10.1007/s11604-021-01223-4. Epub 2021 Dec 24. Jpn J Radiol. 2022. PMID: 34951000 Review.
References
-
- Peyrin-Biroulet L, Loftus EV Jr, Colombel JF, Sandborn WJ. The natural history of adult Crohn's disease in population-based cohorts. Am J Gastroenterol. 2010;105:289–297. - PubMed
-
- Silverberg MS, Satsangi J, Ahmad T, Arnott ID, Bernstein CN, Brant SR, Caprilli R, Colombel JF, Gasche C, Geboes K, Jewell DP, Karban A, Loftus EV Jr, Peña AS, Riddell RH, Sachar DB, Schreiber S, Steinhart AH, Targan SR, Vermeire S, Warren BF. Toward an integrated clinical, molecular and serological classification of inflammatory bowel disease: report of a Working Party of the 2005 Montreal World Congress of Gastroenterology. Can J Gastroenterol. 2005;19 Suppl A:5A–36A. - PubMed
-
- Magro F, Portela F, Lago P, Ramos de Deus J, Vieira A, Peixe P, Cremers I, Cotter J, Cravo M, Tavares L, Reis J, Gonçalves R, Lopes H, Caldeira P, Ministro P, Carvalho L, Azevedo L, da Costa-Pereira A GEDII. Crohn's disease in a southern European country: Montreal classification and clinical activity. Inflamm Bowel Dis. 2009;15:1343–1350. - PubMed
-
- Hart L, Bessissow T. Endoscopic scoring systems for the evaluation and monitoring of disease activity in Crohn's disease. Best Pract Res Clin Gastroenterol. 2019;38-39:101616. - PubMed
MeSH terms
Substances
LinkOut - more resources
Full Text Sources
Medical
Research Materials
