

Contraction Phase and Force Differentially Change Motor Evoked Potential Recruitment Slope and Interhemispheric Inhibition in Young Versus Old
- PMID: 33132888
- PMCID: PMC7573560
- DOI: 10.3389/fnhum.2020.581008
Contraction Phase and Force Differentially Change Motor Evoked Potential Recruitment Slope and Interhemispheric Inhibition in Young Versus Old
Abstract
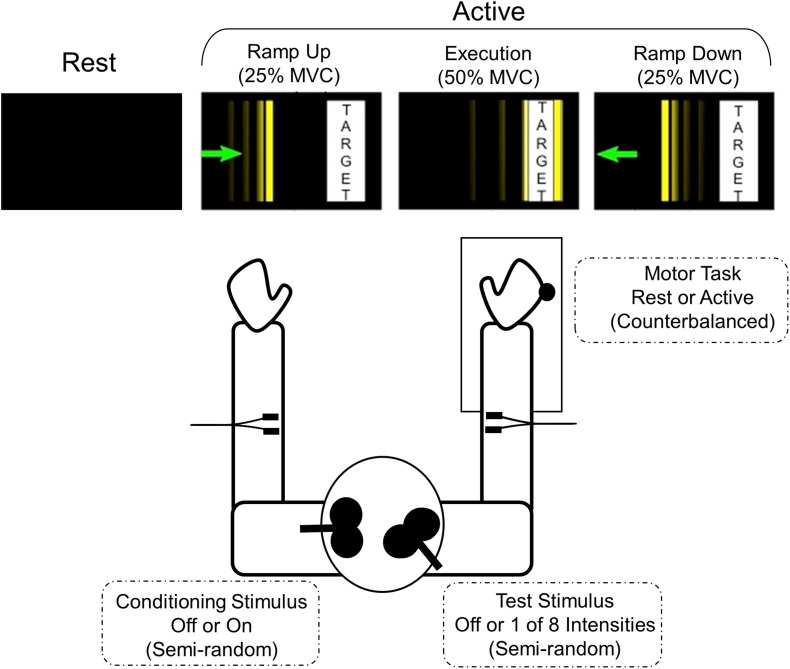
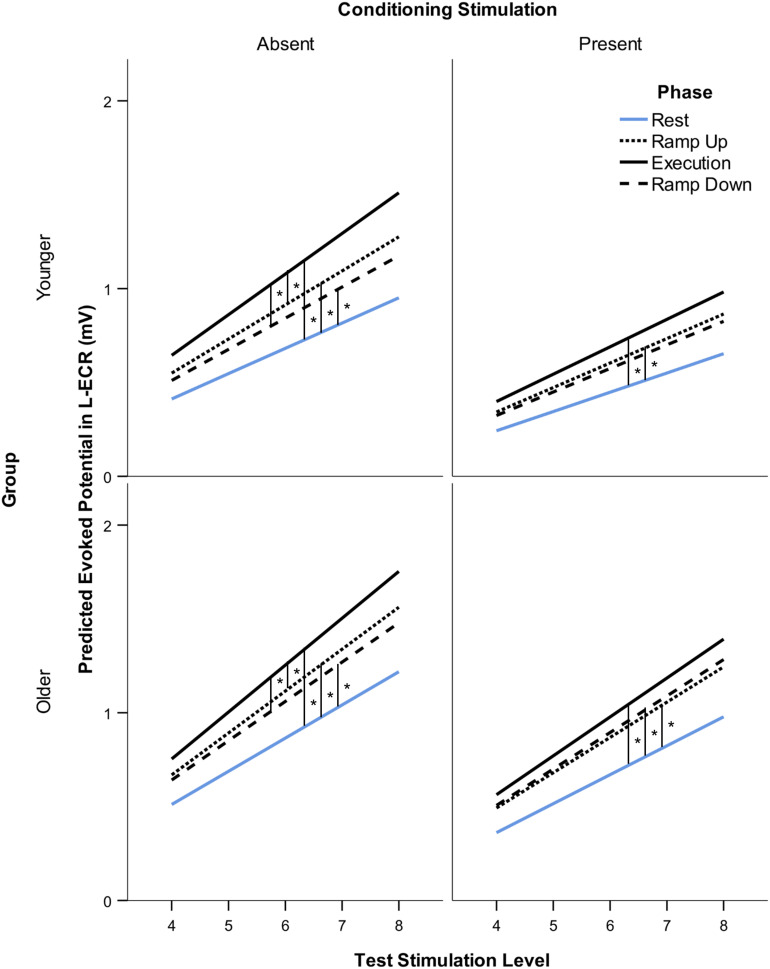
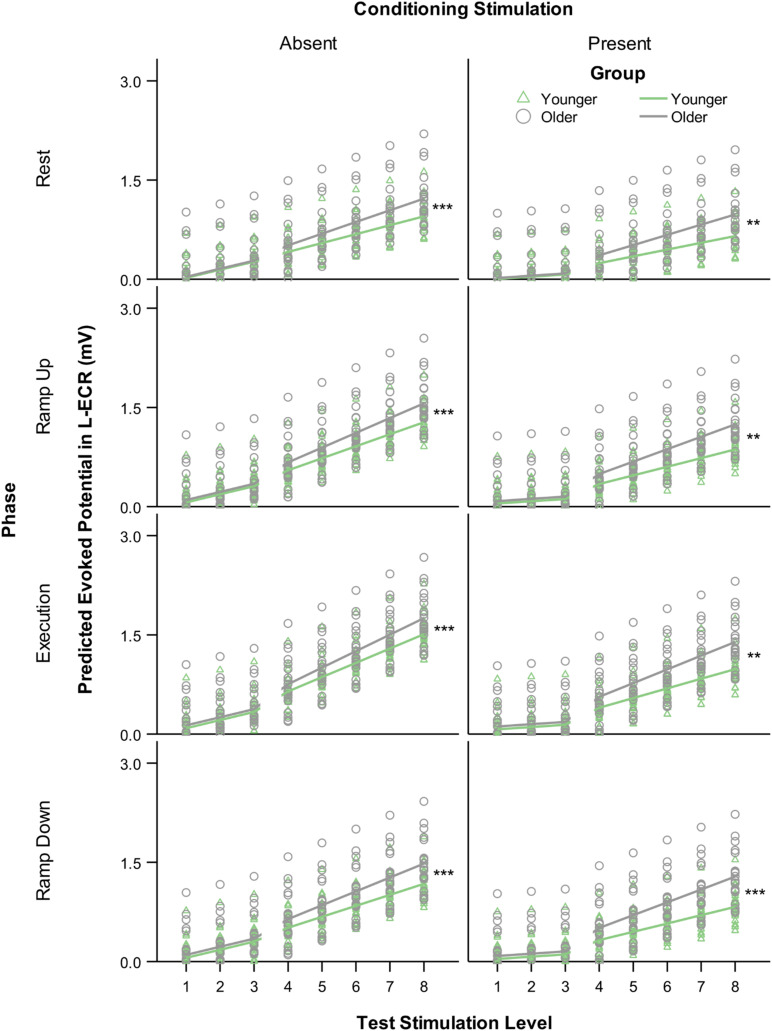
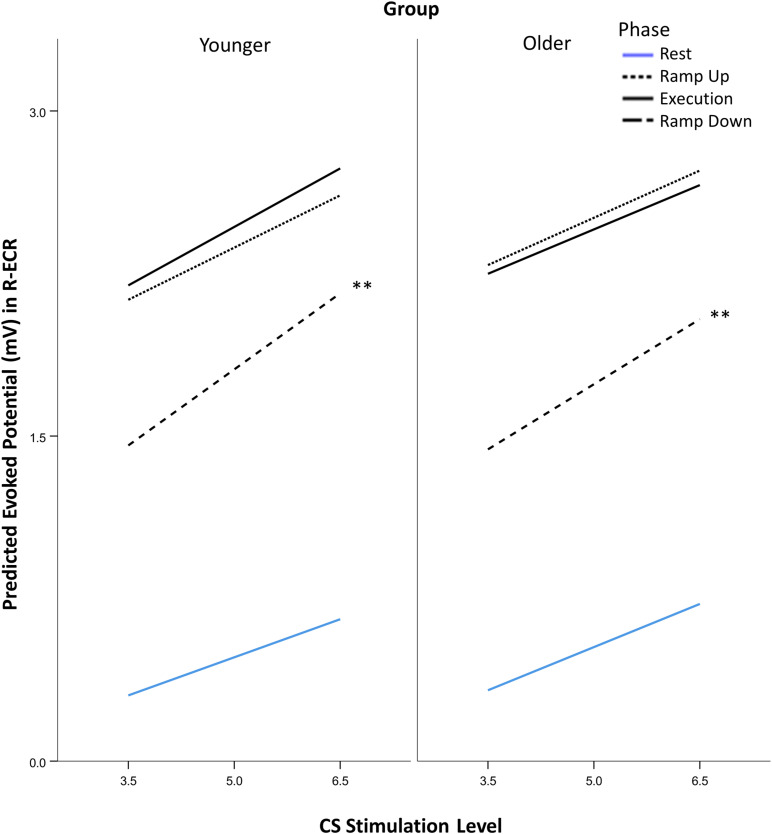
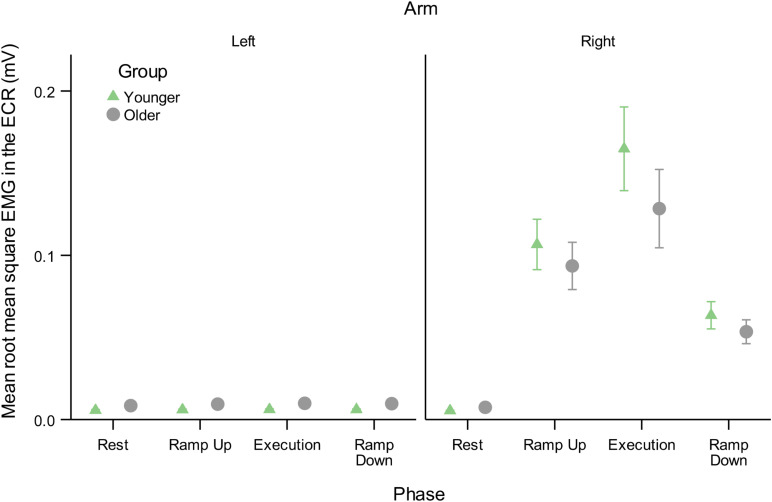
Interhemispheric interactions are important for arm coordination and hemispheric specialization. Unilateral voluntary static contraction is known to increase bilateral corticospinal motor evoked potential (MEP) amplitude. It is unknown how increasing and decreasing contraction affect the opposite limb. Since dynamic muscle contraction is more ecologically relevant to daily activities, we studied MEP recruitment using a novel method and short interval interhemispheric inhibition (IHI) from active to resting hemisphere at 4 phases of contralateral ECR contraction: Rest, Ramp Up [increasing at 25% of maximum voluntary contraction (MVC)], Execution (tonic at 50% MVC), and Ramp Down (relaxation at 25% MVC) in 42 healthy adults. We analyzed the linear portion of resting extensor carpi radialis (ECR) MEP recruitment by stimulating at multiple intensities and comparing slopes, expressed as mV per TMS stimulation level, via linear mixed modeling. In younger participants (age ≤ 30), resting ECR MEP recruitment slopes were significantly and equally larger both at Ramp Up (slope increase = 0.047, p < 0.001) and Ramp Down (slope increase = 0.031, p < 0.001) compared to rest, despite opposite directions of force change. In contrast, Active ECR MEP recruitment slopes were larger in Ramp Down than all other phases (Rest:0.184, p < 0.001; Ramp Up:0.128, p = 0.001; Execution: p = 0.003). Older (age ≥ 60) participants' resting MEP recruitment slope was higher than younger participants across all phases. IHI did not reduce MEP recruitment slope equally in old compared to young. In conclusion, our data indicate that MEP recruitment slope in the resting limb is affected by the homologous active limb contraction force, irrespective of the direction of force change. The active arm MEP recruitment slope, in contrast, remains relatively unaffected. Older participants had steeper MEP recruitment slopes and less interhemispheric inhibition compared to younger participants.
Keywords: aging; cortical dynamics; disinhibition; interhemispheric inhibition (IHI); motor evoked potential (MEP) recruitment slope.
Copyright © 2020 Ermer, Harcum, Lush, Magder, Whitall, Wittenberg and Dimyan.
Figures

Similar articles
-
Unimanual muscle activation increases interhemispheric inhibition from the active to the resting hemisphere.Neurosci Lett. 2008 Nov 21;445(3):209-13. doi: 10.1016/j.neulet.2008.09.013. Epub 2008 Sep 11. Neurosci Lett. 2008. PMID: 18793696
-
Corticomotor excitability changes seen in the resting forearm during contralateral rhythmical movement and force manipulations: a TMS study.Behav Brain Res. 2013 Nov 15;257:265-74. doi: 10.1016/j.bbr.2013.09.031. Epub 2013 Sep 23. Behav Brain Res. 2013. PMID: 24070855
-
Mechanomyographic response to transcranial magnetic stimulation from biceps brachii and during transcutaneous electrical nerve stimulation on extensor carpi radialis.J Neurosci Methods. 2005 Dec 15;149(2):164-71. doi: 10.1016/j.jneumeth.2005.05.013. Epub 2005 Jul 18. J Neurosci Methods. 2005. PMID: 16026847
-
The effect of motor overflow on bimanual asymmetric force coordination.Exp Brain Res. 2017 Apr;235(4):1097-1105. doi: 10.1007/s00221-016-4867-2. Epub 2017 Jan 16. Exp Brain Res. 2017. PMID: 28091708 Free PMC article.
-
Age-related differences in corticospinal excitability and inhibition during coordination of upper and lower limbs.Neurobiol Aging. 2012 Jul;33(7):1484.e1-14. doi: 10.1016/j.neurobiolaging.2011.12.019. Epub 2012 Jan 17. Neurobiol Aging. 2012. PMID: 22257984
Cited by
-
Impact of interhemispheric inhibition on bimanual movement control in young and old.Exp Brain Res. 2022 Feb;240(2):687-701. doi: 10.1007/s00221-021-06258-7. Epub 2022 Jan 12. Exp Brain Res. 2022. PMID: 35020040 Free PMC article.
References
Grants and funding
LinkOut - more resources
Full Text Sources