. 2020 Oct 8:11:528267.
doi: 10.3389/fphar.2020.528267. eCollection 2020.

PPARα Ameliorates Doxorubicin-Induced Cardiotoxicity by Reducing Mitochondria-Dependent Apoptosis via Regulating MEOX1

Affiliations

PPARα Ameliorates Doxorubicin-Induced Cardiotoxicity by Reducing Mitochondria-Dependent Apoptosis via Regulating MEOX1

Wei Wang et al. Front Pharmacol. .

Abstract

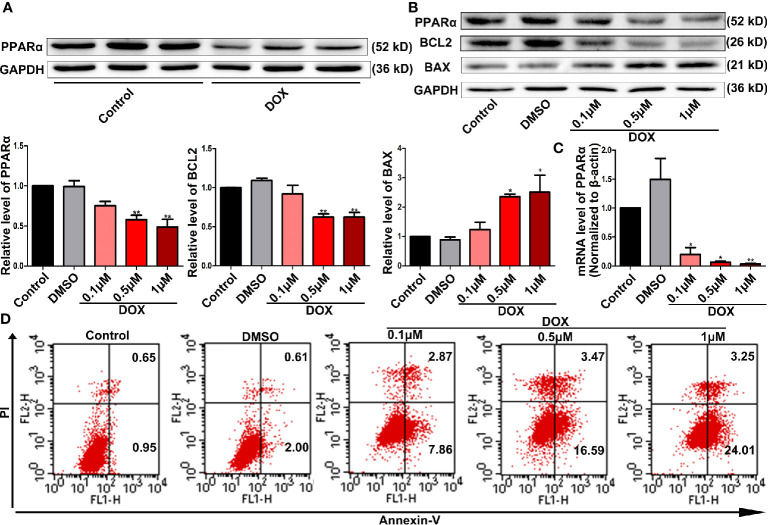
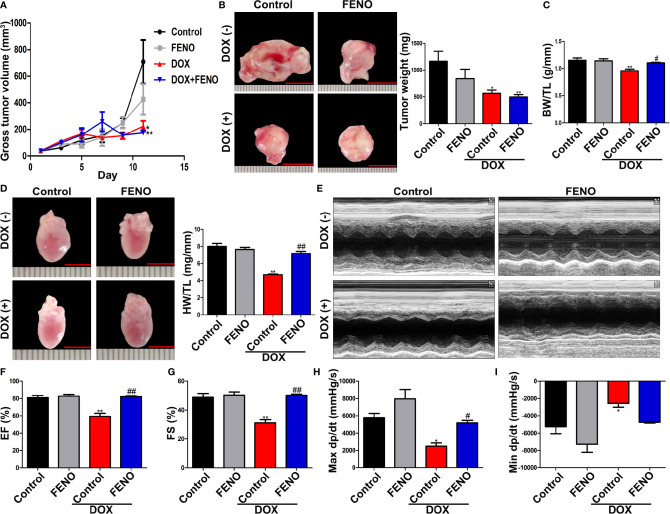
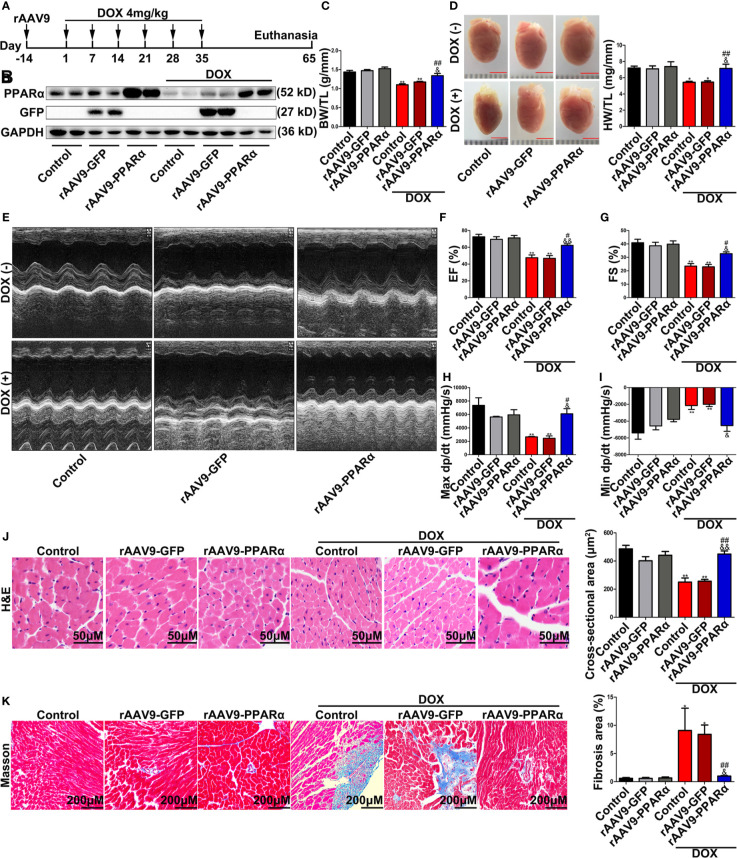
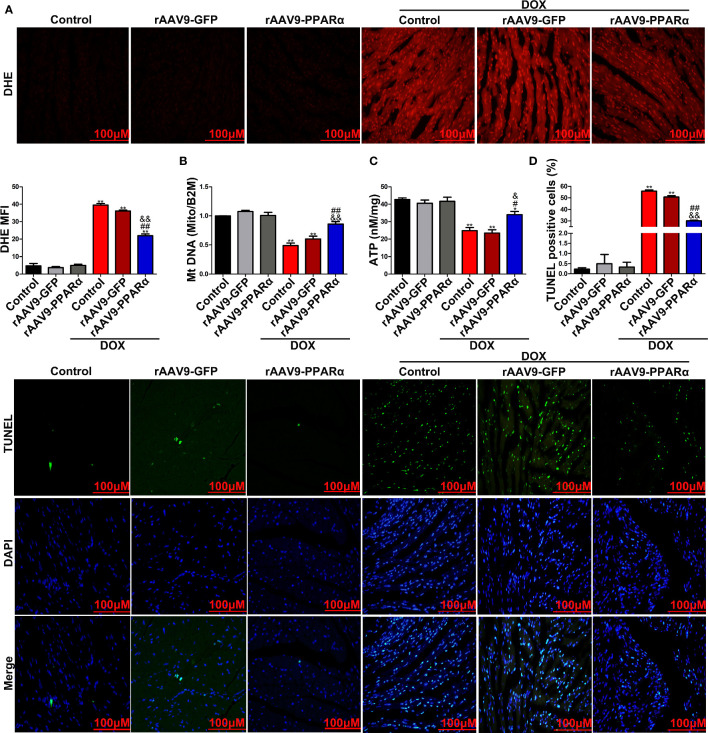
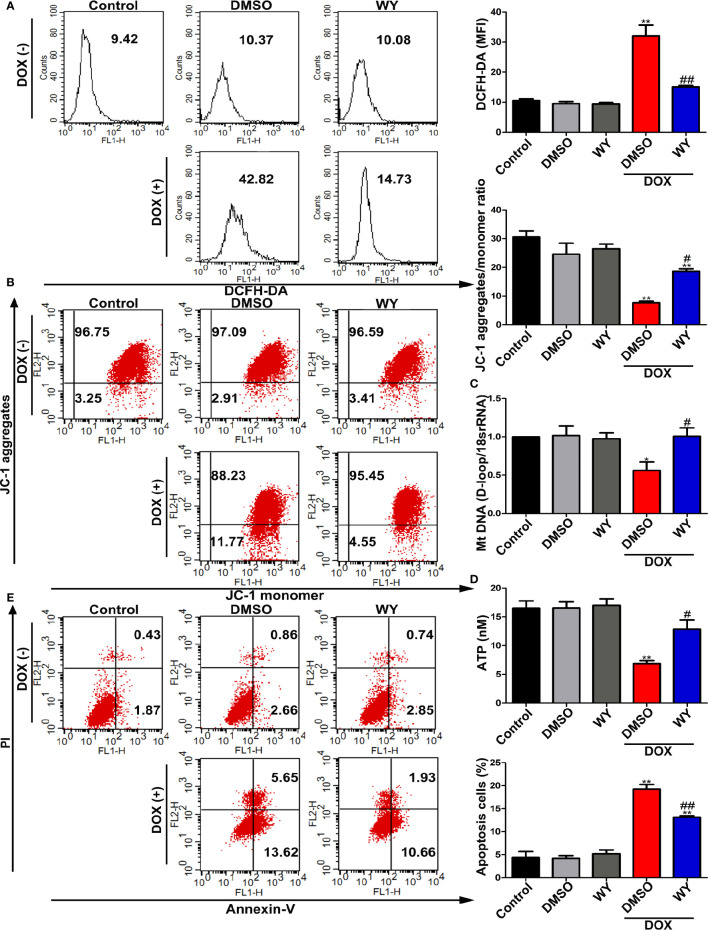
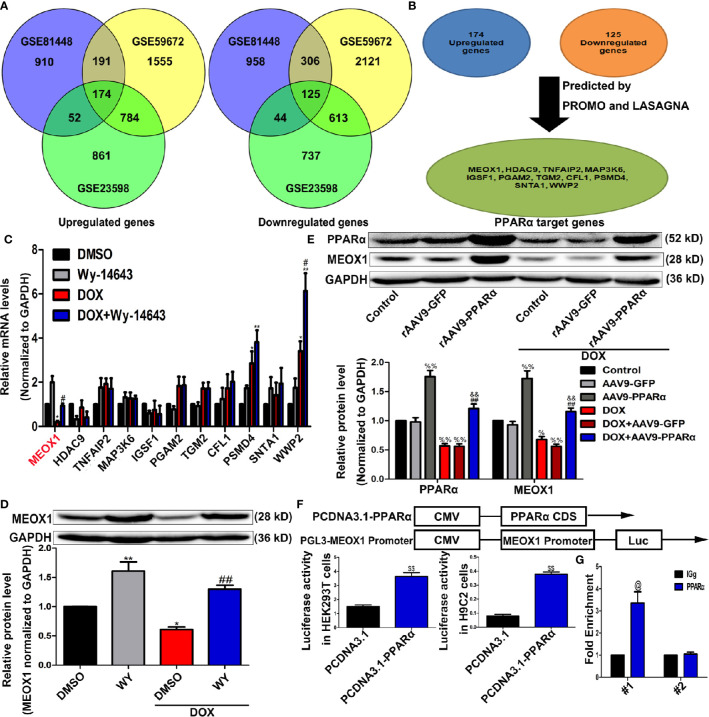
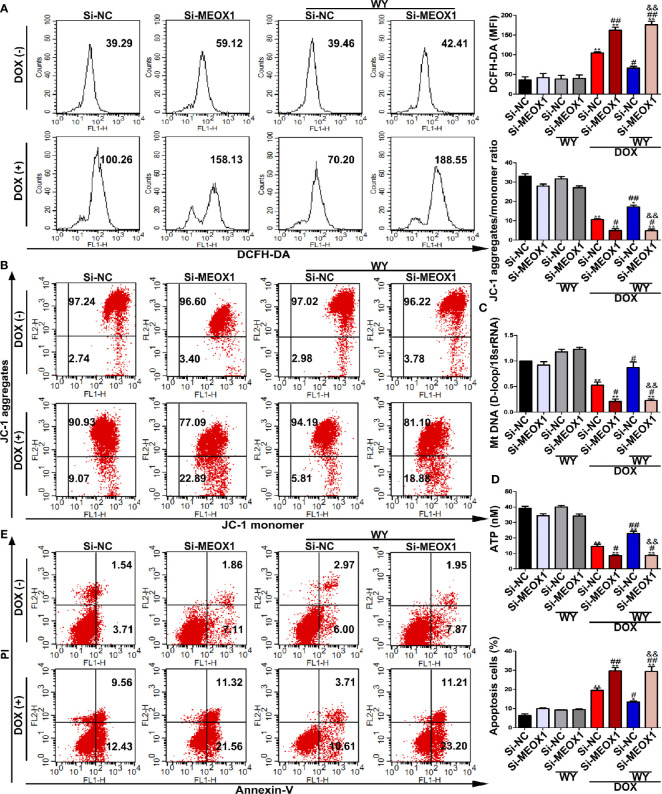
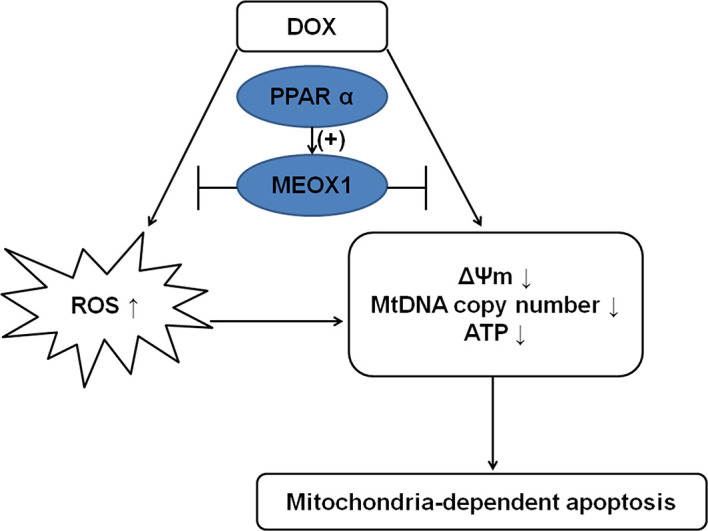
Doxorubicin (DOX), a chemotherapeutic drug widely used in the clinical setting, is known to cause serious cardiotoxicity and greatly reduces the survival rate as well as quality of life of patients receiving chemotherapy. Peroxisome proliferation activated receptor α (PPARα) is a type of ligand activated receptor of the nuclear hormone receptor family that regulates multiple gene expression. Several studies have shown that PPARα has anti-apoptotic and cardio-protective effects. However, its role in DOX-induced cardiotoxicity is rarely reported. In this study, we observed decreased expression of PPARα in the heart of tumor-bearing mice already treated with DOX; however, no such phenomenon was observed in tumor tissues. Next, we observed that the PPARα agonist, fenofibrate (FENO), had no effect on tumor progression; however, it enhanced cardiac function in tumor-bearing mice treated with DOX. Subsequently, recombinant adeno-associated virus serotype 9 (rAAV9) was used to manipulate the expression of PPARα in the heart of DOX-induced mice. Our results showed that PPARα gene delivery reduced cardiac dysfunction and mitochondria-dependent apoptosis in DOX-induced mice. Furthermore, we found that PPARα directly regulated the expression of mesenchyme homeobox 1 (MEOX1). Most importantly, the cardioprotective effects of PPARα could be neutralized by knocking down MEOX1. In summary, PPARα plays a vital role in DOX-induced cardiotoxicity and is a promising treatment target.

Keywords: PPARα; apoptosis; cardiotoxicity; doxorubicin; mitochondria.


Figures

Figure 1
Figure 1
DOX decreased PPARα expression and impaired cell survival. (A) Representative image of Western blot for PPARα expression in the hearts from tumor-bearing mice treated with or without DOX, N = 3. (B) Expression levels of PPARα, BCL2, and BAX in H9C2 cells treated with different concentrations of DOX were quantified by Western blot. N = 4 independent experiments. (C) Messenger RNA level of PPARα in H9C2 cells treated with different concentrations of DOX. N = 4. (D) Representative images of flow cytometry results for apoptosis in H9C2 cells treated with different concentrations of DOX. N = 3. *P < 0.05 vs. Control; **P < 0.01 vs. Control.
Figure 2
Figure 2
The activation of PPARα ameliorated cardiac function of tumor-bearing mice treated with DOX without promoting tumor growth. (A) Gross tumor volume of tumor-bearing mice treated with DOX with or without FENO at different time points. N = 6–7. (B) Representative images and weight of subcutaneous tumors in tumor-bearing mice. N = 6–7, bar = 10 mm. (C) Body weight/tibia length ratio of tumor-bearing mice in each group. N = 6–7. (D) Heart weight/tibia length ratio and corresponding representative pictures of tumor-bearing mice in each group. N = 6–7, bar = 5 mm. (E). Representative echocardiography in M mode. (FG) LVEF (F) and LVFS (G) of tumor-bearing mice treated with DOX with or without FENO. N = 6–7. (H, I) Max dp/dt (H) and min dp/dt (I) of tumor-bearing mice treated with DOX with or without FENO. N = 4–5. *P<0.05 vs. Control; **P<0.01 vs. Control; #P<0.05 vs. DOX; ##P<0.01 vs. DOX.
Figure 3
Figure 3
Overexpression of PPARα in the heart of DOX-induced mice improved cardiac function and reduced cardiotoxicity of DOX. (A) Schematic drawing of animal experiment 2. First, the mice were injected with rAAV9, and 2 weeks later, they were injected intraperitoneally with DOX (4 mg/kg) on the 1st, 7th, 14th, 21st, 28th, and 35th day, respectively. One month later, echocardiography was performed, and Millar catheter was inserted, followed by sacrifice. (B) Expression level of PPARα in heart tissues from DOX-induced mice was detected by Western blot, N = 2. (C) Body weight/tibia length ratio of mice in each group. N = 5–8. (D) Heart weight/tibia length ratio and corresponding representative pictures of mice in each group. N = 5–8, bar = 3 mm. (E) Representative echocardiography in M mode. (F, G) LVEF (F) and LVFS (G) of mice treated with DOX. N = 5–8. (H, I) Max dp/dt (H) and min dp/dt (I) of mice treated with DOX. N = 3. (J) Representative images and cross-sectional area of hearts from DOX-induced mice detected by H&E staining. N = 4–8, Bar = 50 μm. (K) Representative images of Masson’s trichrome staining and fibrosis area quantification. N = 4–8, Bar = 200 μm. *P < 0.05 vs. Control; **P < 0.01 vs. Control; #P < 0.05 vs. DOX; ##P < 0.01 vs. DOX; &P < 0.05 vs. DOX+rAAV9-GFP; &&P < 0.01 vs. DOX+rAAV9-GFP.
Figure 4
Figure 4
PPARα overexpression in the heart of DOX-induced mice improved mitochondria-dependent apoptosis. (A) Representative images and quantitative analysis of DHE staining in heart tissues of DOX-induced mice. N = 4, Bar = 100 μm. (B) MtDNA copy number of heart tissues from DOX-induced mice was detected by RT-PCR. N = 3. (C) Detection of ATP content in DOX-induced mice hearts by chemiluminescence assay. N = 3. (D) Representative images and quantitative analysis of TUNEL-FITC fluorescence staining in hearts of DOX-induced mice. N = 3, Bar = 100 μm. **P < 0.01 vs. Control; #P < 0.05 vs. DOX; ##P < 0.01 vs. DOX; &P < 0.05 vs. DOX+rAAV9-GFP; &&P<0.01 vs. DOX+rAAV9-GFP.
Figure 5
Figure 5
The activation of PPARα reduced mitochondria-dependent apoptosis in cardiomyocytes. (A) Intracellular ROS in H9C2 cells were quantitatively analyzed by flow cytometry. N = 4. (B) Representative images and quantitative analysis of flow cytometry for mitochondrial transmembrane potential in H9C2 cells by using fluorescent dye JC-1. N = 4. (C) MtDNA copy number in H9C2 cells was assessed by RT-PCR. N = 5. (D) ATP synthesis measured by chemiluminescence assay in H9C2 cells. N = 3. (E) Representative images and quantitative analysis of flow cytometry for apoptosis in H9C2 cells. N = 3. *P < 0.05 vs. Control; **P < 0.01 vs. Control; #P < 0.05 vs. DOX; ##P < 0.01 vs. DOX.
Figure 6
Figure 6
Identification of PPARα target genes. (A) Venn diagram showing the overlap for 174 upregulated genes and 125 downregulated genes from data sets GSE81448, GSE59672, and GSE23598. (B) PPARα target genes predicted by bioinformatics websites PROMO and LASAGNA. (C) Verification of bioinformatics results by RT-PCR in H9C2 cells. N = 3. (D, E) MEOX1 expression level measured by Western blotting analysis in H9C2 cells (D) and heart tissues (E). N = 4. (F) Pattern diagram (top) of plasmid construction, and the regulation of MEOX1 via PPARα was determined by Dual luciferase assay in HEK293T cells (left of bottom) and H9C2 cells (right of bottom). (G) Direct regulation of PPARα on MEOX1 revealed by ChIP assay. N = 4 independent experiments. #1 and #2 represent site 1 and site 2, respectively. *P < 0.05 vs. DMSO; **P < 0.01 vs. DMSO; #P < 0.05 vs. DOX; ##P < 0.01 vs. DOX; %P < 0.05 vs. Control; %%P<0.01 vs. Control; &&P < 0.01 vs. DOX+rAAV9-GFP; $$P < 0.01 vs. PCDNA3.1; @P < 0.05 vs. IGg.
Figure 7
Figure 7
The protective effect of PPARα activation in DOX-induced cardiomyocyte was neutralized by knocking down MEOX1. (A) Intracellular reactive oxygen species detected by flow cytometry in H9C2 cells. N = 3. (B) Representative images and quantitative analysis for mitochondrial transmembrane potential in H9C2 cells measured by flow cytometry. N = 3. (C) Quantification of mtDNA copy number in H9C2 cells was performed by RT-PCR. N = 3. (D) ATP content in H9C2 cells was detected by bioluminescent assay. N = 3. (E) DOX-induced apoptosis in H9C2 cells was assessed by flow cytometry. N = 3. *P < 0.05 vs. Si-NC; **P < 0.01 vs. Si-NC; #P < 0.05 vs. Si-NC+DOX; ##P < 0.01 vs. Si-NC+DOX; &&P < 0.01 vs. Si-NC+DOX+Wy-14643.
Figure 8
Figure 8
Mechanism diagram showing the protective effect of PPARα on DOX-induced cardiotoxicity. PPARα promoted MEOX1 transcription, leading to inhibition of ROS production and improvement in mitochondrial function, which decreased mitochondria-dependent apoptosis.

Similar articles

Cited by

References

    1. Abdelmegeed M. A., Moon K. H., Hardwick J. P., Gonzalez F. J., Song B. J. (2009). Role of peroxisome proliferator-activated receptor-alpha in fasting-mediated oxidative stress. Free Radic. Biol. Med. 47 (6), 767–778. 10.1016/j.freeradbiomed.2009.06.017 - DOI - PMC - PubMed
    1. Begriche K., Igoudjil A., Pessayre D., Fromenty B. (2006). Mitochondrial dysfunction in NASH: causes, consequences and possible means to prevent it. Mitochondrion 6 (1), 1–28. 10.1016/j.mito.2005.10.004 - DOI - PubMed
    1. Brown S. A., Sandhu N., Herrmann J. (2015). Systems biology approaches to adverse drug effects: the example of cardio-oncology. Nat. Rev. Clin. Oncol. 12 (12), 718–731. 10.1038/nrclinonc.2015.168 - DOI - PubMed
    1. Bulhak A. A., Sjoquist P. O., Xu C. B., Edvinsson L., Pernow J. (2006). Protection against myocardial ischaemia/reperfusion injury by PPAR-alpha activation is related to production of nitric oxide and endothelin-1. Basic Res. Cardiol. 101 (3), 244–252. 10.1007/s00395-005-0580-1 - DOI - PubMed
    1. Cappetta D., De Angelis A., Sapio L., Prezioso L., Illiano M., Quaini F., et al. (2017). Oxidative Stress and Cellular Response to Doxorubicin: A Common Factor in the Complex Milieu of Anthracycline Cardiotoxicity. Oxid. Med. Cell Longev. 2017:1521020. 10.1155/2017/1521020 - DOI - PMC - PubMed