

Compound Fu brick tea modifies the intestinal microbiome composition in high-fat diet-induced obesity mice
- PMID: 33133553
- PMCID: PMC7590332
- DOI: 10.1002/fsn3.1850
Compound Fu brick tea modifies the intestinal microbiome composition in high-fat diet-induced obesity mice
Abstract
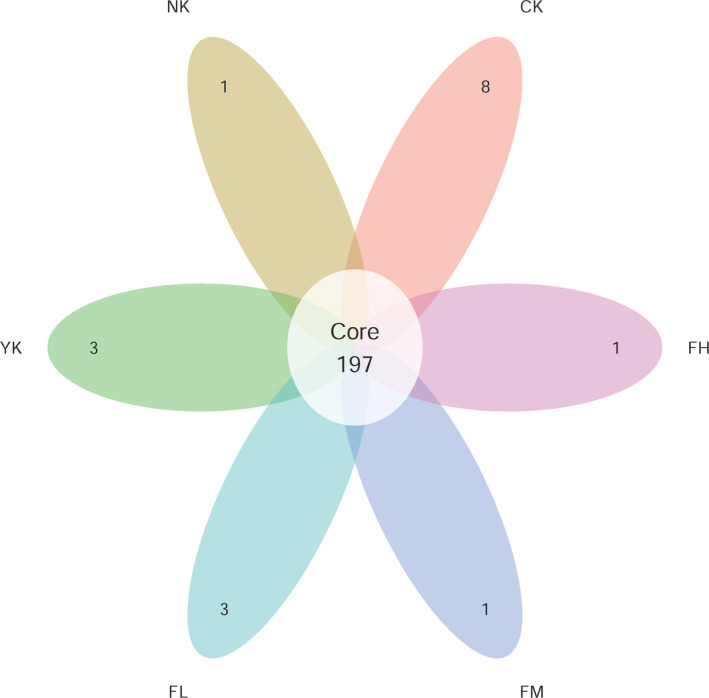
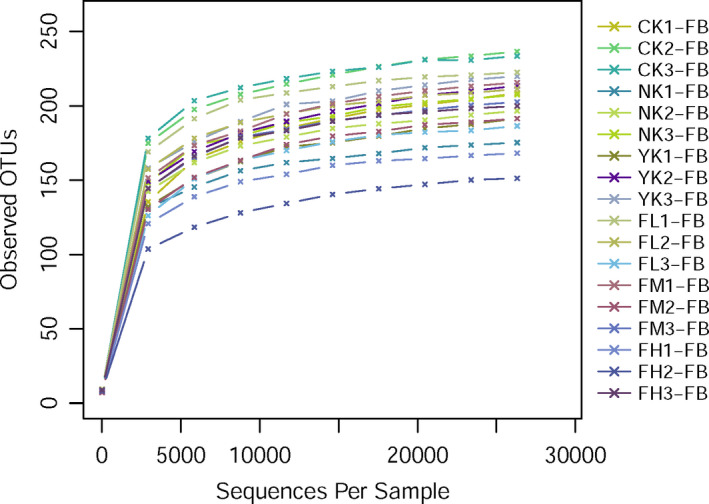
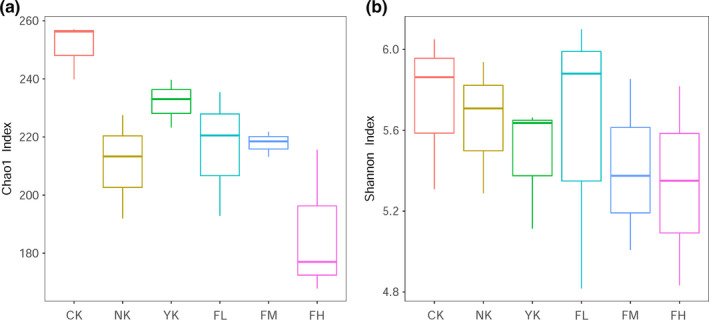
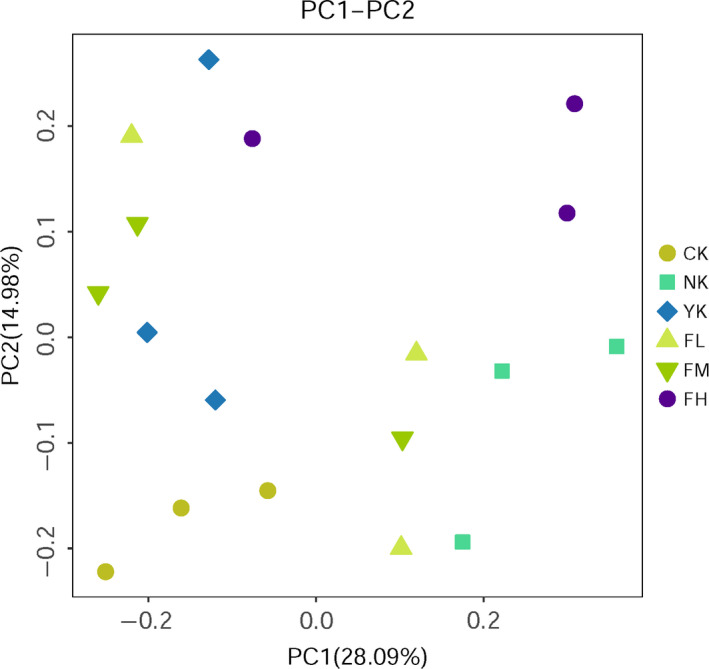
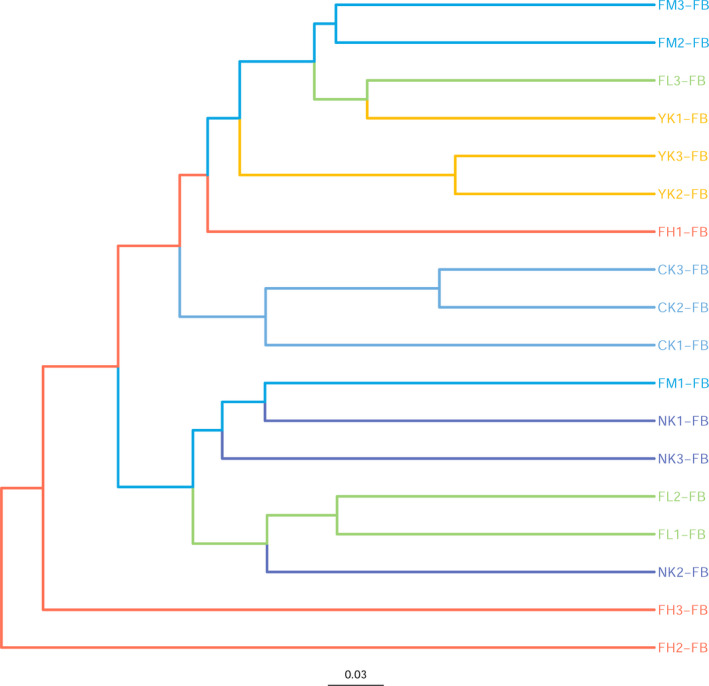
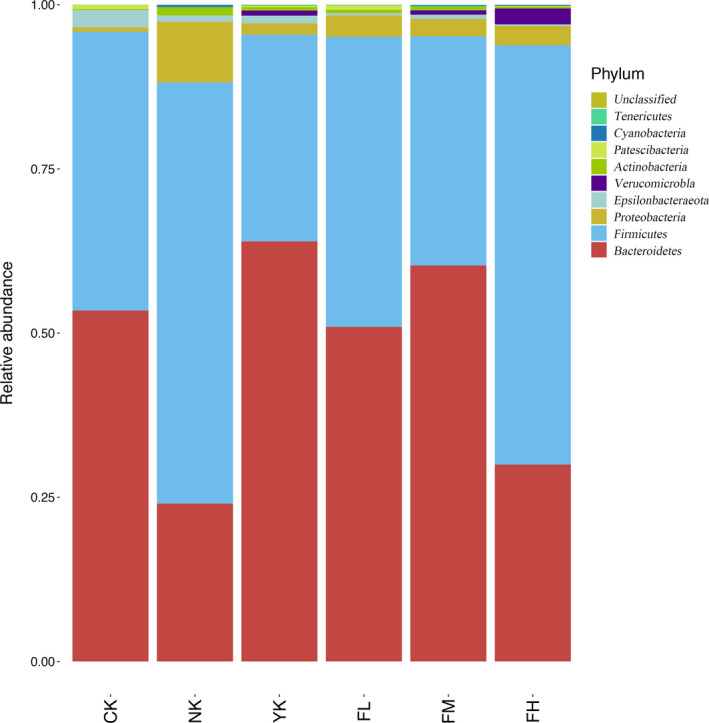
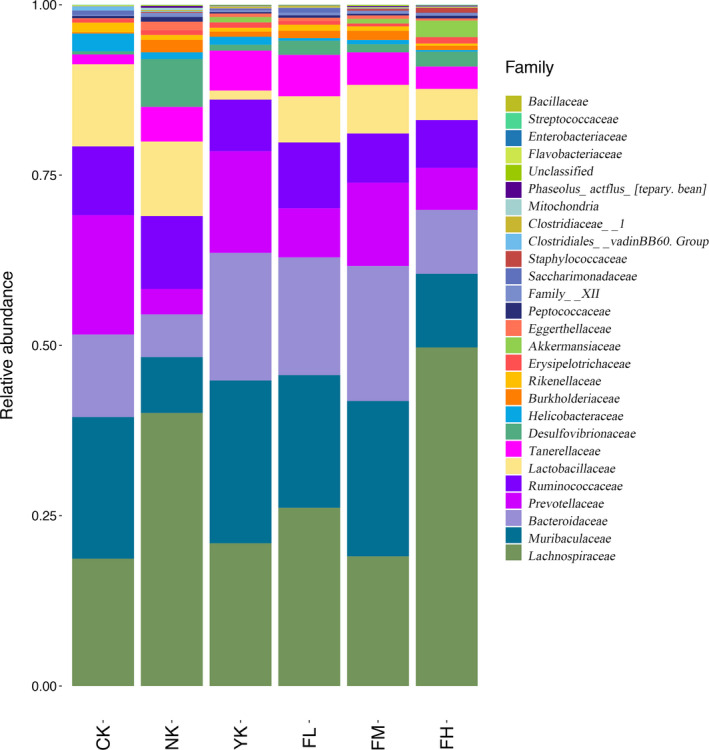
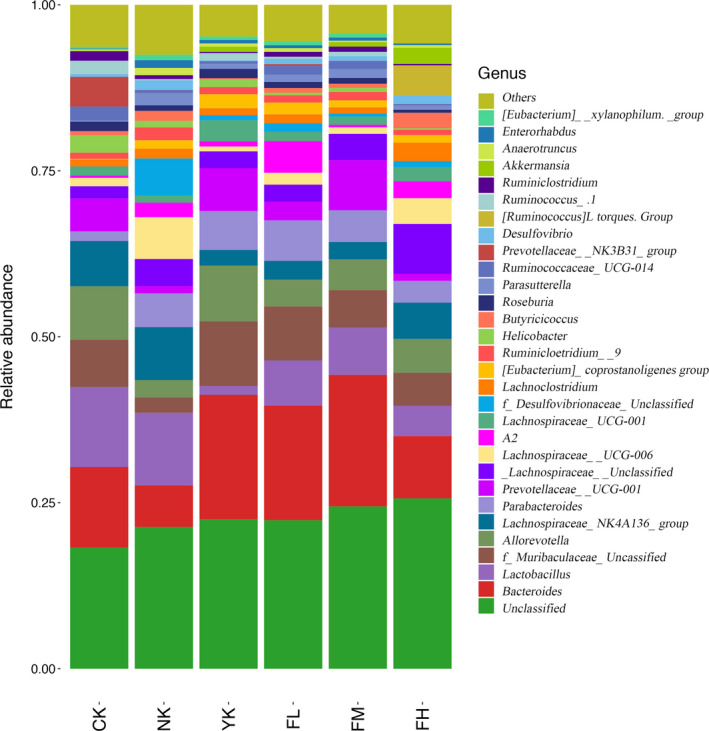
Compound Fu Brick Tea (CFBT), which is from Duyun city in China, is a traditional Chinese dark tea, Fu Brick Tea, mixed with six herbal medicine. It is consumed by local people for reducing weight, but the mechanism is not clear. The disorder of intestinal microbiome caused by long-term high-fat diet (HFD) is one of the inducements of obesity and related metabolic syndrome. In this study, mice were fed with HFD to establish a high-fat model. Fifty mice were randomly divided into six groups: normal control (CK), HFD model control (NK), positive control with medicine (YK), CFBT groups with low, middle, and high dose (FL, FM, FH). The V3-V4 DNA region of fecal microbiome from mouse intestine was sequenced. The results showed that the diversity of intestinal microflora was highest in CK and lowest in NK. Compared with CK, the dominant bacterium Firmicutes was increased and Bacteroidetes decreased at phylum level in NK. Compared with NK, the abundance of microbiome in CFBT groups was significantly higher and the composition was changed: Muribaculaceae, Bacteroidaceae, and Prevotellaceae increased and Lachnospiraceae decreased in CFBT groups at family level, while at the genus level, Bacteroides increased and Lactobacillus decreased. These results conclude that CFBT can increase the abundance of intestinal microbiome in mice, promote the growth of beneficial bacteria and reduce the number of pathogenic bacteria, and restore the imbalance of intestinal microbiome caused by poor diet.
Keywords: compound Fu brick tea; high‐fat diet; high‐throughput sequencing; intestinal microbiota.
© 2020 The Authors. Food Science & Nutrition published by Wiley Periodicals LLC.
Conflict of interest statement
The authors declare that they do not have any conflict of interest.
Figures
Similar articles
-
Metabolomics Analysis Reveals the Effects of Compound Fuzhuan Brick Tea (CFBT) on Regulating Dyslipidemia and Metabolic Disorders in Mice Induced by High-Fat Diet.Nutrients. 2022 Mar 8;14(6):1128. doi: 10.3390/nu14061128. Nutrients. 2022. PMID: 35334785 Free PMC article.
-
Effect of Duyun Compound Green Tea on Gut Microbiota Diversity in High-Fat-Diet-Induced Mice Revealed by Illumina High-Throughput Sequencing.Evid Based Complement Alternat Med. 2021 Feb 9;2021:8832554. doi: 10.1155/2021/8832554. eCollection 2021. Evid Based Complement Alternat Med. 2021. PMID: 33628318 Free PMC article.
-
Polyphenols from Fu Brick Tea Reduce Obesity via Modulation of Gut Microbiota and Gut Microbiota-Related Intestinal Oxidative Stress and Barrier Function.J Agric Food Chem. 2021 Dec 8;69(48):14530-14543. doi: 10.1021/acs.jafc.1c04553. Epub 2021 Nov 9. J Agric Food Chem. 2021. PMID: 34752089
-
[Effects of probiotics on the intestinal microecological abnormalities and colorectal cancer of mice induced by high-fat diet].Zhonghua Wei Chang Wai Ke Za Zhi. 2020 Jul 10;23(Z1):77-85. doi: 10.3760/cma.j.cn.441530-20200417-00223. Zhonghua Wei Chang Wai Ke Za Zhi. 2020. PMID: 32594730 Chinese.
-
Chemical components of Fu brick tea and its potential preventive effects on metabolic syndrome.Food Sci Nutr. 2023 Nov 7;12(1):35-47. doi: 10.1002/fsn3.3771. eCollection 2024 Jan. Food Sci Nutr. 2023. PMID: 38268870 Free PMC article. Review.
Cited by
-
Unraveling intestinal microbiota's dominance in polycystic ovary syndrome pathogenesis over vaginal microbiota.Front Cell Infect Microbiol. 2024 Mar 28;14:1364097. doi: 10.3389/fcimb.2024.1364097. eCollection 2024. Front Cell Infect Microbiol. 2024. PMID: 38606298 Free PMC article.
-
Differential regulation and preventive mechanisms of green tea powder with different quality attributes on high-fat diet-induced obesity in mice.Front Nutr. 2022 Sep 29;9:992815. doi: 10.3389/fnut.2022.992815. eCollection 2022. Front Nutr. 2022. PMID: 36245513 Free PMC article.
-
Exploration of the Muribaculaceae Family in the Gut Microbiota: Diversity, Metabolism, and Function.Nutrients. 2024 Aug 12;16(16):2660. doi: 10.3390/nu16162660. Nutrients. 2024. PMID: 39203797 Free PMC article. Review.
-
A Mild Causal Relationship Between Tea Consumption and Obesity in General Population: A Two-Sample Mendelian Randomization Study.Front Genet. 2022 Feb 24;13:795049. doi: 10.3389/fgene.2022.795049. eCollection 2022. Front Genet. 2022. PMID: 35281810 Free PMC article.
-
Protective Effects of Bacteriocin-Producing Lactiplantibacillus plantarum on Intestinal Barrier of Mice.Nutrients. 2023 Aug 10;15(16):3518. doi: 10.3390/nu15163518. Nutrients. 2023. PMID: 37630708 Free PMC article.
References
-
- Amsterdam, J. D. , Li, Q. S. , Xie, S. X. , & Mao, J. J. (2019). Putative antidepressant effect of chamomile ( Matricaria chamomilla L.) oral extract in subjects with comorbid generalized anxiety disorder and depression. The Journal of Alternative and Complementary Medicine, acm.2019.0252. 10.1089/acm.2019.0252. - DOI - PMC - PubMed
LinkOut - more resources
Full Text Sources
Research Materials
Miscellaneous
