

High-sugar diet intake, physical activity, and gut microbiota crosstalk: Implications for obesity in rats
- PMID: 33133570
- PMCID: PMC7590324
- DOI: 10.1002/fsn3.1842
High-sugar diet intake, physical activity, and gut microbiota crosstalk: Implications for obesity in rats
Abstract
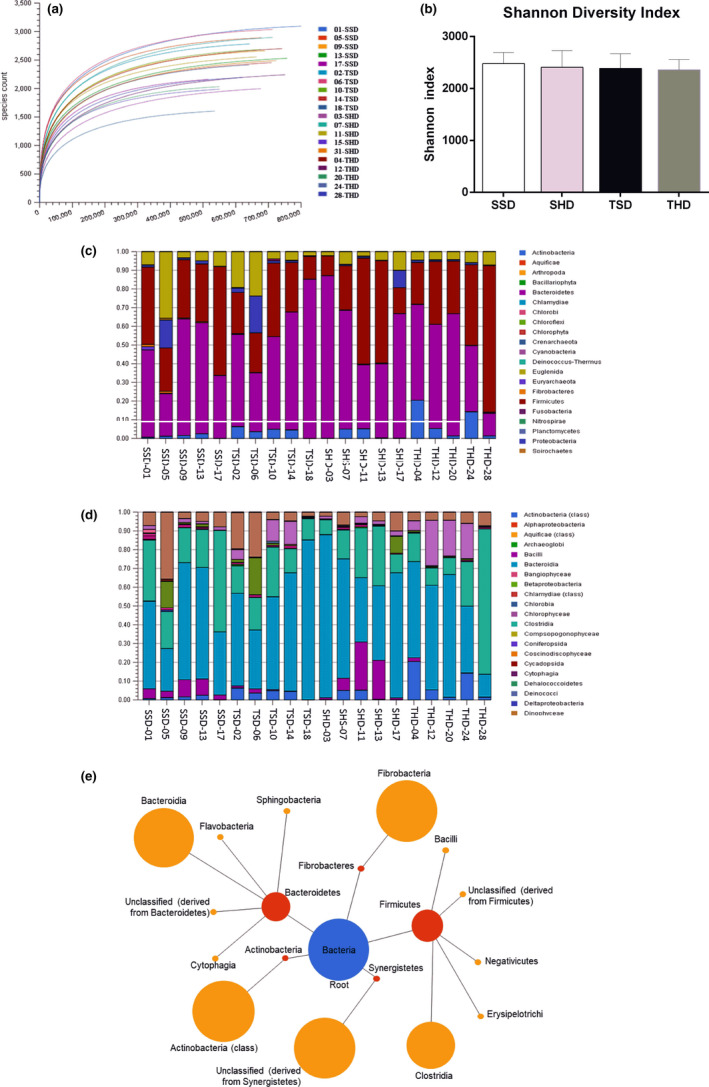
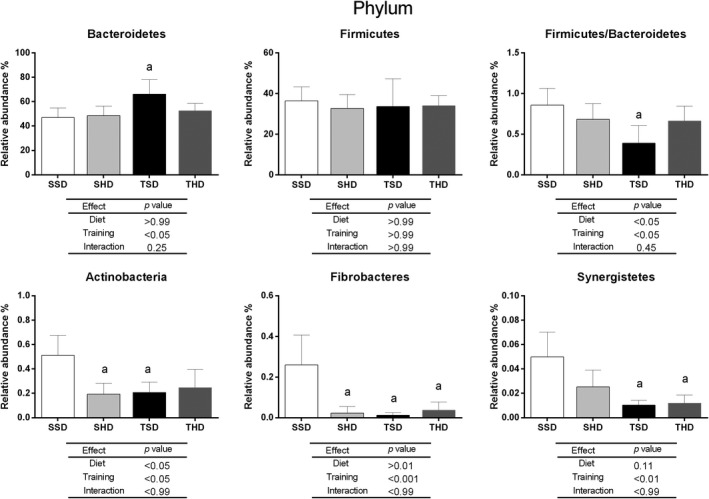
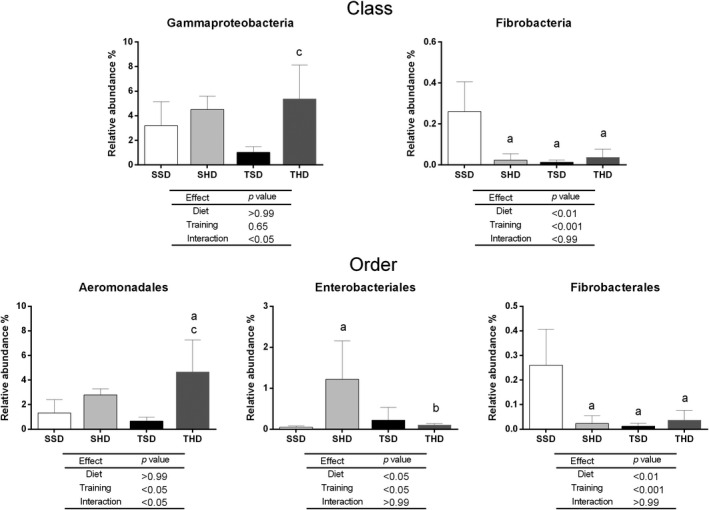
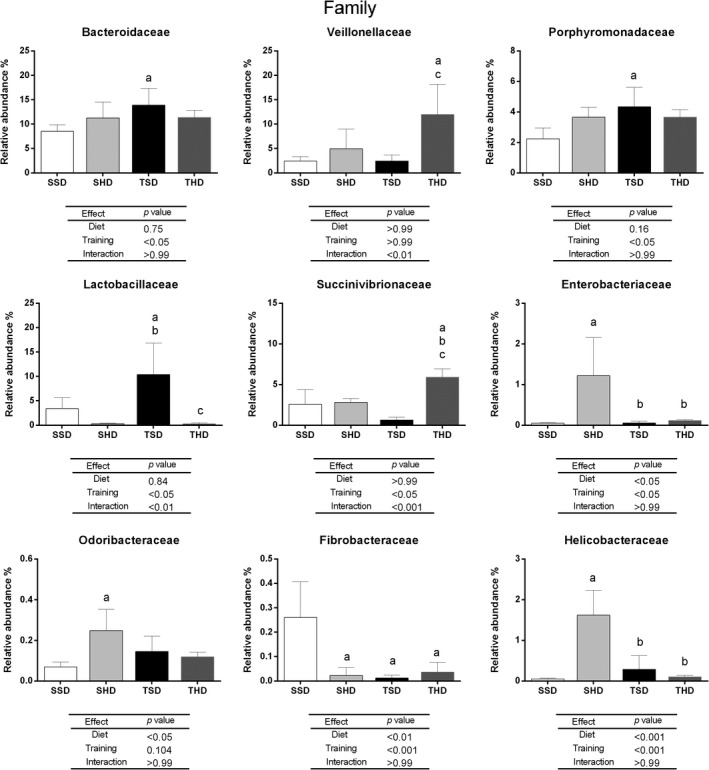
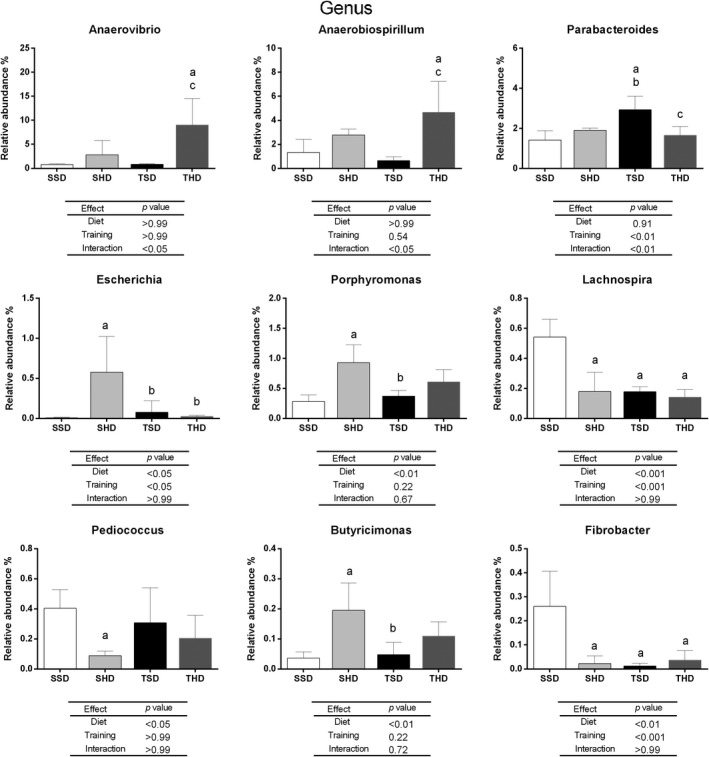
This study aims to evaluate the effect of long-term high-sugar diet (HSD) intake and regular physical activity on gut microbiota as well as its health impact. Weaned male Wistar rats were fed with standard chow diet (SSD) or HSD ad libitum and subjected or not to regular swimming training with a workload (2% of body weight) for 15 weeks. Feces samples were used on microbiome analysis using 16S rRNA amplicon sequencing. HSD increased body mass, adipose cushions, and the serum levels of triglycerides and VLDL, also changed the bacteria taxons associated with metabolic disorders (increase taxons belonging to Proteobacteria phylum and decrease Pediococcus genus); the swim training reverted these changes. SSD intake increased the abundance of bacteria associated with metabolization of dietary fiber. Training in association with SSD consumption beneficially modulated the microbiota, increasing the Bacteroidetes, Bacteroidaceae, Porphyromonadaceae, Parabacteroides, and Lactobacillaceae, and decreasing the Firmicute/Bacteroidetes ratio; training was not able to maintain this profile in animals SHD-fed. Physical training modulates the gut microbiota reversing the obesogenic response caused by SHD. However, training itself is not efficient for up-regulating the probiotic bacteria in comparison to its association with a balanced diet.
Keywords: high‐sugar diet; microbiota; obesity; physical activity; swimming training.
© 2020 The Authors. Food Science & Nutrition published by Wiley Periodicals LLC.
Conflict of interest statement
All authors declare no conflict of interest.
Figures
Similar articles
-
Modulation of sirtuin expression by a high-sugar diet and regular swimming trained precedes the loss of kidney function.Braz J Med Biol Res. 2025 Jan 31;58:e13043. doi: 10.1590/1414-431X2024e13043. eCollection 2025. Braz J Med Biol Res. 2025. PMID: 39907422 Free PMC article.
-
Diet-driven microbiota dysbiosis is associated with vagal remodeling and obesity.Physiol Behav. 2017 May 1;173:305-317. doi: 10.1016/j.physbeh.2017.02.027. Epub 2017 Feb 27. Physiol Behav. 2017. PMID: 28249783 Free PMC article.
-
Effects of different diets on intestinal microbiota and nonalcoholic fatty liver disease development.World J Gastroenterol. 2016 Aug 28;22(32):7353-64. doi: 10.3748/wjg.v22.i32.7353. World J Gastroenterol. 2016. PMID: 27621581 Free PMC article.
-
Gut Microbiome Composition and Metabolic Status Are Differently Affected by Early Exposure to Unhealthy Diets in a Rat Model.Nutrients. 2021 Sep 17;13(9):3236. doi: 10.3390/nu13093236. Nutrients. 2021. PMID: 34579113 Free PMC article.
-
Can the gastrointestinal microbiota be modulated by dietary fibre to treat obesity?Ir J Med Sci. 2018 May;187(2):393-402. doi: 10.1007/s11845-017-1686-9. Epub 2017 Oct 16. Ir J Med Sci. 2018. PMID: 29038988 Review.
Cited by
-
Effects of the Long-Term Consumption of a High-Sucrose Diet on microRNA Expression in Visceral Adipose Tissue of Rats.Nutrients. 2022 Aug 24;14(17):3465. doi: 10.3390/nu14173465. Nutrients. 2022. PMID: 36079722 Free PMC article.
-
Bayesian compositional regression with microbiome features via variational inference.BMC Bioinformatics. 2023 May 22;24(1):210. doi: 10.1186/s12859-023-05219-x. BMC Bioinformatics. 2023. PMID: 37217852 Free PMC article.
-
Importance of good hosting: reviewing the bi-directionality of the microbiome-gut-brain-axis.Front Neurosci. 2024 May 15;18:1386866. doi: 10.3389/fnins.2024.1386866. eCollection 2024. Front Neurosci. 2024. PMID: 38812976 Free PMC article. Review.
-
Higher physical activity levels are related to faecal microbiota diversity and composition in young adults.Biol Sport. 2025 Jan;42(1):123-135. doi: 10.5114/biolsport.2025.139850. Epub 2024 Jun 4. Biol Sport. 2025. PMID: 39758173 Free PMC article.
-
Modulation of sirtuin expression by a high-sugar diet and regular swimming trained precedes the loss of kidney function.Braz J Med Biol Res. 2025 Jan 31;58:e13043. doi: 10.1590/1414-431X2024e13043. eCollection 2025. Braz J Med Biol Res. 2025. PMID: 39907422 Free PMC article.
References
-
- Amrane, S. , & Lagier, J.‐C. (2018). Metagenomic and clinical microbiology. Human Microbiome Journal, 9, 1–6. 10.1016/j.humic.2018.06.001 - DOI
-
- Caporaso, J. G. , Lauber, L. , Walters, W. A. , Berg‐Lyons, D. , Lozupone, C. A. , Turnbaugh, P. J. , … Knight, R. (2011). Global patterns of 16S rRNA diversity at a depth of millions of sequences per sample. Proceedings of the National Academy of Sciences, 108, 4516–4522. 10.1073/pnas.1000080107 - DOI - PMC - PubMed
LinkOut - more resources
Full Text Sources
