

Limited effect of duration of CMV infection on adaptive immunity and frailty: insights from a 27-year-long longitudinal study
- PMID: 33133599
- PMCID: PMC7586993
- DOI: 10.1002/cti2.1193
Limited effect of duration of CMV infection on adaptive immunity and frailty: insights from a 27-year-long longitudinal study
Abstract
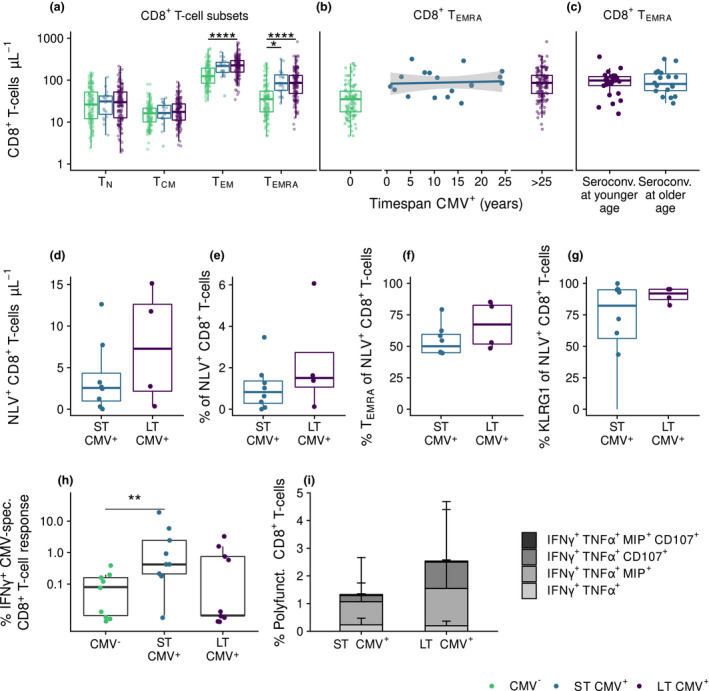
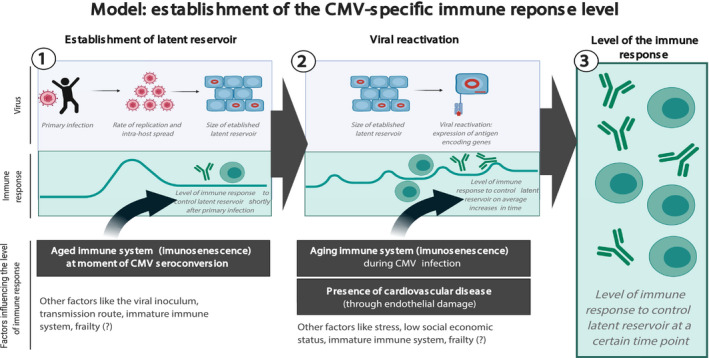
Objectives: Cytomegalovirus infection is thought to affect the immune system and to impact general health during ageing. Higher CMV-specific antibody levels in the elderly are generally assumed to reflect experienced viral reactivation during life. Furthermore, high levels of terminally differentiated and CMV-specific T cells are hallmarks of CMV infection, which are thought to expand over time, a process also referred to as memory inflation.
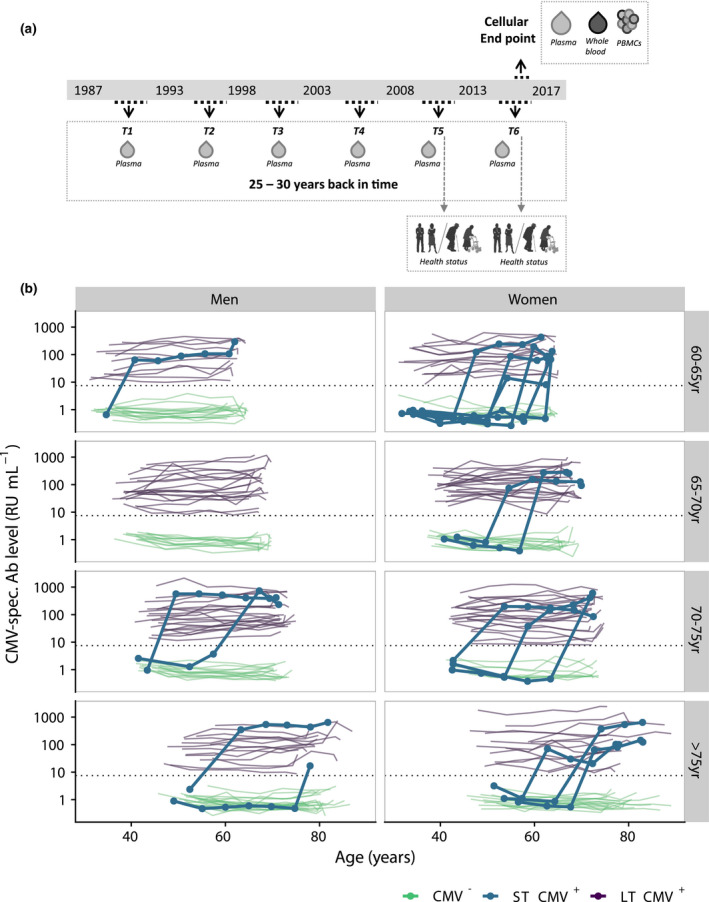
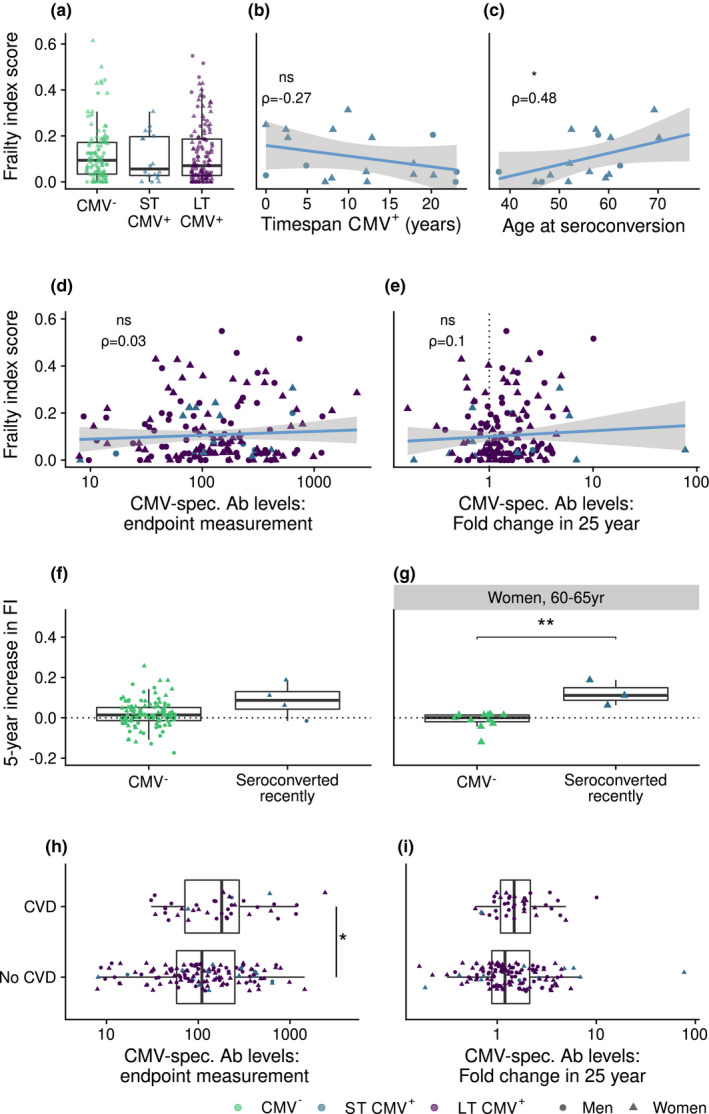
Methods: We studied CMV-specific antibody levels over ~ 27 years in 268 individuals (aged 60-89 years at study endpoint), and to link duration of CMV infection to T-cell numbers, CMV-specific T-cell functions, frailty and cardiovascular disease at study endpoint.
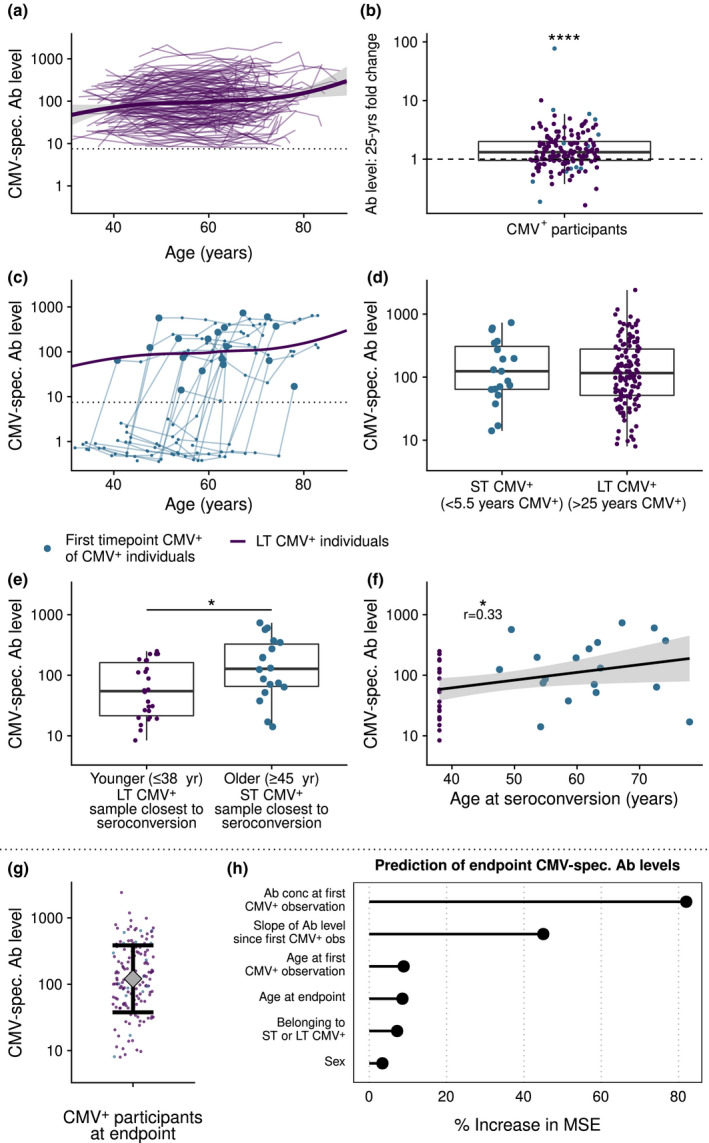
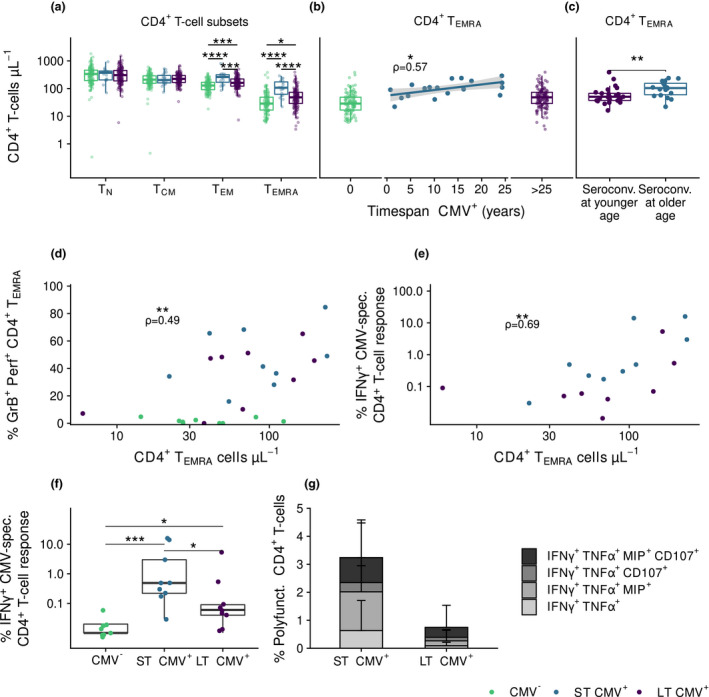
Results: In our study, 136/268 individuals were long-term CMV seropositive and 19 seroconverted during follow-up (seroconversion rate: 0.56%/year). CMV-specific antibody levels increased slightly over time. However, we did not find an association between duration of CMV infection and CMV-specific antibody levels at study endpoint. No clear association between duration of CMV infection and the size and function of the memory T-cell pool was observed. Elevated CMV-specific antibody levels were associated with the prevalence of cardiovascular disease but not with frailty. Age at CMV seroconversion was positively associated with CMV-specific antibody levels, memory CD4+ T-cell numbers and frailty.
Conclusion: Cytomegalovirus-specific memory T cells develop shortly after CMV seroconversion but do not seem to further increase over time. Age-related effects other than duration of CMV infection seem to contribute to CMV-induced changes in the immune system. Although CMV-specific immunity is not evidently linked to frailty, it tends to associate with higher prevalence of cardiovascular disease.
Keywords: CMV‐specific antibodies; T‐cell response; ageing; cardiovascular disease; cytomegalovirus infection; frailty.
© 2020 The Authors. Clinical & Translational Immunology published by John Wiley & Sons Australia, Ltd on behalf of Australian and New Zealand Society for Immunology, Inc.
Conflict of interest statement
The authors declare no conflict of interest.
Figures
Similar articles
-
T-cell immunity against cytomegalovirus in HIV infection and aging: relationships with inflammation, immune activation, and frailty.Med Microbiol Immunol. 2019 Aug;208(3-4):289-294. doi: 10.1007/s00430-019-00591-z. Epub 2019 Mar 21. Med Microbiol Immunol. 2019. PMID: 30900090 Free PMC article. Review.
-
Viral Persistence Induces Antibody Inflation without Altering Antibody Avidity.J Virol. 2016 Apr 14;90(9):4402-4411. doi: 10.1128/JVI.03177-15. Print 2016 May. J Virol. 2016. PMID: 26889035 Free PMC article.
-
Dominance of virus-specific CD8 T cells in human primary cytomegalovirus infection.J Am Soc Nephrol. 2002 Oct;13(10):2577-84. doi: 10.1097/01.asn.0000030141.41726.52. J Am Soc Nephrol. 2002. PMID: 12239248
-
Negative Effect of Age, but Not of Latent Cytomegalovirus Infection on the Antibody Response to a Novel Influenza Vaccine Strain in Healthy Adults.Front Immunol. 2018 Jan 29;9:82. doi: 10.3389/fimmu.2018.00082. eCollection 2018. Front Immunol. 2018. PMID: 29434600 Free PMC article.
-
Cytomegalovirus Infection and Memory T Cell Inflation.Immune Netw. 2015 Aug;15(4):186-90. doi: 10.4110/in.2015.15.4.186. Epub 2015 Aug 26. Immune Netw. 2015. PMID: 26330804 Free PMC article. Review.
Cited by
-
Cytomegalovirus and Epstein-Barr virus co-infected young and middle-aged adults can have an aging-related T-cell phenotype.Sci Rep. 2023 Jul 5;13(1):10912. doi: 10.1038/s41598-023-37502-5. Sci Rep. 2023. PMID: 37407603 Free PMC article.
-
Quantification of T-cell dynamics during latent cytomegalovirus infection in humans.PLoS Pathog. 2021 Dec 16;17(12):e1010152. doi: 10.1371/journal.ppat.1010152. eCollection 2021 Dec. PLoS Pathog. 2021. PMID: 34914799 Free PMC article.
-
Relationship between Cytomegalovirus Viremia and Long-Term Outcomes in Kidney Transplant Recipients with Different Donor Ages.Microorganisms. 2023 Feb 11;11(2):458. doi: 10.3390/microorganisms11020458. Microorganisms. 2023. PMID: 36838423 Free PMC article.
-
CD31 + naïve T cells associate with immunosenescence and responsiveness to multiple vaccines in older adults.Immun Ageing. 2025 Mar 8;22(1):10. doi: 10.1186/s12979-025-00504-0. Immun Ageing. 2025. PMID: 40055790 Free PMC article.
-
On the feasibility of using TCR sequencing to follow a vaccination response - lessons learned.Front Immunol. 2023 Jul 13;14:1210168. doi: 10.3389/fimmu.2023.1210168. eCollection 2023. Front Immunol. 2023. PMID: 37520553 Free PMC article.
References
-
- Korndewal MJ, Mollema L, Tcherniaeva I et al Cytomegalovirus infection in the Netherlands: seroprevalence, risk factors, and implications. J Clin Virol 2015; 63: 53–58. - PubMed
LinkOut - more resources
Full Text Sources
Research Materials