. 2020 Oct;125(10):e2019JC015913.
doi: 10.1029/2019JC015913. Epub 2020 Oct 1.

A Lagrangian Snow-Evolution System for Sea-Ice Applications (SnowModel-LG): Part I-Model Description

Affiliations

A Lagrangian Snow-Evolution System for Sea-Ice Applications (SnowModel-LG): Part I-Model Description

Glen E Liston et al. J Geophys Res Oceans. 2020 Oct.

Abstract

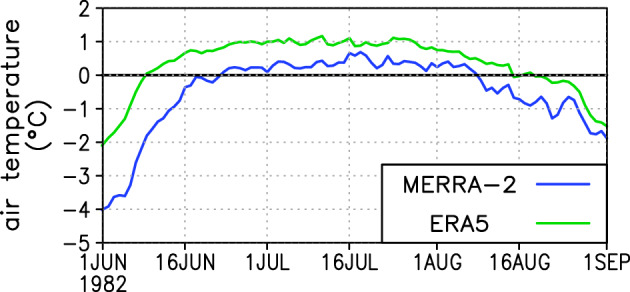
A Lagrangian snow-evolution model (SnowModel-LG) was used to produce daily, pan-Arctic, snow-on-sea-ice, snow property distributions on a 25 × 25-km grid, from 1 August 1980 through 31 July 2018 (38 years). The model was forced with NASA's Modern Era Retrospective-Analysis for Research and Applications-Version 2 (MERRA-2) and European Centre for Medium-Range Weather Forecasts (ECMWF) ReAnalysis-5th Generation (ERA5) atmospheric reanalyses, and National Snow and Ice Data Center (NSIDC) sea ice parcel concentration and trajectory data sets (approximately 61,000, 14 × 14-km parcels). The simulations performed full surface and internal energy and mass balances within a multilayer snowpack evolution system. Processes and features accounted for included rainfall, snowfall, sublimation from static-surfaces and blowing-snow, snow melt, snow density evolution, snow temperature profiles, energy and mass transfers within the snowpack, superimposed ice, and ice dynamics. The simulations produced horizontal snow spatial structures that likely exist in the natural system but have not been revealed in previous studies spanning these spatial and temporal domains. Blowing-snow sublimation made a significant contribution to the snowpack mass budget. The superimposed ice layer was minimal and decreased over the last four decades. Snow carryover to the next accumulation season was minimal and sensitive to the melt-season atmospheric forcing (e.g., the average summer melt period was 3 weeks or 50% longer with ERA5 forcing than MERRA-2 forcing). Observed ice dynamics controlled the ice parcel age (in days), and ice age exerted a first-order control on snow property evolution.

Keywords: Arctic; Lagrangian; SnowModel‐LG; snow‐on‐sea‐ice.


Figures

Figure 1
Figure 1
Example parcel trajectories used in the Lagrangian simulations (2013–2014); each color represents a different parcel, every 150th parcel is plotted. Average parcel size was 14 × 14 km.
Figure 2
Figure 2
MERRA‐2 SnowModel‐LG simulation outputs on 1 April 2014 (color shades; cm water‐equivalent). Figure panel pairs (a)–(g) highlight each component of the snowpack mass budget given by Equation 1, where the term in the budget equation is listed in the upper left corner of each panel. In addition, these panels quantify the role of ice motion on the snowpack evolution; shown are two simulations, one with no ice motion (denoted NoMo), and one with Lagrangian ice motion (denoted LG). (a) Rainfall, (b) snowfall, (c) static‐surface sublimation, (d) blowing‐snow sublimation, (e) snowmelt, (f) ice dynamics, and (g) snow‐water‐equivalent (SWE) depth. The NoMo panels were scaled to be visually compatible with the LG panels (see section 3). Except for (f), the color bar increments are not linear; the increments were chosen to optimize visibility of the spatial structures and patterns displayed in the plots.
Figure 3
Figure 3
MERRA‐2 SnowModel‐LG simulation outputs on 1 April 2014. Panels (a) and (b) display the conversion from snow‐water‐equivalent (SWE) depth in Equation 1 to snow depth and density given by Equation 2. Shown are two simulations, one with no ice motion (denoted NoMo), and one with Lagrangian ice motion (denoted LG). (a) Snow density (kg m−3), and (b) snow depth (cm). NoMo panel (b) was scaled to be visually compatible with LG panel (b) (see section 3).
Figure 4
Figure 4
Same as Figure 3b but for ERA5, showing the snow depth (cm) given by Equation 2. Shown are two simulations, one with no ice motion (denoted NoMo), and one with Lagrangian ice motion (denoted LG). The NoMo panel was scaled to be visually compatible with the LG panel (see section 3).
Figure 5
Figure 5
Average (1 August 2013 to 1 April 2014) 10‐m height wind speed (m s−1) for the MERRA‐2 forced simulation. This figure corresponds to, and identifies the wind forcing associated with, the blowing‐snow sublimation quantities presented in Figure 2d. Over much of the domain the average winter wind speeds are sufficient (>5 m s−1) to transport snow, hence the relatively strong influence of blowing‐snow sublimation on the snowpack mass budget.
Figure 6
Figure 6
MERRA‐2 simulation results on 1 April 2014. (a) Parcel age (days). (b) The relationship between parcel age (days) (from panel (a)) and snow depth (cm) (from Figure 3b‐LG). Parcel (or ice) age is a first‐order control on snow depth.
Figure 7
Figure 7
MERRA‐2 simulation results on 1 April 2014. (a) Parcel age (days). (b) The relationship between parcel age (days) (from panel (a)) and the ice dynamics contribution to snow‐water‐equivalent (SWE) depth (cm) (from Figure 2f‐LG). Here ice dynamics is D in Equation 1, and it represents SWE changes in response to ice parcels being created and lost through ice motion, including divergence and convergence. To eliminate regions where rainfall and snowmelt play key roles in the snow evolution prior to 1 April 2014, those areas have been removed from the analyses; see the data mask in (a). Parcel (or ice) age is intimately tied to the ice dynamics.
Figure 8
Figure 8
The 1 April 2014 snow depth (cm) distribution contribution from (a) ice parcels that were present on 1 August 2013 and (b) ice parcels that formed between 1 August 2013 and 1 April 2014. The sum of these two panels yields the 1 April 2014 snow distribution plotted in Figure 3b‐LG. Panel (a) includes the 1 April 2014 NSIDC and OSI‐SAF ice‐age extent boundaries that surround the multiyear ice (MYI) in the simulation domain. The OSI‐SAF product does not extend beyond 87°N latitude, so their ice‐age extent boundary is not plotted above that latitude.
Figure 9
Figure 9
(a) Total volume of superimposed ice on 1 August, 1981–2018, and (b) total snow volume on 1 August, 1981–2018, for the MERRA‐2 and ERA5 simulations. The carryover of snow from 1 year to the next is negligible in all years, for both atmospheric forcing data sets. There are significant differences in superimposed ice and snow carryover between the MERRA‐2 and ERA5 simulations.
Figure 10
Figure 10
MERRA‐2 results on 1 August 1989 (the date of maximum superimposed‐ice and snow‐depth volumes presented in Figure 9). (a) Superimposed ice distribution (cm) and (b) snow depth distribution (cm).
Figure 11
Figure 11
Domain (ice‐covered area) averaged 2‐m air temperature for the MERRA‐2 and ERA5 atmospheric forcing data. The period between when the air temperature rises above freezing, and 1 August, is approximately 2 weeks less for MERRA‐2 than ERA5 (5 and 7 weeks, respectively). This generally longer snowmelt period for ERA5 means the superimposed ice and snow on 1 August are significantly less in the ERA5 simulation.
Figure 12
Figure 12
(a) SnowModel‐LG simulated snow depth across the horizontal black line plotted in Figure 3b‐LG. (b) Semivariogram analysis (solid red dots) of the spatial length scale associated with the snow depth distribution in (a). The black line is a spherical model fit through the analysis points (e.g., Liston et al., 2018). The calculated range, or length scale, of the snow depth distribution features in (a) is 130 km.
Figure 13
Figure 13
Observed and SnowModel‐LG snow depth relative frequency histograms of 5 cm depth bins (0–5, 5–10 cm, etc.; markers sum to 1.0) over the OIB flight lines, gridded to the 25 × 25‐km EASE grid, on 1 April 2014. (a) With no ice motion (from Figure 3b‐NoMo), and (b) with ice motion (from Figure 3b‐LG).
Figure 14
Figure 14
(a) CryoVEx 2017 snow measurement transect (colored circles; Haas et al., 2017) and SnowModel‐LG outputs (colored grid cells) for an area north of Greenland. Included is a black line showing the shear zone identified by Haas et al. (2017). The SnowModel‐LG data were averaged over the CryoVEx observing period, 11–18 April 2017. The two CryoVEx observation sites that are aligned with the shear zone were separated in the plot to improve clarity. (b) Probability distributions for the CryoVEx observations (n = 10,901) and the SnowModel‐LG parcels (MERRA‐2, n = 54; ERA5, n = 54) roughly coincident with the CryoVEx circles in (b). The MERRA‐2 and ERA5 lines in the histogram were offset by one line‐width to prevent overlap.
Figure C1
Figure C1
Effective thermal conductivity variation with snow density for wind slab (top black line; assumed grain diameter = 0.1 to 0.5 mm) and fully developed depth hoar (bottom black line; assumed grain diameter = 5.0 mm), and grain diameters in 0.5 mm increments between these two extremes (gray lines). Adapted from Sturm et al. (1997).

References

    1. Aaboe, S. , Breivik, L.‐A. , Sørensen, A. , Eastwood, S. , & Lavergne, T. (2018). Global sea ice edge and type product user's manual OSI‐402‐c & OSI‐403‐c version 2.3, EUMETSAT. Retrieved from http://osisaf.met.no/docs/osisaf_cdop3_ss2_pum_sea-ice-edge-type_v2p3.pdf
    1. Anderson, E. A. (1976). A point energy and mass balance model of a snow cover (NOAA, Technical Report NWS 19) (pp. 1–150).
    1. Barrett, A. P. , Stroeve, J. C. , & Serreze, M. C. (2020). Arctic Ocean precipitation from atmospheric reanalyses and comparisons with North Pole drifting station records. Journal of Geophysical Research: Oceans, 125, e2019JC015415 10.1029/2019JC015415 - DOI
    1. Benson, C. S. , & Sturm, M. (1993). Structure and wind transport of seasonal snow on the Arctic slope of Alaska. Annals of Glaciology, 18, 261–267. 10.3189/S0260305500011629 - DOI
    1. Blanchard‐Wrigglesworth, E. , Webster, M. , Farrell, S. , & Bitz, C. M. (2018). Reconstruction of Arctic snow on sea ice. Journal of Geophysical Research: Oceans, 123, 3588–3602. 10.1002/2017JC013364 - DOI

LinkOut - more resources