. 2020 Oct 10:7:101093.
doi: 10.1016/j.mex.2020.101093. eCollection 2020.

Uncovering High-dimensional Structures of Projections from Dimensionality Reduction Methods

Affiliations

Uncovering High-dimensional Structures of Projections from Dimensionality Reduction Methods

Michael C Thrun et al. MethodsX. .

Abstract

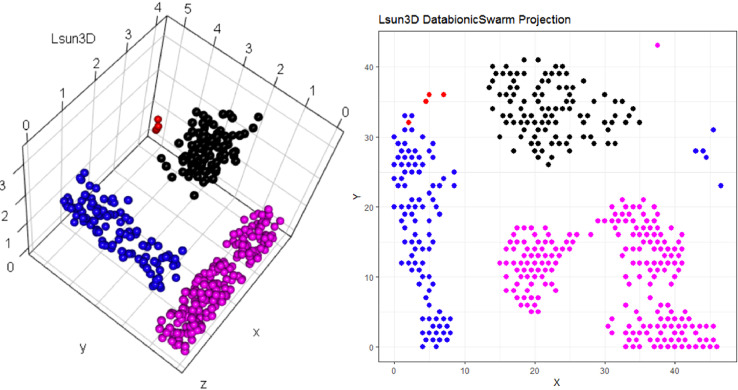
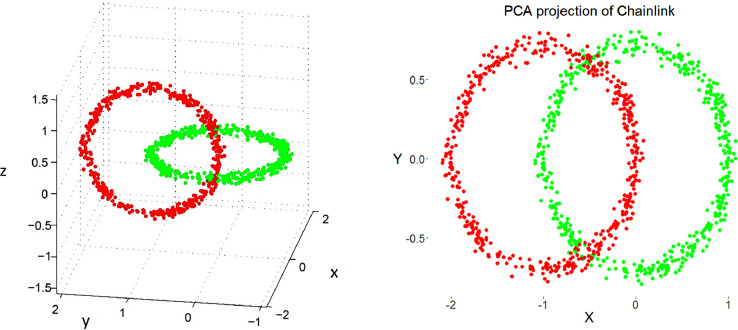
Projections are conventional methods of dimensionality reduction for information visualization used to transform high-dimensional data into low dimensional space. If the projection method restricts the output space to two dimensions, the result is a scatter plot. The goal of this scatter plot is to visualize the relative relationships between high-dimensional data points that build up distance and density-based structures. However, the Johnson-Lindenstrauss lemma states that the two-dimensional similarities in the scatter plot cannot coercively represent high-dimensional structures. Here, a simplified emergent self-organizing map uses the projected points of such a scatter plot in combination with the dataset in order to compute the generalized U-matrix. The generalized U-matrix defines the visualization of a topographic map depicting the misrepresentations of projected points with regards to a given dimensionality reduction method and the dataset.•The topographic map provides accurate information about the high-dimensional distance and density based structures of high-dimensional data if an appropriate dimensionality reduction method is selected.•The topographic map can uncover the absence of distance-based structures.•The topographic map reveals the number of clusters in a dataset as the number of valleys.

Keywords: Data visualization; Dimensionality reduction; Projection methods; Self-organizing maps; Unsupervised neural networks.


Conflict of interest statement

None.

Figures

Image, graphical abstract
Graphical abstract
Listing 1
Listing 1
Lsun3D data set and DBS projection [Thrun/Ultsch, 2020]. The projection does not indicate which projected points are similar to each other with regards to the high-dimensional structures. The projected points at the top are in Figure 2 at the bottom on the projected points on the left are in Figure 2 on the right.
Fig. 1
Fig. 1
Topographic map of the projection shows a high-dimensional structures which corresponds to the prior classification of Lsund3D. The four Outliers, labeled in red, lie either on a volcano or a high mountain. The borders of the scatter plot in Figure 1 (right), which divide the blue cluster in two parts, are ignored.
Fig. 2
Fig. 2
Chainlink data set (right) and PCA projection. The projection suffers from local errors in two small areas around a low number of points, but the projection is unable to visualize them.
Fig. 3
Fig. 3
Topographic map of the PCA projection of the Chainlink data set. The errors of the projection are clearly visible. Contrary to Figure 1 and 2, the borders of the scatter plot are visualized as hills in the topographic map showing that points on the borders are far away from each other.
Fig. 4
Fig. 4
Zoomed-in view of the misrepresentation of the relative relationship between the high-dimensional points (structures) of the Chainlink dataset in the PCA projection.
Fig. 5
Fig. 5
Left: topographic map of the normalized generalized U-matrix using the DBS projection module [Thrun/Ultsch, 2020] visualizes the distance-based structures of 7447 dimensions. Each point represents a patient colored by their diagnosis. Patients with the same diagnosis lie in the same valley. Right: topographic map of generalized U-matrix using the DBS projection module [Thrun/Ultsch, 2020] visualizes the absence of distance-based structures for the Golfball dataset (see Data in Brief article). No valleys are visible and colored points are not separated by watersheds of hills and mountain ranges.
Fig. 6
Fig. 6
Listing 1: sESOM pseudocode algorithm implements a stepwise iteration from the maximum radius Rmax which is given by the lattice size (Rmax = C/6) stepwise with one per step and down to 1. w´(m_k) indicates that the prototype w(m_k) of neuron m_k is modified by Eq. 7 Additionally, the search for a new best matching unit still is used and these prototypes may change during one iteration. The predefined prototypes are reset to the weights of their corresponding high-dimensional data points after each iteration.

References

    1. Cheng Y. Convergence and ordering of Kohonen's batch map. Neural Comput. 1997;9(8):1667–1676.
    1. Colorimetry C.I.E, Vol., CIE Publication,Central Bureau of the CIE, Vienna, 2004.
    1. Cottrell Marie, de Bodz Eric. ESANN. Vol. 96. Ciaco; Bruges, Belgium: 1996. A Kohonen map representation to avoid misleading interpretations.
    1. Cottrell M., Olteanu M., Rossi F., Villa-Vialaneix N. Advances in Self-Organizing Maps and Learning Vector Quantization. Springer; 2016. Theoretical and applied aspects of the self-organizing maps; pp. 3–26.
    1. Dasgupta S., Gupta A. An elementary proof of a theorem of Johnson and Lindenstrauss. Random Struct. Algorithms. 2003;22(1):60–65.

LinkOut - more resources