

Perturbations of Metabolomic Profiling of Spleen From Rats Infected With Clonorchis sinensis Determined by LC-MS/MS Method
- PMID: 33134312
- PMCID: PMC7574862
- DOI: 10.3389/fmolb.2020.561641
Perturbations of Metabolomic Profiling of Spleen From Rats Infected With Clonorchis sinensis Determined by LC-MS/MS Method
Abstract
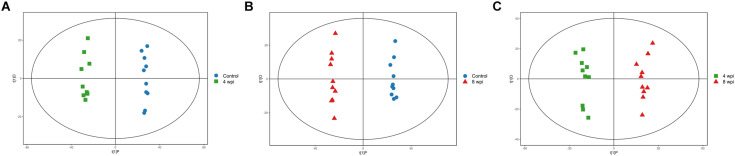
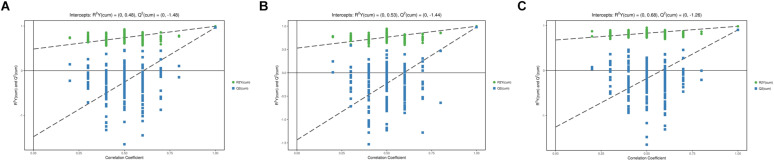
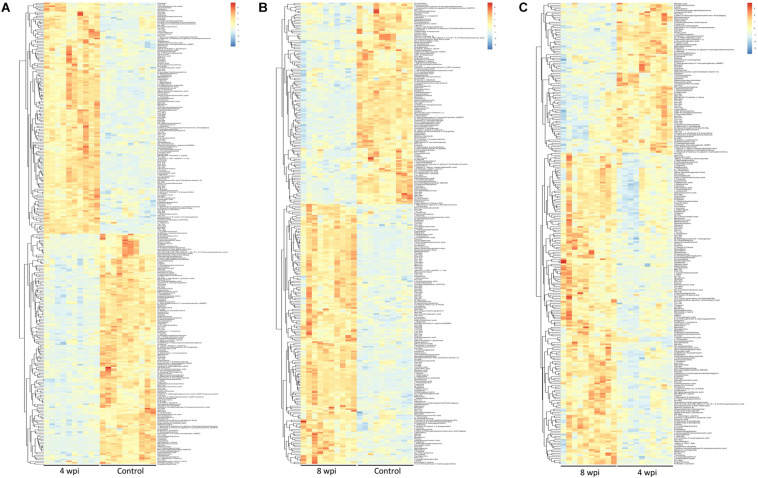
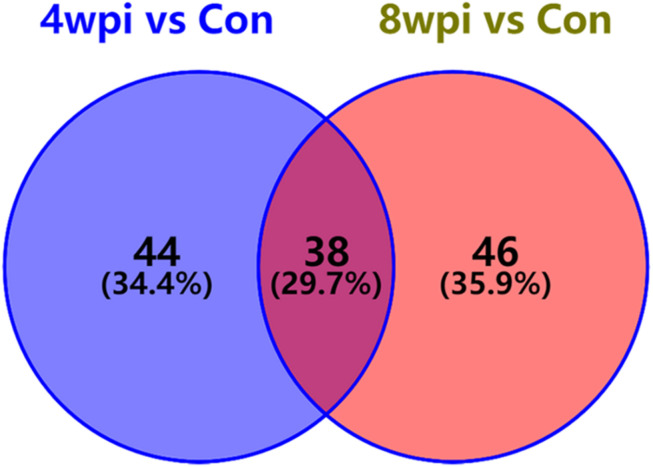
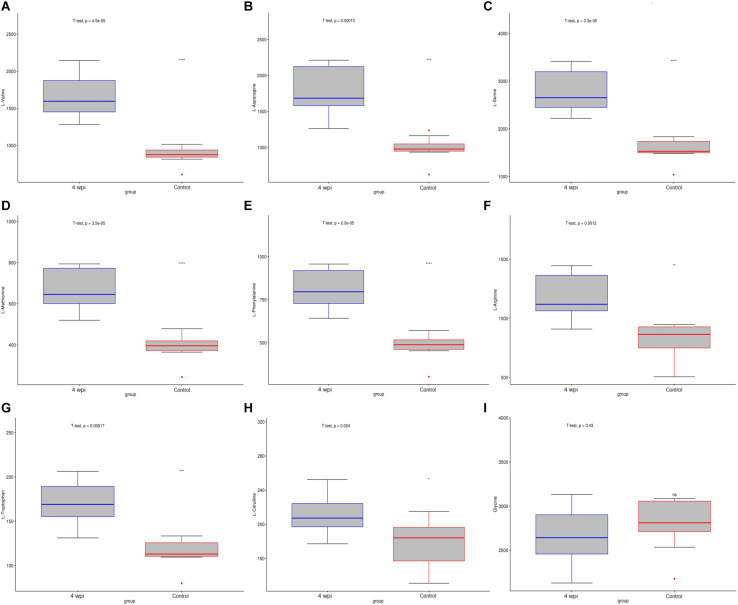
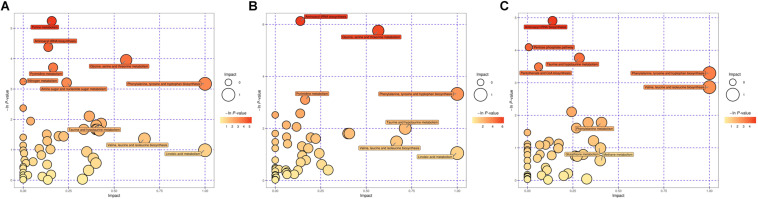
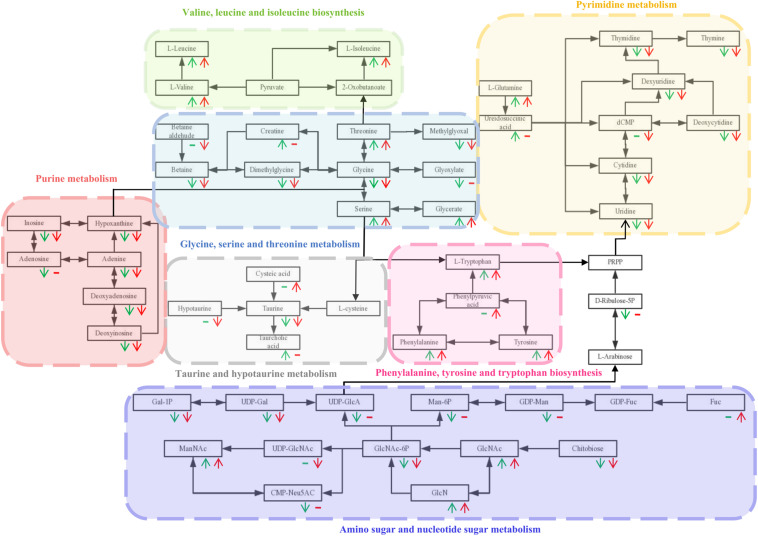
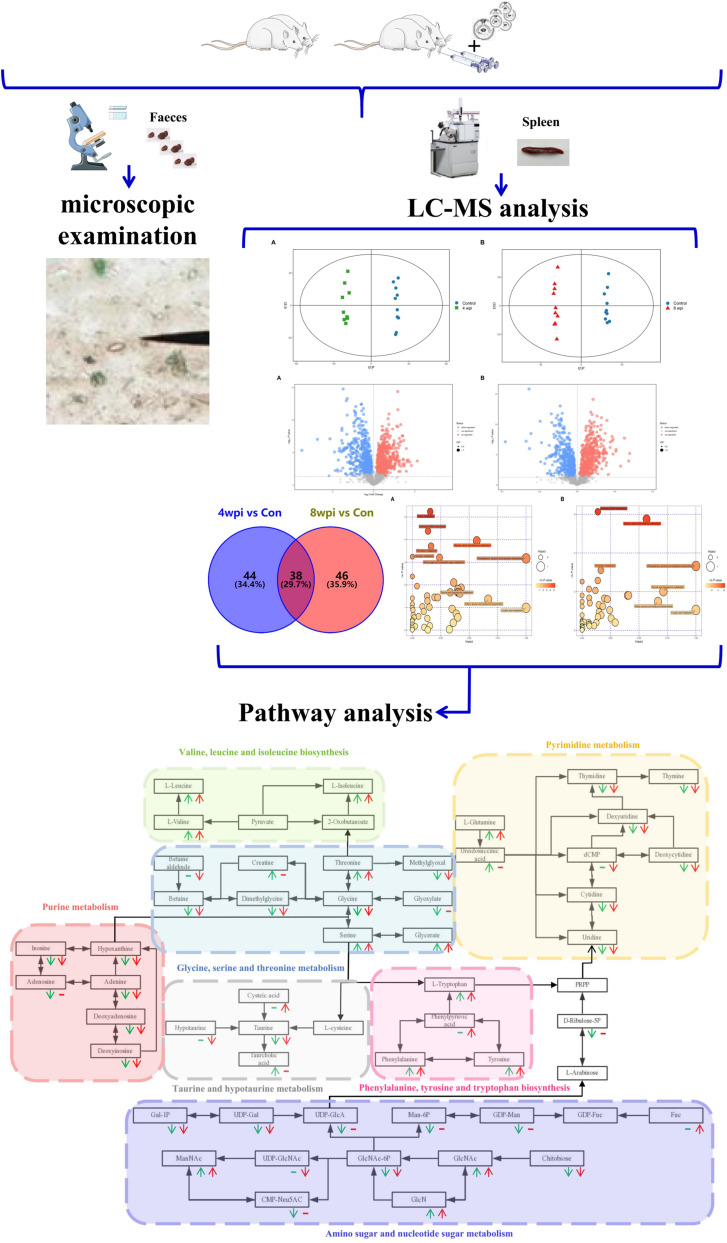
Clonorchiasis is an important zoonotic parasitic disease worldwide. In view of the fact that parasite infection affects host metabolism, and there is an intricate relationship between metabolism and immunity. Metabolic analysis of the spleen could be helpful for understanding the pathophysiological mechanisms in clonorchiasis. A non-targeted ultra high performance liquid tandem chromatography quadrupole time of flight mass spectrometry (UHPLC-QTOF MS) approach was employed to investigate the metabolic profiles of spleen in rats at 4 and 8 weeks post infection with Clonorchis sinensis (C. sinensis). Then a targeted ultra-high performance liquid chromatography multiple reaction monitoring mass spectrometry (UHPLC-MRM-MS/MS) approach was used to further quantify amino acid metabolism. Multivariate data analysis methods, such as principal components analysis and orthogonal partial least squares discriminant analysis, were used to identify differential metabolites. Finally, a total of 396 and 242 significant differential metabolites were identified in ESI+ and ESI- modes, respectively. These metabolites included amino acids, nucleotides, carboxylic acids, lipids and carbohydrates. There were 38 significantly different metabolites shared in the two infected groups compared with the control group through the Venn diagram. The metabolic pathways analysis revealed that pyrimidine metabolism, aminoacyl-tRNA biosynthesis, purine metabolism and phenylalanine, tyrosine and tryptophan biosynthesis were significantly enriched in differential metabolites, which was speculated to be related to the disease progression of clonorchiasis. Furthermore, 15 amino acids screened using untargeted profiling can be accurately quantified and identifed by targeted metabolomics during clonrochiasis. These results preliminarily revealed the perturbations of spleen metabolism in clonorchiasis. Meanwhile, this present study supplied new insights into the molecular mechanisms of host-parasite interactions.
Keywords: Clonorchis sinensis; infection; metabolic pathway; non-targeted metabolomics; spleen.
Copyright © 2020 Zhang, Hu, Chen, Sun, Gao, Duan, Liu and Han.
Figures

Similar articles
-
Serum metabolic profiling of rats infected with Clonorchis sinensis using LC-MS/MS method.Front Cell Infect Microbiol. 2023 Jan 6;12:1040330. doi: 10.3389/fcimb.2022.1040330. eCollection 2022. Front Cell Infect Microbiol. 2023. PMID: 36683702 Free PMC article.
-
Comparative analysis of bile metabolic profile in patients with biliary obstruction complicated by Clonorchis sinensis infection.Front Cell Infect Microbiol. 2023 Sep 12;13:1254016. doi: 10.3389/fcimb.2023.1254016. eCollection 2023. Front Cell Infect Microbiol. 2023. PMID: 37868349 Free PMC article.
-
Exploration of the Amino Acid Metabolic Profiling and Pathway in Clonorchis sinensis-Infected Rats Revealed by the Targeted Metabolomic Analysis.Vector Borne Zoonotic Dis. 2024 Jul;24(7):428-438. doi: 10.1089/vbz.2023.0059. Epub 2024 Apr 4. Vector Borne Zoonotic Dis. 2024. PMID: 38574253
-
Screening of synthetic PDE-5 inhibitors and their analogues as adulterants: analytical techniques and challenges.J Pharm Biomed Anal. 2014 Jan;87:176-90. doi: 10.1016/j.jpba.2013.04.037. Epub 2013 May 6. J Pharm Biomed Anal. 2014. PMID: 23721687 Review.
-
Androgen glucuronides analysis by liquid chromatography tandem-mass spectrometry: could it raise new perspectives in the diagnostic field of hormone-dependent malignancies?J Chromatogr B Analyt Technol Biomed Life Sci. 2013 Dec 1;940:24-34. doi: 10.1016/j.jchromb.2013.09.022. Epub 2013 Sep 27. J Chromatogr B Analyt Technol Biomed Life Sci. 2013. PMID: 24140653 Review.
Cited by
-
Identification of serum biomarkers for cystic echinococcosis in sheep through untargeted metabolomic analysis using LC-MS/MS technology.Parasit Vectors. 2024 Dec 30;17(1):547. doi: 10.1186/s13071-024-06599-6. Parasit Vectors. 2024. PMID: 39736799 Free PMC article.
-
Serum metabolic profiling of rats infected with Clonorchis sinensis using LC-MS/MS method.Front Cell Infect Microbiol. 2023 Jan 6;12:1040330. doi: 10.3389/fcimb.2022.1040330. eCollection 2022. Front Cell Infect Microbiol. 2023. PMID: 36683702 Free PMC article.
-
A Species-Specific Strategy for the Identification of Hemocoagulase Agkistrodon halys pallas Based on LC-MS/MS-MRM.Front Mol Biosci. 2022 May 30;9:831293. doi: 10.3389/fmolb.2022.831293. eCollection 2022. Front Mol Biosci. 2022. PMID: 35712351 Free PMC article.
-
Comparative analysis of bile metabolic profile in patients with biliary obstruction complicated by Clonorchis sinensis infection.Front Cell Infect Microbiol. 2023 Sep 12;13:1254016. doi: 10.3389/fcimb.2023.1254016. eCollection 2023. Front Cell Infect Microbiol. 2023. PMID: 37868349 Free PMC article.
-
Multiple biochemical indices and metabolomics of Clonorchis sinensis provide a novel interpretation of biomarkers.Parasit Vectors. 2022 May 19;15(1):172. doi: 10.1186/s13071-022-05290-y. Parasit Vectors. 2022. PMID: 35590378 Free PMC article.
References
-
- Cabeza-Cabrerizo M., van Blijswijk J., Wienert S., Heim D., Jenkins R. P., Chakravarty P., et al. (2019). Tissue clonality of dendritic cell subsets and emergency DCpoiesis revealed by multicolor fate mapping of DC progenitors. Sci. Immunol. 4:eaaw1941. 10.1126/sciimmunol.aaw1941 - DOI - PMC - PubMed
-
- Chandler J. D., Hu X., Ko E. J., Park S., Lee Y. T., Orr M., et al. (2016). Metabolic pathways of lung inflammation revealed by high-resolution metabolomics (HRM) of H1N1 influenza virus infection in mice. Am. J. Physiol. Regul. Integr. Comp. Physiol. 311 R906–R916. 10.1152/ajpregu.00298.2016 - DOI - PMC - PubMed
LinkOut - more resources
Full Text Sources