

Magnetic Resonance Imaging for Evaluation of Interstitial Fibrosis in Kidney Allografts
- PMID: 33134501
- PMCID: PMC7581173
- DOI: 10.1097/TXD.0000000000001009
Magnetic Resonance Imaging for Evaluation of Interstitial Fibrosis in Kidney Allografts
Abstract
Interstitial fibrosis (IF) is the common pathway of chronic kidney injury in various conditions. Magnetic resonance imaging (MRI) may be a promising tool for the noninvasive assessment of IF in renal allografts.
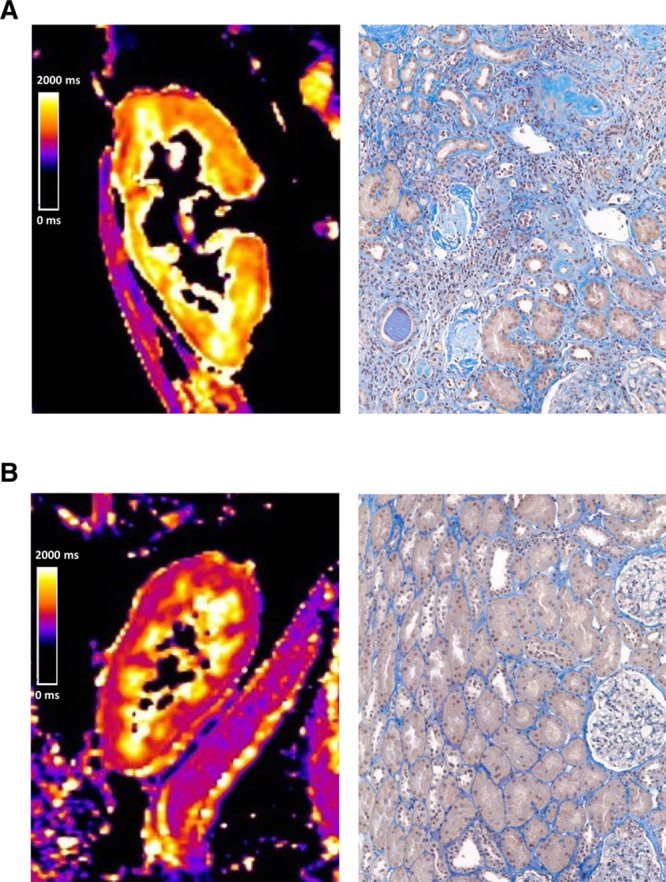
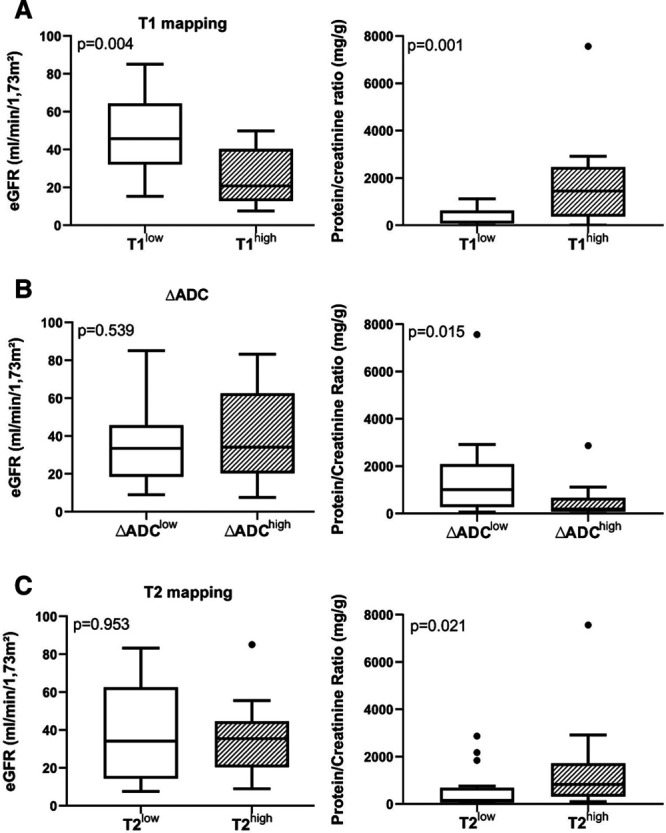
Methods: This prospective trial was primarily designed to investigate whether the results of T1-weighted MRI associate with the degree of IF. Thirty-two kidney transplant recipients were subjected to 1.5-Tesla MRI scans shortly before or after routine allograft biopsies. MRI parameters [T1 and T2 relaxation times; apparent diffusion coefficient (ADC)] were assessed for cortical and medullary sections.
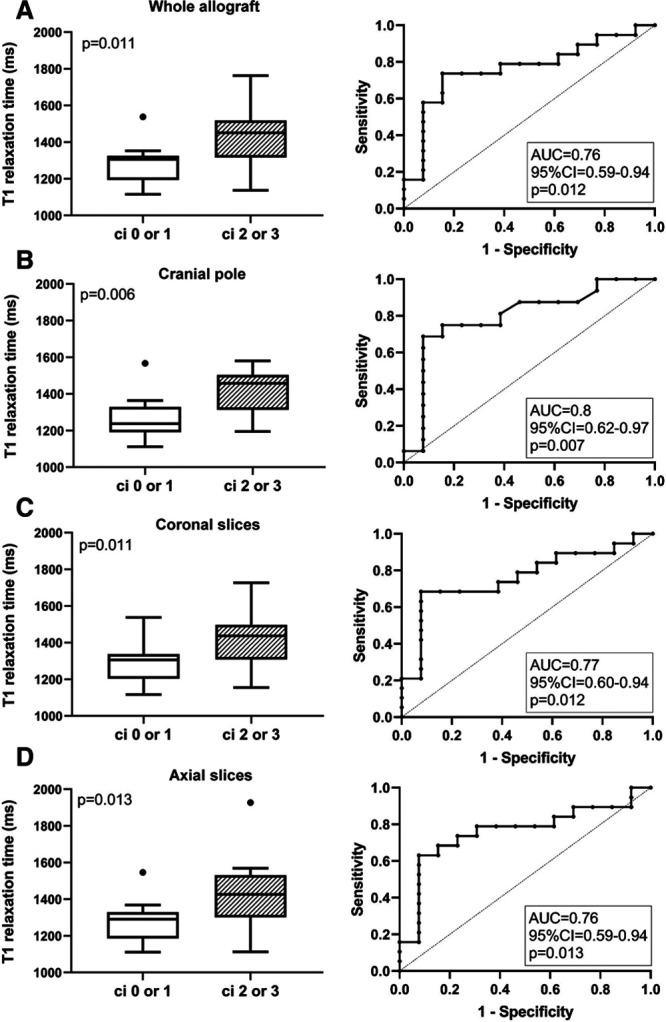
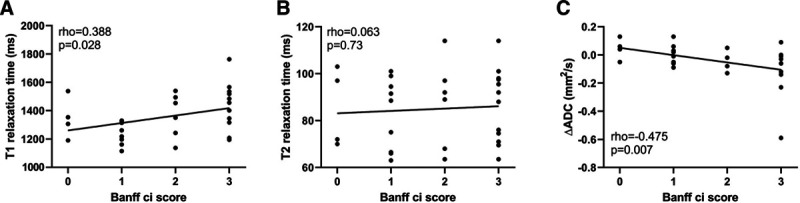
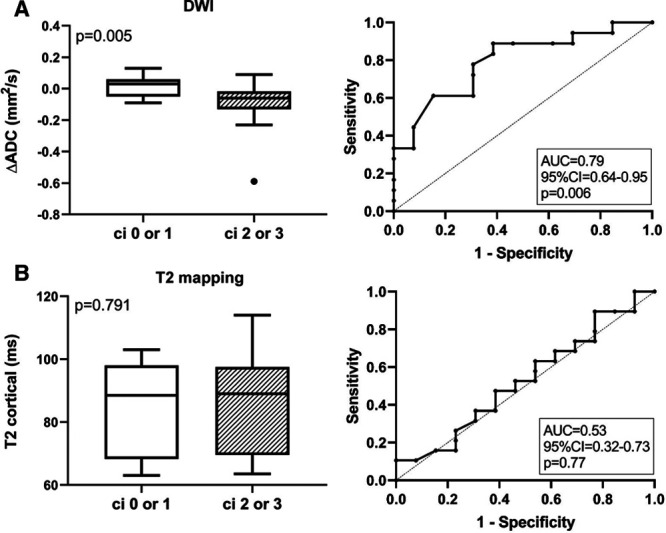
Results: Advanced IF (Banff ci score >1) was associated with higher cortical T1 (but not T2) values [1451 (median; interquartile range: 1331-1506) versus 1306 (1197-1321) ms in subjects with ci scores ≤1; P = 0.011; receiver operating characteristic area under the curve for prediction of ci > 1: 0.76]. In parallel, T1 values were associated with kidney function and proteinuria. There was also a relationship between IF and corticomedullary differences on ADC maps (receiver operating characteristic area under the curve for prediction of ci ≤ 1: 0.79).
Conclusions: Our results support the use of MRI for noninvasive assessment of allograft scarring. Future studies will have to clarify the role of T1 (and ADC) mapping as a surrogate endpoint reflecting the progression of chronic graft damage.
Copyright © 2020 The Author(s). Transplantation Direct. Published by Wolters Kluwer Health, Inc.
Conflict of interest statement
The authors declare no funding or conflicts of interest.
Figures
Similar articles
-
Combination of Functional Magnetic Resonance Imaging and Histopathologic Analysis to Evaluate Interstitial Fibrosis in Kidney Allografts.Clin J Am Soc Nephrol. 2019 Sep 6;14(9):1372-1380. doi: 10.2215/CJN.00020119. Epub 2019 Aug 15. Clin J Am Soc Nephrol. 2019. PMID: 31416890 Free PMC article.
-
Potential MRI Biomarkers for Predicting Kidney Function and Histological Damage in Transplanted Deceased Donor Kidney Recipients.J Clin Med. 2025 Feb 18;14(4):1349. doi: 10.3390/jcm14041349. J Clin Med. 2025. PMID: 40004881 Free PMC article.
-
Multiparametric magnetic resonance imaging shows promising results to assess renal transplant dysfunction with fibrosis.Kidney Int. 2020 Feb;97(2):414-420. doi: 10.1016/j.kint.2019.09.030. Epub 2019 Oct 30. Kidney Int. 2020. PMID: 31874802 Free PMC article.
-
Evaluation of interstitial fibrosis in chronic kidney disease by multiparametric functional MRI and histopathologic analysis.Eur Radiol. 2023 Jun;33(6):4138-4147. doi: 10.1007/s00330-022-09329-7. Epub 2022 Dec 11. Eur Radiol. 2023. PMID: 36502460
-
Multiparametric MRI: can we assess renal function differently?Clin Kidney J. 2024 Nov 19;18(1):sfae365. doi: 10.1093/ckj/sfae365. eCollection 2025 Jan. Clin Kidney J. 2024. PMID: 40008350 Free PMC article. Review.
Cited by
-
Histopathological correlations of CT-based radiomics imaging biomarkers in native kidney biopsy.BMC Med Imaging. 2024 Sep 27;24(1):256. doi: 10.1186/s12880-024-01434-x. BMC Med Imaging. 2024. PMID: 39333936 Free PMC article.
-
The Possibilities of Multiparametric Magnetic Resonance Imaging to Reflect Functional and Structural Graft Changes 1 Year After Kidney Transplantation.Medicina (Kaunas). 2025 Jul 13;61(7):1268. doi: 10.3390/medicina61071268. Medicina (Kaunas). 2025. PMID: 40731897 Free PMC article.
-
Magnetic Resonance Imaging in Clinical Trials of Diabetic Kidney Disease.J Clin Med. 2023 Jul 11;12(14):4625. doi: 10.3390/jcm12144625. J Clin Med. 2023. PMID: 37510740 Free PMC article. Review.
-
Non-invasive Assessment of Subclinical Renal Parenchymal Changes in Chronic Hepatitis B Virus By T1 Mapping Magnetic Resonance Imaging.Balkan Med J. 2022 Mar 14;39(2):115-120. doi: 10.4274/balkanmedj.galenos.2021.2021-6-133. Balkan Med J. 2022. PMID: 35330558 Free PMC article.
-
Renal MRI: From Nephron to NMR Signal.J Magn Reson Imaging. 2023 Dec;58(6):1660-1679. doi: 10.1002/jmri.28828. Epub 2023 May 26. J Magn Reson Imaging. 2023. PMID: 37243378 Free PMC article. Review.
References
-
- Nicholson ML, McCulloch TA, Harper SJ, et al. Early measurement of interstitial fibrosis predicts long-term renal function and graft survival in renal transplantation. Br J Surg. 1996; 83:1082–1085. doi:10.1002/bjs.1800830813 - PubMed
-
- Nankivell BJ, Fenton-Lee CA, Kuypers DR, et al. Effect of histological damage on long-term kidney transplant outcome. Transplantation. 2001; 71:515–523. doi:10.1097/00007890-200102270-00006 - PubMed
LinkOut - more resources
Full Text Sources
Miscellaneous
