

POLR1C variants dysregulate splicing and cause hypomyelinating leukodystrophy
- PMID: 33134519
- PMCID: PMC7577547
- DOI: 10.1212/NXG.0000000000000524
POLR1C variants dysregulate splicing and cause hypomyelinating leukodystrophy
Abstract
Objective: To further clarify the molecular pathogenesis of RNA polymerase III (Pol III)-related leukodystrophy caused by biallelic POLR1C variants at a cellular level and potential effects on its downstream genes.
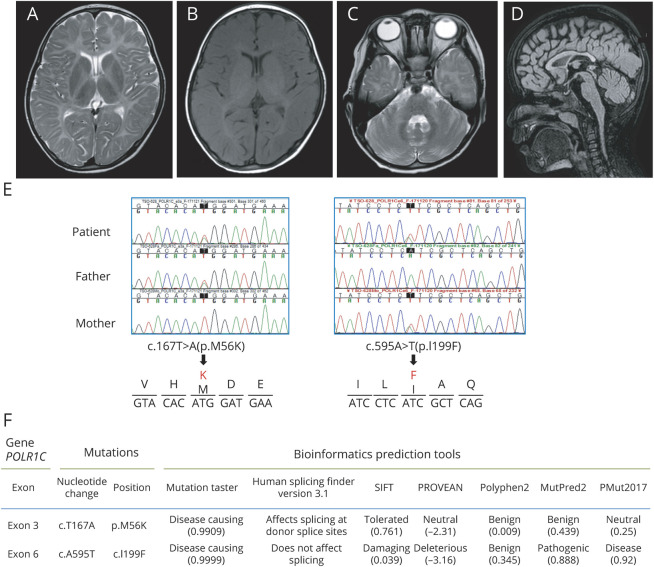
Methods: Exome analysis and molecular functional studies using cell expression and long-read sequencing analyses were performed on 1 family with hypomyelinating leukodystrophy showing no clinical and MRI findings characteristic of Pol III-related leukodystrophy other than hypomyelination.
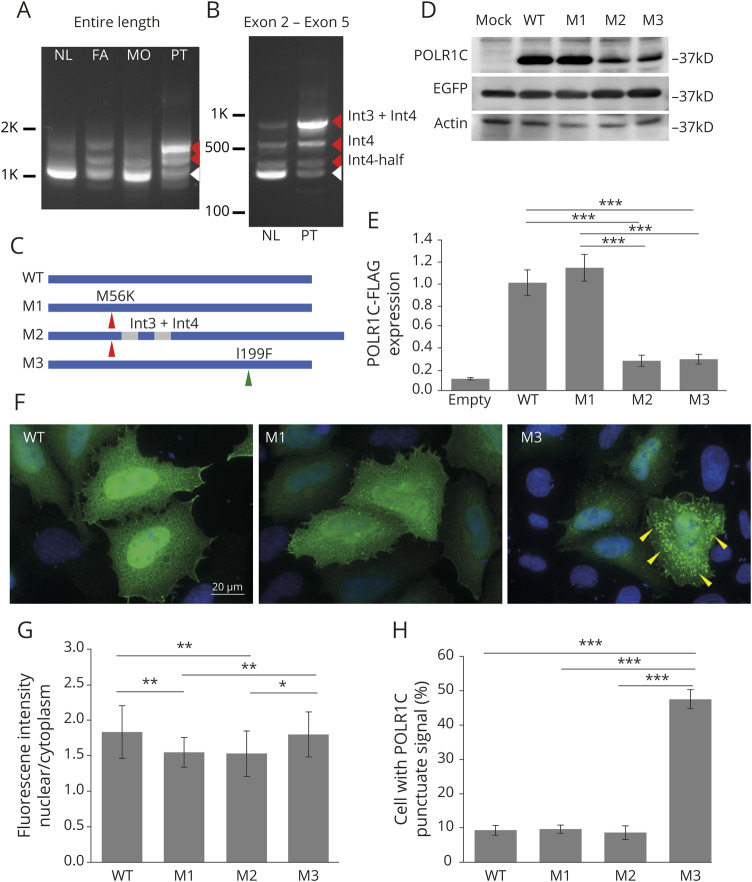
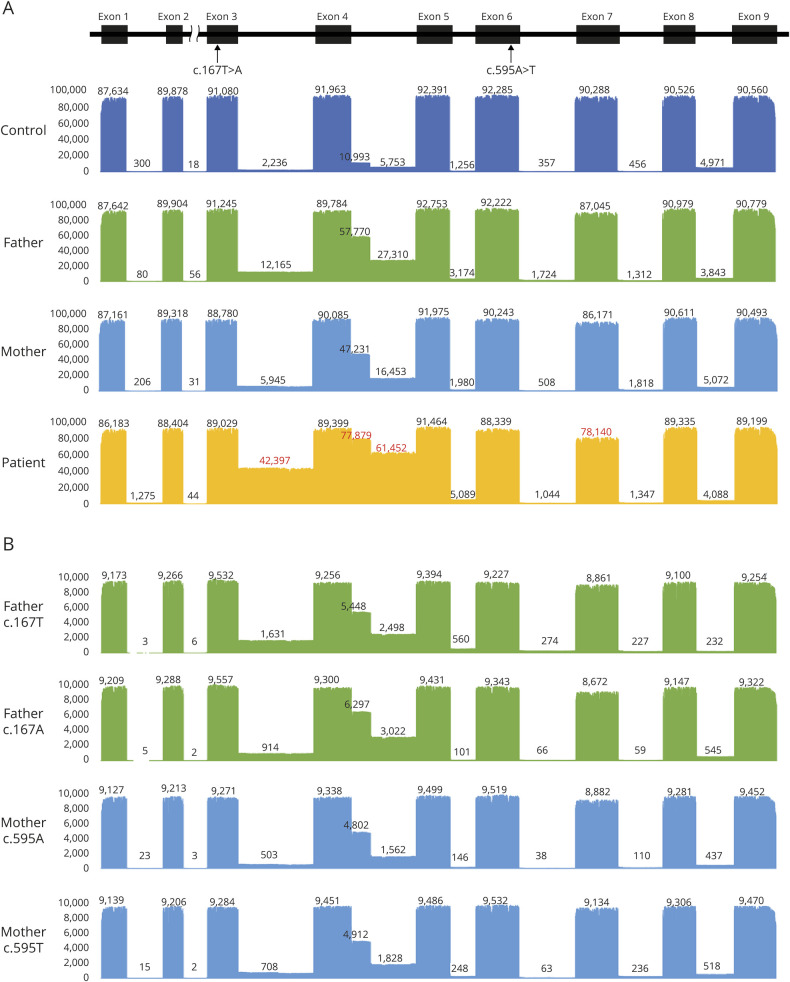
Results: Biallelic novel POLR1C alterations, c.167T>A, p.M56K and c.595A>T, p.I199F, were identified as causal variants. Functional analyses showed that these variants not only resulted in altered protein subcellular localization and decreased protein expression but also caused abnormal inclusion of introns in 85% of the POLR1C transcripts in patient cells. Unexpectedly, allelic segregation analysis in each carrier parent revealed that each heterozygous variant also caused the inclusion of introns on both mutant and wild-type alleles. These findings suggest that the abnormal splicing is not direct consequences of the variants, but rather reflect the downstream effect of the variants in dysregulating splicing of POLR1C, and potentially other target genes.
Conclusions: The lack of characteristic clinical findings in this family confirmed the broad clinical spectrum of Pol III-related leukodystrophy. Molecular studies suggested that dysregulation of splicing is the potential downstream pathomechanism for POLR1C variants.
Copyright © 2020 The Author(s). Published by Wolters Kluwer Health, Inc. on behalf of the American Academy of Neurology.
Figures
Similar articles
-
Biallelic pathogenic variants in POLR3D alter tRNA transcription and cause a hypomyelinating leukodystrophy: A case report.Front Neurol. 2023 Oct 13;14:1254140. doi: 10.3389/fneur.2023.1254140. eCollection 2023. Front Neurol. 2023. PMID: 37915380 Free PMC article.
-
Clinical spectrum of POLR3-related leukodystrophy caused by biallelic POLR1C pathogenic variants.Neurol Genet. 2019 Oct 30;5(6):e369. doi: 10.1212/NXG.0000000000000369. eCollection 2019 Dec. Neurol Genet. 2019. PMID: 32042905 Free PMC article.
-
POLR3-related leukodystrophy: How do mutations affecting RNA polymerase III subunits cause hypomyelination?Fac Rev. 2021 Feb 5;10:12. doi: 10.12703/r/10-12. eCollection 2021. Fac Rev. 2021. PMID: 33659930 Free PMC article. Review.
-
Next-Generation Sequencing Reveals Novel Homozygous Missense Variant c.934T > C in POLR1C Gene Causing Leukodystrophy and Hypomyelinating Disease.Front Pediatr. 2022 May 24;10:862722. doi: 10.3389/fped.2022.862722. eCollection 2022. Front Pediatr. 2022. PMID: 35685919 Free PMC article.
-
RNA Polymerase III Subunit Mutations in Genetic Diseases.Front Mol Biosci. 2021 Jul 30;8:696438. doi: 10.3389/fmolb.2021.696438. eCollection 2021. Front Mol Biosci. 2021. PMID: 34395528 Free PMC article. Review.
Cited by
-
Combined Genome, Transcriptome and Metabolome Analysis in the Diagnosis of Childhood Cerebellar Ataxia.Int J Mol Sci. 2021 Mar 15;22(6):2990. doi: 10.3390/ijms22062990. Int J Mol Sci. 2021. PMID: 33804237 Free PMC article.
-
Distinct Interaction Modes for the Eukaryotic RNA Polymerase Alpha-like Subunits.Mol Cell Biol. 2023;43(6):269-282. doi: 10.1080/10985549.2023.2210023. Epub 2023 May 24. Mol Cell Biol. 2023. PMID: 37222571 Free PMC article.
References
-
- Sasaki M, Takanashi J, Tada H, Sakuma H, Furushima W, Sato N. Diffuse cerebral hypomyelination with cerebellar atrophy and hypoplasia of the corpus callosum. Brain Dev 2009;31:582–587. - PubMed
-
- Bernard G, Vanderver A. POLR3-Related leukodystrophy. In: Adam MP, Ardinger HH, Pagon RA, et al., editors. GeneReview® [online]. Seattle: University of Washington, Seattle; 2012:1993-2020. Available at: ncbi.nlm.nih.gov/books/NBK99167/. Accessed April 24, 2020. - PubMed
LinkOut - more resources
Full Text Sources