. 2020 Oct 21:5:110.
doi: 10.12688/wellcomeopenres.15937.2. eCollection 2020.

A blueprint for the implementation of a validated approach for the detection of SARS-Cov2 in clinical samples in academic facilities

Affiliations

A blueprint for the implementation of a validated approach for the detection of SARS-Cov2 in clinical samples in academic facilities

Sushmita Sridhar et al. Wellcome Open Res. .

Abstract

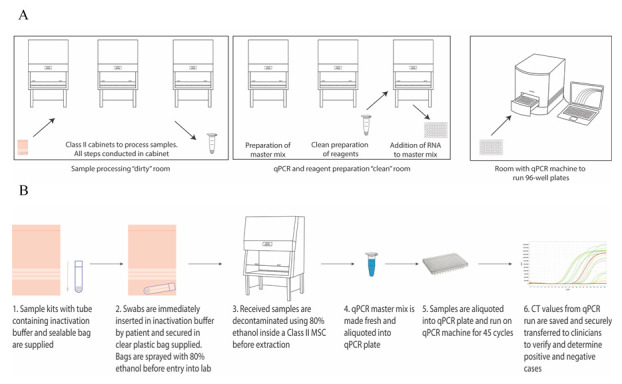
The COVID-19 pandemic is expanding at an unprecedented rate. As a result, diagnostic services are stretched to their limit, and there is a clear need for the provision of additional diagnostic capacity. Academic laboratories, many of which are closed due to governmental lockdowns, may be in a position to support local screening capacity by adapting their current laboratory practices. Here, we describe the process of developing a SARS-Cov2 diagnostic workflow in a conventional academic Containment Level 2 laboratory. Our outline includes simple SARS-Cov2 deactivation upon contact, the method for a quantitative real-time reverse transcriptase PCR detecting SARS-Cov2, a description of process establishment and validation, and some considerations for establishing a similar workflow elsewhere. This was achieved under challenging circumstances through the collaborative efforts of scientists, clinical staff, and diagnostic staff to mitigate to the ongoing crisis. Within 14 days, we created a validated COVID-19 diagnostics service for healthcare workers in our local hospital. The described methods are not exhaustive, but we hope may offer support to other academic groups aiming to set up something comparable in a short time frame.

Keywords: COVID-19; SARS-Cov2; diagnostic PCR; qPCR; sample workflow; validation.


Conflict of interest statement

No competing interests were disclosed.

Figures

Figure 1.
Figure 1.. Establishing positive and negative qRT-PCR control for SARS-Cov2.
( A) Amplification plot of cloned SARS-Cov2 template plasmid in 5 10-fold dilutions with FAM reporter. The x-axis displays the number of PCR cycles and the y-axis show the magnitude of normalized fluorescence signal generated by the reporter at each cycle during the PCR amplification in the form of ∆Rn. ( B) Amplification plot of cloned MS2 control from spiked test samples with ROX reporter. The x-axis displays the number of PCR cycles and the y-axis show the magnitude of normalized fluorescence signal generated by the reporter at each cycle during the PCR amplification in the form of ∆Rn. Data analysed using QuantStudio 6 and 7 Flex Realtime PCR System Software colours correspond to plate location.
Figure 2.
Figure 2.. Establishing a diagnostic workflow for qRT-PCR for SARS-Cov2.
( A) Diagram displaying the segregation of the “dirty”, “clean” and “amplification” rooms. Note the use of separate cabinets for the preparation of reagents in the “clean” room. Individuals working in the “dirty” or “amplification” rooms are unable to enter the “clean” room on the same working day. ( B) Diagram showing a suitable workflow of samples from swabbing to amplification to reporting.
Figure 3.
Figure 3.. Validating and introducing a qRT-PCR for SARS-Cov2.
( A) Amplification plot of SARS-Cov2 from clinical samples from known COVID-19 patients. Data generated following the entire process on blinded swabs. The x-axis displays the number of PCR cycles and the y-axis show the magnitude of normalized fluorescence signal generated by the reporter at each cycle during the PCR amplification in the form of ΔRn. ( B) Amplification plot of SARS-Cov2 from samples taken from healthcare workers on first day of screening. The x-axis displays the number of PCR cycles and the y-axis show the magnitude of normalized fluorescence signal generated by the reporter at each cycle during the PCR amplification in the form of ΔRn. Data analysed using QuantStudio 6 and 7 Flex Realtime PCR System Software, colours correspond to plate location.

Similar articles

Cited by

  • Rapid Detection of Antimicrobial Resistance Genes in Critically Ill Children Using a Custom TaqMan Array Card.
    Clark JA, Curran MD, Gouliouris T, Conway Morris A, Bousfield R, Navapurkar V, Kean IRL, Daubney E, White D, Baker S, Pathan N. Clark JA, et al. Antibiotics (Basel). 2023 Dec 5;12(12):1701. doi: 10.3390/antibiotics12121701. Antibiotics (Basel). 2023. PMID: 38136735 Free PMC article.
  • A2B-COVID: A Tool for Rapidly Evaluating Potential SARS-CoV-2 Transmission Events.
    Illingworth CJR, Hamilton WL, Jackson C, Warne B, Popay A, Meredith L, Hosmillo M, Jahun A, Fieldman T, Routledge M, Houldcroft CJ, Caller L, Caddy S, Yakovleva A, Hall G, Khokhar FA, Feltwell T, Pinckert ML, Georgana I, Chaudhry Y, Curran M, Parmar S, Sparkes D, Rivett L, Jones NK, Sridhar S, Forrest S, Dymond T, Grainger K, Workman C, Gkrania-Klotsas E, Brown NM, Weekes MP, Baker S, Peacock SJ, Gouliouris T, Goodfellow I, Angelis D, Török ME. Illingworth CJR, et al. Mol Biol Evol. 2022 Mar 2;39(3):msac025. doi: 10.1093/molbev/msac025. Mol Biol Evol. 2022. PMID: 35106603 Free PMC article.
  • SARS-CoV-2 and the COVID-19 disease: a mini review on diagnostic methods.
    Oliveira BA, Oliveira LC, Sabino EC, Okay TS. Oliveira BA, et al. Rev Inst Med Trop Sao Paulo. 2020 Jun 29;62:e44. doi: 10.1590/S1678-9946202062044. eCollection 2020. Rev Inst Med Trop Sao Paulo. 2020. PMID: 32609256 Free PMC article. Review.
  • Evaluation of sample pooling using the SAMBA II SARS-CoV-2 test.
    Heaney K, Ritchie AV, Henry R, Harvey AJ, Curran MD, Allain JP, Lee HH. Heaney K, et al. J Virol Methods. 2022 Jan;299:114340. doi: 10.1016/j.jviromet.2021.114340. Epub 2021 Oct 22. J Virol Methods. 2022. PMID: 34695480 Free PMC article.
  • Effective control of SARS-CoV-2 transmission between healthcare workers during a period of diminished community prevalence of COVID-19.
    Jones NK, Rivett L, Sparkes D, Forrest S, Sridhar S, Young J, Pereira-Dias J, Cormie C, Gill H, Reynolds N, Wantoch M, Routledge M, Warne B, Levy J, Córdova Jiménez WD, Samad FNB, McNicholas C, Ferris M, Gray J, Gill M; CITIID-NIHR COVID-19 BioResource Collaboration; Curran MD, Fuller S, Chaudhry A, Shaw A, Bradley JR, Hannon GJ, Goodfellow IG, Dougan G, Smith KG, Lehner PJ, Wright G, Matheson NJ, Baker S, Weekes MP. Jones NK, et al. Elife. 2020 Jun 19;9:e59391. doi: 10.7554/eLife.59391. Elife. 2020. PMID: 32558644 Free PMC article.

References

    1. Verity R, Okell LC, Dorigatti I, et al. : Estimates of the severity of coronavirus disease 2019: a model-based analysis. Lancet Infect Dis. 2020;20(6):669–677. 10.1016/S1473-3099(20)30243-7 - DOI - PMC - PubMed
    1. Eurosurveillance Editorial Team: Updated rapid risk assessment from ECDC on the novel coronavirus disease 2019 (COVID-19) pandemic: increased transmission in the EU/EEA and the UK. Euro Surveill. 2020;25(10):2003121. 10.2807/1560-7917.ES.2020.25.10.2003121 - DOI - PMC - PubMed
    1. Willan J, King AJ, Jeffery K, et al. : Challenges for NHS hospitals during covid-19 epidemic. BMJ.BMJ Publishing Group;2020;368:m1117. 10.1136/bmj.m1117 - DOI - PubMed
    1. Bedford J, Enria D, Giesecke J, et al. : COVID-19: towards controlling of a pandemic. Lancet. 2020;395(10229):1015–1018. 10.1016/S0140-6736(20)30673-5 - DOI - PMC - PubMed
    1. Tang YW, Schmitz JE, Persing DH, et al. : The Laboratory Diagnosis of COVID-19: Current Issues and Challenges. J Clin Microbiol. 2020;58(6):e00512-20. 10.1128/JCM.00512-20 - DOI - PMC - PubMed