. 2020 Oct 5:N/A:1-57.
doi: 10.1038/s41893-020-00614-1.

Criteria pollutant impacts of volatile chemical products informed by near-field modeling

Affiliations

Criteria pollutant impacts of volatile chemical products informed by near-field modeling

Momei Qin et al. Nat Sustain. .

Abstract

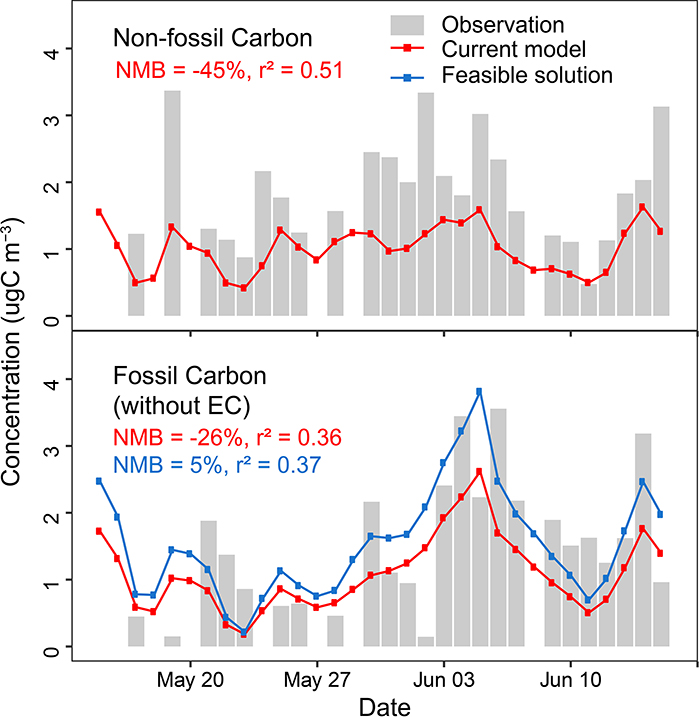
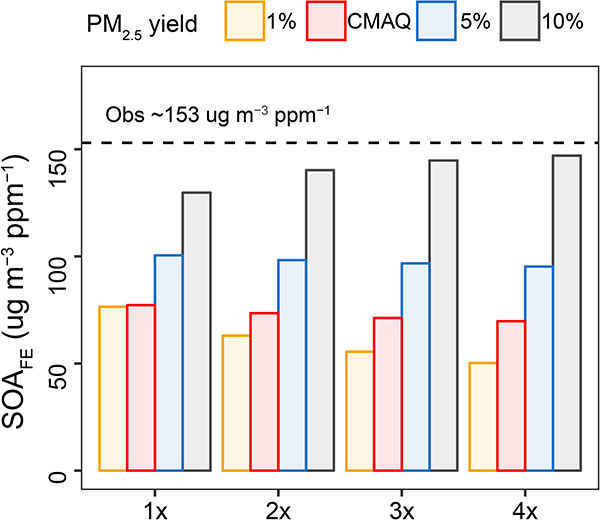
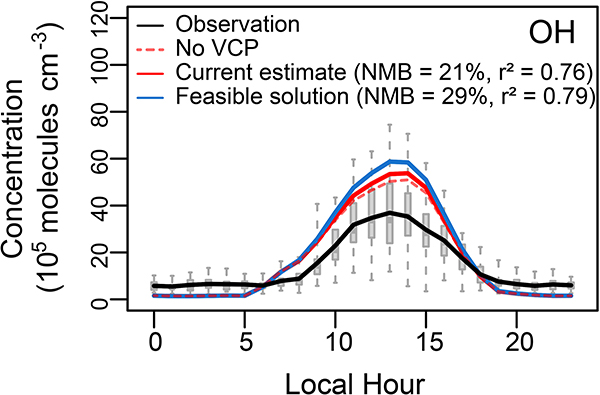
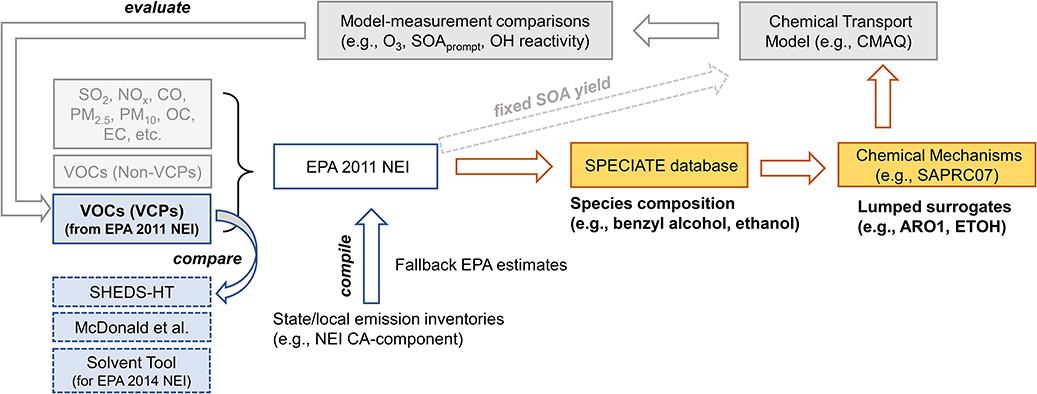
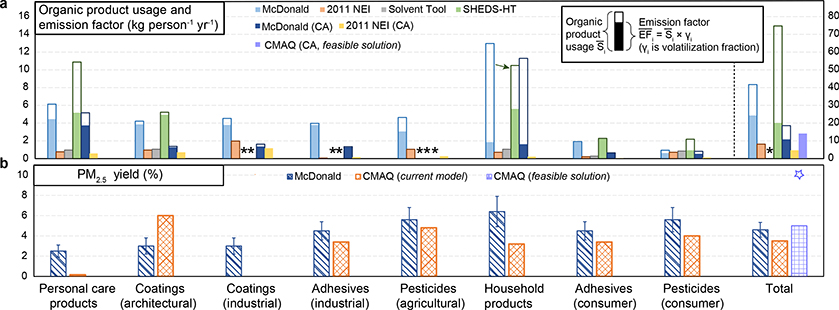
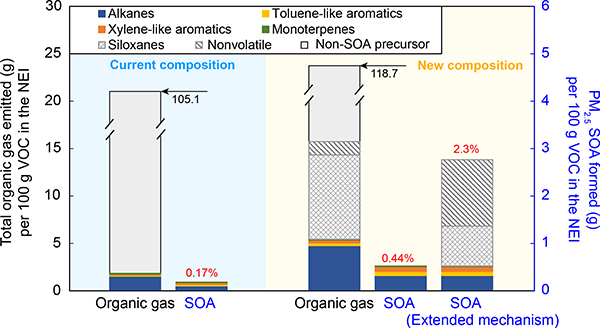
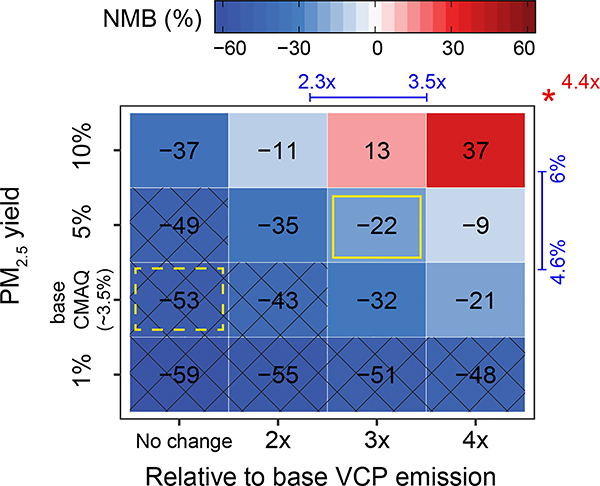
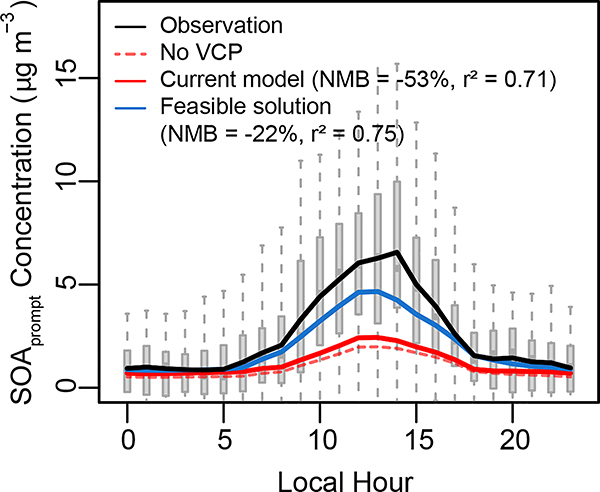
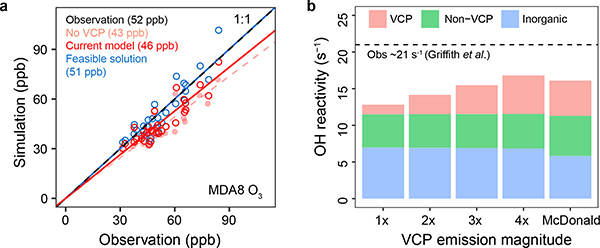
Consumer, industrial, and commercial product usage is a source of exposure to potentially hazardous chemicals. In addition, cleaning agents, personal care products, coatings, and other volatile chemical products (VCPs), evaporate and react in the atmosphere producing secondary pollutants. Here, we show high air emissions from VCP usage (≥ 14 kg person-1 yr-1, at least 1.7× higher than current operational estimates) are supported by multiple estimation methods and constraints imposed by ambient levels of ozone, hydroxyl radical (OH) reactivity, and the organic component of fine particulate matter (PM2.5) in Pasadena, California. A near-field model, which estimates human chemical exposure during or in the vicinity of product use, indicates these high air emissions are consistent with organic product usage up to ~75 kg person-1 yr-1, and inhalation of consumer products could be a non-negligible exposure pathway. After constraining the PM2.5 yield to 5% by mass, VCPs produce ~41% of the photochemical organic PM2.5 (1.1 ± 0.3 μg m-3) and ~17% of maximum daily 8-hr average ozone (9 ± 2 ppb) in summer Los Angeles. Therefore, both toxicity and ambient criteria pollutant formation should be considered when organic substituents are developed for VCPs in pursuit of safer and sustainable products and cleaner air.


Figures

Extended Data Fig. 1
Simulated non-fossil and fossil carbon in the current model and the feasible solution case at Pasadena compared to observations in Woody et al.
Extended Data Fig. 2
Extended Data Fig. 2. Simulated SOA formation efficiency (SOAFE) over 8:30 am – 12:30 pm at Pasadena.
SOAFE quantifies SOA mass formation per volume of organic gases reacted over a time window, which brings together the organic PM2.5 yield, precursor abundance, oxidant level, and reaction rate constant. See more details in Supplementary Notes.
Extended Data Fig. 3
Extended Data Fig. 3. Simulated OH in the current model estimate and the feasible solution case compared to observations at Pasadena.
The simulation without VCP emissions is indicated with the dashed line.
Extended Data Fig. 4
Extended Data Fig. 4. Schematic of the methodology.
This work integrated near-field (i.e., SHEDS-HT) with far-field (i.e., CMAQ modeling with 2011 NEI) modeling and top-down constraints based on ambient measurements. The blue boxes indicate emission estimates that were inter-compared. The emissions in EPA 2011 NEI, containing the estimate for VCP-emitted VOCs (solid outlined), went into air quality modeling. The yellow boxes indicate processing of the NEI including chemical speciation of emissions with the SPECIATE database, and mapping to CMAQ regional model surrogates using a certain chemical mechanism (e.g., SAPRC07). For VCPs, SOA formation was parametrized with a fixed SOA yield (large dashed arrow), and thus emission processing was not required for VCP-emitted VOCs. See more details in Methods.
Fig. 1 |
Fig. 1 |. Comparison of organic product usage, emission factors, and PM2.5 yields across different methodologies.
a-b, organic product usage per person Si¯ (total height of the bars including unfilled portion) and EFi¯ values attenuated by washing down the drain (filled portion of the bars) (a), PM2.5 yields by mass organic gases reacted estimated by McDonald et al. and upper bound estimates for prompt formation in the Community Multiscale Air Quality (CMAQ) Modeling System (b). In a, Si¯ and EFi¯ values labeled CA indicate they are CA-specific, and otherwise are nation-wide estimates. Si¯ for household products in SHEDS (one unfilled bar indicated with an arrow) and the total Si¯ and EFi¯ values (the rightmost bar cluster) use the right y-axis; the asterisks indicate data are not available. Also note Si¯ estimates are not shown for the CA-component of the 2011 NEI (only EFi¯ values are available for CA-component). In b, the PM2.5 yield of 5% by mass of organic gases was adopted in the CMAQ feasible solution; however, an PM2.5 yield of 10% (represented by star on far right) also resulted in PM2.5 SOA concentrations consistent with measurements.
Fig. 2 |
Fig. 2 |. Organic gas emissions and PM2.5 SOA formation potentials for personal care products based on current and new emission composition, respectively, using parameters in CMAQ.
The blue shaded portion indicates the current operational method was used to specify emission composition while updated information was used for the yellow panel. Emission values (in g) that do not correspond to the left y-axis are displayed in black text. PM2.5 yields by mass per organic gases are indicated with red figures.
Fig. 3 |
Fig. 3 |. Normalized mean biases (NMB) between CMAQ-predicted and observed prompt SOA concentration (SOAprompt) in Pasadena, California for different combinations of VCP emission magnitude (horizontal axis) and VCP PM2.5 yield (vertical axis) adjustments.
Cross hatching indicates parameters are inconsistent with observations (specifically, NMB ≥ uncertainty in measured OA, i.e., 38% ). Recommended emissions (top) and PM2.5 yields (right) in McDonald el al. are marked by the range indicated in the margin. Recommended emission magnitude based on SHEDS (consumer emissions only) are indicated with the red asterisk (top). Two cases, the current model (dashed) and feasible solution (solid) are also indicated with yellow-outlined boxes. Base VCP emissions in the CA component of the 2011 NEI are 4.7 kg person−1 yr-1.
Fig. 4 |
Fig. 4 |. Diurnal variation of simulated and observed SOAprompt at Pasadena, California.
The simulation with VCP emissions zeroed out is indicated with dashed line. The grey boxes underneath indicate the 25th and 75th percentiles of the observations, with median values marked with horizontal lines in the boxes, and whiskers extending to the 10th and 90th percentiles. The solid lines indicate means of the observations and simulations.
Fig. 5 |
Fig. 5 |. Simulated MDA8 O3 and OH reactivity vs observations at Pasadena.
a-b, MDA8 O3 (a) and OH reactivity with different VCP emission magnitudes (b). In (a), the simulation with VCP emissions zeroed out is indicated with pink color, and averaged MDA8 O3 concentrations are given in the parentheses.

Similar articles

Cited by

References

    1. McDonald BC et al. Volatile chemical products emerging as largest petrochemical source of urban organic emissions. Science 359, 760–764, (2018). - PubMed
    1. Trantallidi M et al. Ephect III: Health risk assessment of exposure to household consumer products. Sci. Total Environ 536, 903–913, (2015). - PubMed
    1. Elberling J et al. Mucosal symptoms elicited by fragrance products in a population-based sample in relation to atopy and bronchial hyper-reactivity. Clin. Exp. Allergy 35, 75–81, (2005). - PubMed
    1. Gabb HA & Blake C An informatics approach to evaluating combined chemical exposures from consumer products: A case study of asthma-associated chemicals and potential endocrine disruptors. Environ. Health Perspect 124, 1155–1165, (2016). - PMC - PubMed
    1. Dodson RE et al. Endocrine disruptors and asthma-associated chemicals in consumer products. Environ. Health Perspect 120, 935–943, (2012). - PMC - PubMed