Review
. 2020 Oct 13;5(42):26967-26977.
doi: 10.1021/acsomega.0c04018. eCollection 2020 Oct 27.

Fluorescent Probes for Super-Resolution Microscopy of Lysosomes

Affiliations
Review

Fluorescent Probes for Super-Resolution Microscopy of Lysosomes

Aditya Yadav et al. ACS Omega. .

Abstract

Lysosomes are membrane-enclosed small spherical cytoplasmic organelles. Malfunctioning and abnormalities in lysosomes can cause a plethora of neurodegenerative diseases. Consequently, understanding the structural information on lysosomes down to a subnanometer level is essential. Recently, super-resolution imaging techniques enable us to visualize dynamical processes occurring in suborganelle structures inside living cells down to subnanometer accuracy by breaking the diffraction limit. A brighter and highly photostable fluorescent probe is essential for super-resolution microscopy. In this regard, this mini-review deals with the various types of super-resolution techniques and the probes that are used to specifically stain and resolve the structure of the lysosomes.


Conflict of interest statement

The authors declare no competing financial interest.

Figures

Figure 1
Figure 1
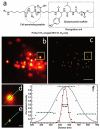
(a) Confocal microscopy. (b) STED microscopy images of lysosome structure using carbon dots in fixed MCF7 cells. (c and d) Two representative line profiles obtained from carbon dot signals inside the cell. Gaussian fits (thicker line) and raw data (light color) are shown in STED (green color) and confocal (red color) mode. The fwhm values are (i) 140 nm and (ii) 66 nm in (c) and (i) 98 nm, (ii) 54 nm, and (iii) 30 nm in (d). Reprinted with permission from ref (14). Copyright 2014. The Royal Society of Chemistry.
Figure 2
Figure 2
(a) Confocal and (b) STED microscopy images of lysosomes of living HeLa cells stained with LysoPB Yellow. The right panel of (b) shows the zoomed images from the ROI 1–4. (c) Intensity profiles across the lysosomes (ROI 1 in panel b). (d) STED images of large lysosomes. Reprinted with permission from ref (16). Copyright 2020. American Chemical Society.
Figure 3
Figure 3
(a) Picture showing SIM imaging of lysosomes inside living He La cells (scale bar 10 μm). The insets show the zoomed images of the red and blue regions (scale bar 5 μm). (b) 3D surface plot sketching of the SIM picture of lysosomes with pseudocolor demonstrating relative fluorescence intensity. Reprinted with permission from ref (17). Copyright 2018. Springer.
Figure 4
Figure 4
Super-resolution imaging of lysosomes in U2OS cells by SIM using three different probes: (a) Lysosome-488, (b) Lysosome-565, and (c) Lysosome-647, respectively. Reprinted with permission from ref (18). Copyright 2017. Nature Publishing Group.
Figure 5
Figure 5
(a) Compositions of a Cy5-AuNP. (b) SIM images of HeLa cells stained with nanoparticles for different treatment periods. (c) SIM images of HeLa cells stained with nanoparticles in different concentrations for 24 h. Reprinted with permission from ref (22). Copyright 2020. Ivyspring International Publisher.
Figure 6
Figure 6
(a) PALM and epi-fluorescence (inset) images of a COS-7 cell labeled with PALM probe. (b and c) Zoomed version of the highlighted regions. (d) Representative single-molecule blinking trajectory. (e) Line profile of individual lysosomes in b and c. (f) Photon count and (g) localization uncertainty parameters of the single-molecule photoactivation events. Reprinted with permission from ref (23). Copyright 2018. American Chemical Society.
Figure 7
Figure 7
(a) Scheme showing the construction of probes. (b) Diffraction-limited TIRF image and (c) super-resolution images of stained lysosomes. (d) Zoomed TIRF image of the boxed region in b. (e) Zoomed super-resolution image of the boxed region in c. (f) Cross-sectional profiles of lysosome shown in d, e. Scale bars: (c) 2 μm and (e) 200 nm. Reprinted with permission from ref (24). Copyright 2014. Nature Publishing Group.
Figure 8
Figure 8
(a) Wide-field and (b) PALM image of the lysosomes. (c and d) Zoomed images for the boxed areas from images a and b, respectively. (e) Intensity profile of a single lysosome along the lines in c and d. (f) Histograms of the number of photons per event. (g) Histograms of the localization precision. Scale bars: 2 mm (a and b); 300 nm (c and d). Reprinted with permission from ref (25). Copyright 2018. The Royal Society of Chemistry.
Figure 9
Figure 9
(a) Bright-field and (b) conventional fluorescence images displayed the distribution of lysohighlighter. (c) Zoomed image of the conventional fluorescence image shown by the box in part b. (d) SRM image of the same box marked in part b. Images e and f are zoomed views of the boxes marked in parts c and d, respectively (g) Intensity profiles of a pair of neighboring fluorescent points along the dashed lines in part f. Reprinted with permission from ref (26). Copyright 2014. American Chemical Society.
Figure 10
Figure 10
(a) Protonation of Lyso-R produces Lyso-RH in situ in acidic lysosomes. (b) Super-resolved and (c) conventional microscopic images of lysosomes stained with Lyso-RH. (d) Time colored super-resolution images of lysosomes. (e) and (f) are zoomed images of the highlighted region in (b) and (c). (g) Intensity profile from (e) and (f). (h) Histogram of brightness and (i) localization uncertainties of a single molecule. (j) FRC analysis of (b). (k) The survival fraction of molecules. Scale bars: for b and c, 1 μm; for d, 4 μm; for d-1 to 5, 200 nm; for e and f, 300 nm. Reprinted with permission from ref (27). Copyright 2019. American Chemical Society.
Figure 11
Figure 11
(a) and (b) STORM images of HeLa cells stained with ROXSA and LysoTracker Red, respectively. (c) Recognized molecules per lysosome of HeLa cells loaded with LysoTracker Red or ROXSA. (d) Distribution of number of photons perceived for individual ROXSA or Lyso Tracker Red. Reprinted with permission from ref (28). Copyright 2018. American Chemical Society.
Figure 12
Figure 12
(a) TD, (b) TIRF, and (c) SRRF image of GNC-labeled lysosomes inside HeLa cells. (d) Zoomed image from SRRF images. (e–h) Resolutions attained from SRRF microscopy of various lysosomes present in panel d (shown as 1–4, respectively). Reprinted with permission from ref (30). Copyright 2018. American Chemical Society.

References

    1. Xu H.; Ren D. Lysosomal Physiology. Annu. Rev. Physiol. 2015, 77, 57–80. 10.1146/annurev-physiol-021014-071649. - DOI - PMC - PubMed
    1. Wu L.; Li X.; Ling Y.; Huang C.; Jia N. Morpholine Derivative-Functionalized Carbon Dots-Based Fluorescent Probe for Highly Selective Lysosomal Imaging in Living Cells. ACS Appl. Mater. Interfaces 2017, 9 (34), 28222–28232. 10.1021/acsami.7b08148. - DOI - PubMed
    1. Stelzer E. H. K. Light Microscopy: Beyond the Diffraction Limit?. Nature 2002, 417 (6891), 806.10.1038/417806a. - DOI - PubMed
    1. Hell S. W.; Wichmann J. Breaking the Diffraction Resolution Limit by Stimulated Emission: Stimulated-Emission-Depletion Fluorescence Microscopy. Opt. Lett. 1994, 19 (11), 780–782. 10.1364/OL.19.000780. - DOI - PubMed
    1. Heintzmann R.; Huser T. Super-Resolution Structured Illumination Microscopy. Chem. Rev. 2017, 117 (23), 13890–13908. 10.1021/acs.chemrev.7b00218. - DOI - PubMed