

Navigating by Stars: Using CMS Star Ratings to Choose Hospitals for Complex Cancer Surgery
- PMID: 33134834
- PMCID: PMC7583163
- DOI: 10.1093/jncics/pkaa059
Navigating by Stars: Using CMS Star Ratings to Choose Hospitals for Complex Cancer Surgery
Abstract
Background: The Centers for Medicare and Medicaid Services (CMS) developed risk-adjusted "Star Ratings," which serve as a guide for patients to compare hospital quality (1 star = lowest, 5 stars = highest). Although star ratings are not based on surgical care, for many procedures, surgical outcomes are concordant with star ratings. In an effort to address variability in hospital mortality after complex cancer surgery, the use of CMS Star Ratings to identify the safest hospitals was evaluated.
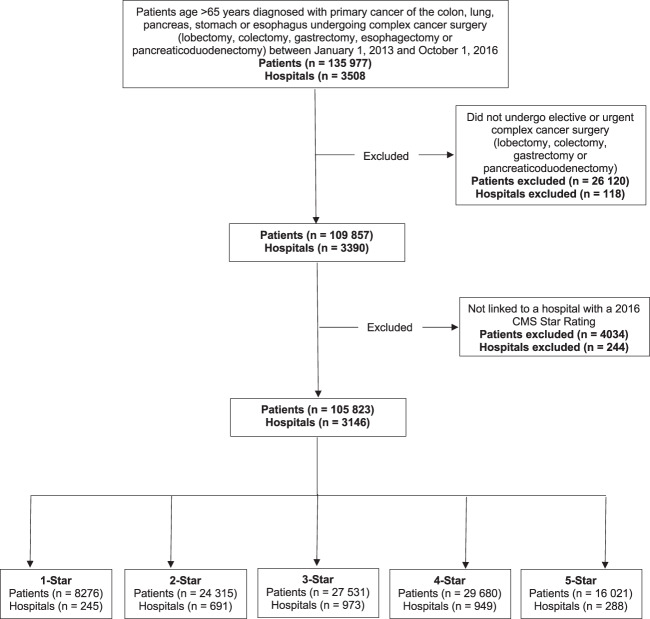
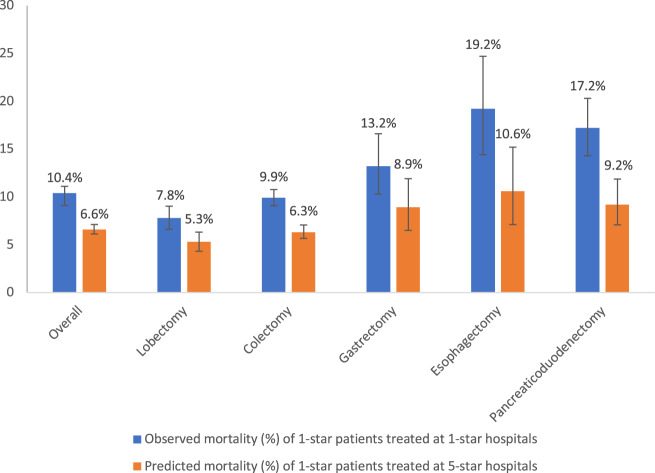
Methods: Patients older than 65 years of age who underwent complex cancer surgery (lobectomy, colectomy, gastrectomy, esophagectomy, pancreaticoduodenectomy) were evaluated in CMS Medicare Provider Analysis and Review files (2013-2016). The impact of reassignment was modeled by applying adjusted mortality rates of patients treated at 5-star hospitals to those at 1-star hospitals (Peters-Belson method).
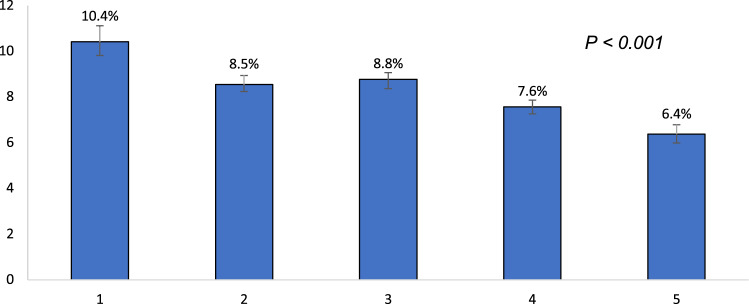
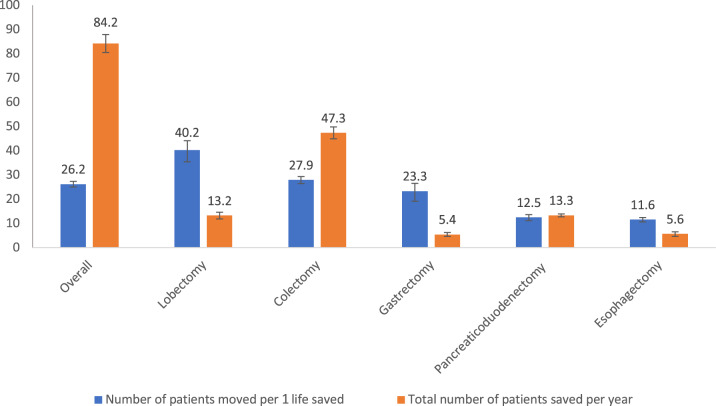
Results: There were 105 823 patients who underwent surgery at 3146 hospitals. The 90-day mortality decreased with increasing star rating (1 star = 10.4%, 95% confidence interval [CI] = 9.8% to 11.1%; and 5 stars = 6.4%, 95% CI = 6.0% to 6.8%). Reassignment of patients from 1-star to 5-star hospitals (7.8% of patients) was predicted to save 84 Medicare beneficiaries each year. This impact varied by procedure (colectomy = 47 lives per year; gastrectomy = 5 lives per year). Overall, 2189 patients would have to change hospitals each year to improve outcomes (26 patients moved to save 1 life).
Conclusions: Mortality after complex cancer surgery is associated with CMS Star Rating. However, the use of CMS Star Ratings by patients to identify the safest hospitals for cancer surgery would be relatively inefficient and of only modest impact.
© The Author(s) 2020. Published by Oxford University Press.
Figures
Comment in
-
Racial and Ethnic Disparities Among Participants in US-Based Phase 3 Randomized Cancer Clinical Trials.JNCI Cancer Spectr. 2020 Jul 7;4(5):pkaa060. doi: 10.1093/jncics/pkaa060. eCollection 2020 Oct. JNCI Cancer Spectr. 2020. PMID: 33225207 Free PMC article.
References
-
- Fisher E, Wennberg D, Stukel T, et al. The implications of regional variations in Medicare spending. Ann Intern Med. 2003;138(4):273–287. - PubMed
-
- Birkmeyer JD, Sun Y, Goldfaden A, et al. Volume and process of care in high-risk cancer surgery. Cancer. 2006;106(11):2476–2481. - PubMed
-
- Etzioni DA, Young-Fadok TM, Cima RR, et al. Patient survival after surgical treatment of rectal cancer: impact of surgeon and hospital characteristics. Cancer. 2014;120(16):2472–2481. - PubMed
-
- Chiu AS, Arnold BN, Hoag JR, et al. Quality versus quantity: the potential impact of public reporting of hospital safety for complex cancer surgery. Ann Surg. 2019;270(2):281–287. - PubMed
-
- Begg CB, Cramer LD, Hoskins WJ, Brennan MF. Impact of hospital volume on operative mortality for major cancer surgery. JAMA. 1998;280(20):1747–1751. - PubMed
Grants and funding
LinkOut - more resources
Full Text Sources