. 2020 Nov 20;23(11):101744.
doi: 10.1016/j.isci.2020.101744. Epub 2020 Oct 28.

SARS-CoV-2 Targets by the pscRNA Profiling of ACE2, TMPRSS2 and Furin Proteases

Affiliations

SARS-CoV-2 Targets by the pscRNA Profiling of ACE2, TMPRSS2 and Furin Proteases

Lulin Zhou et al. iScience. .

Abstract

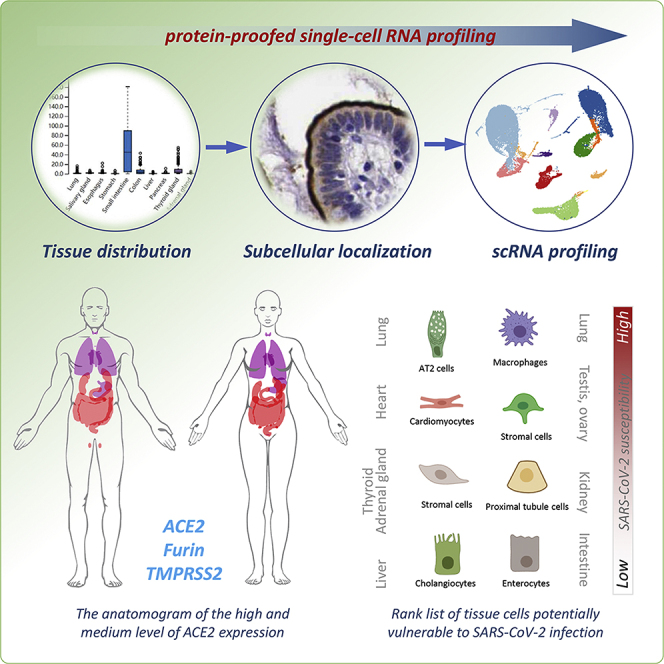
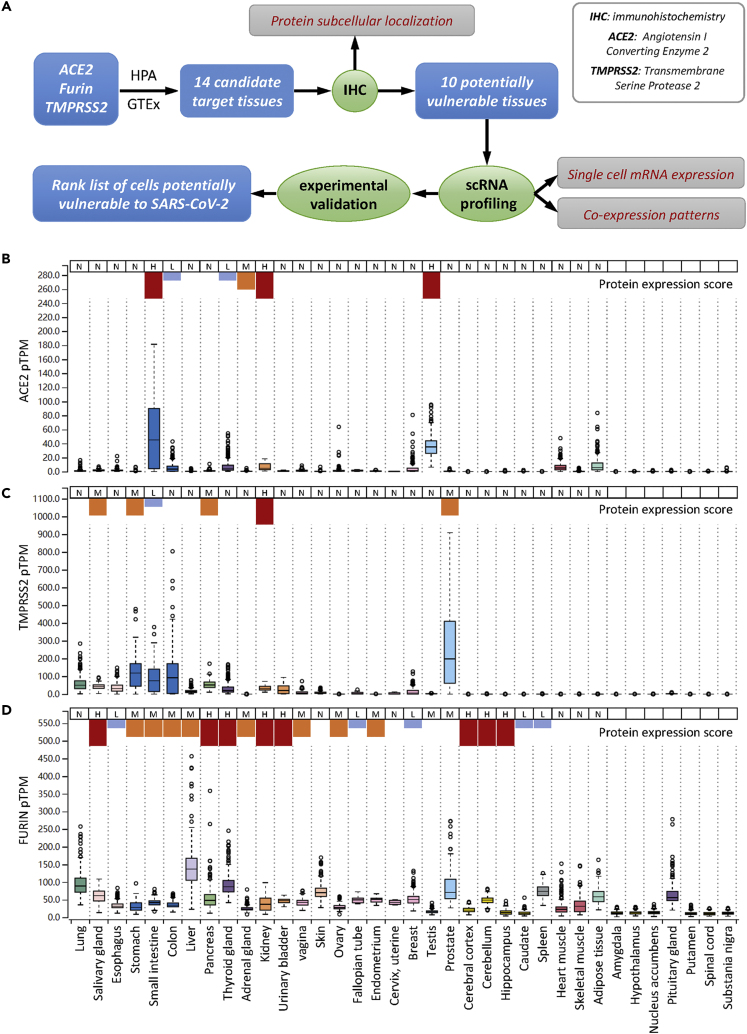
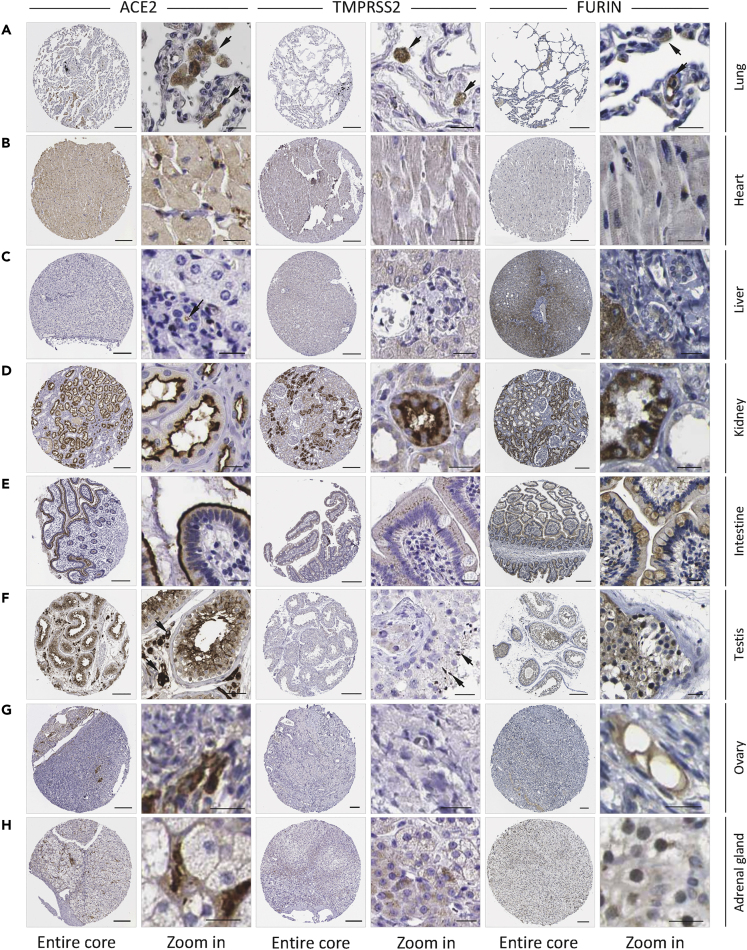
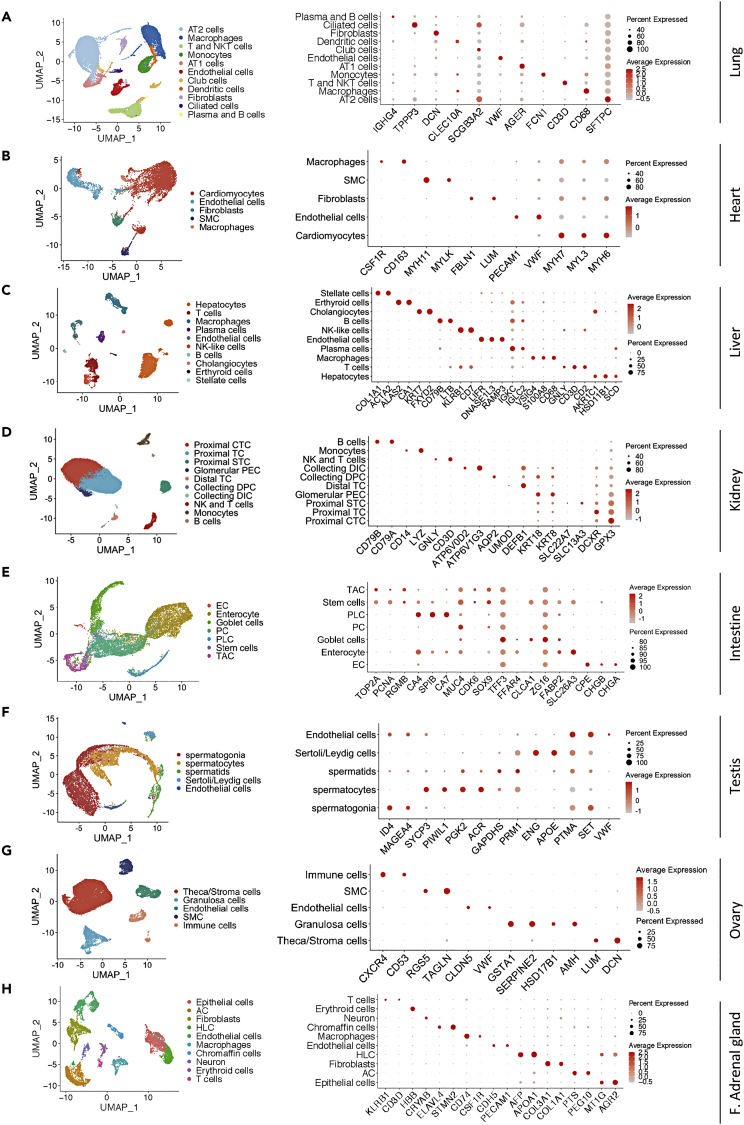
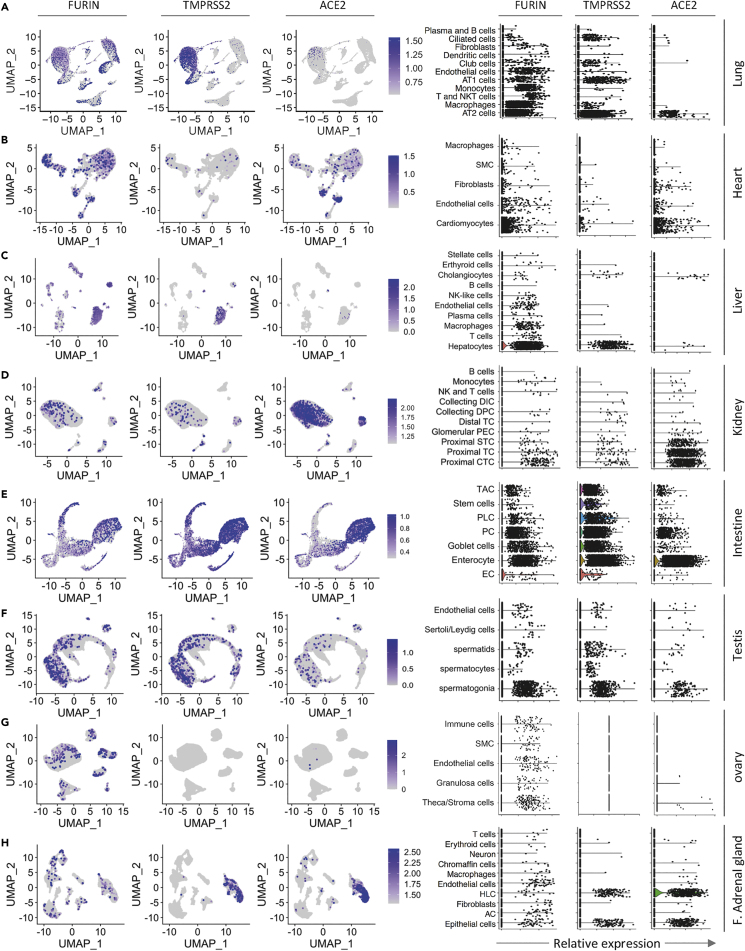
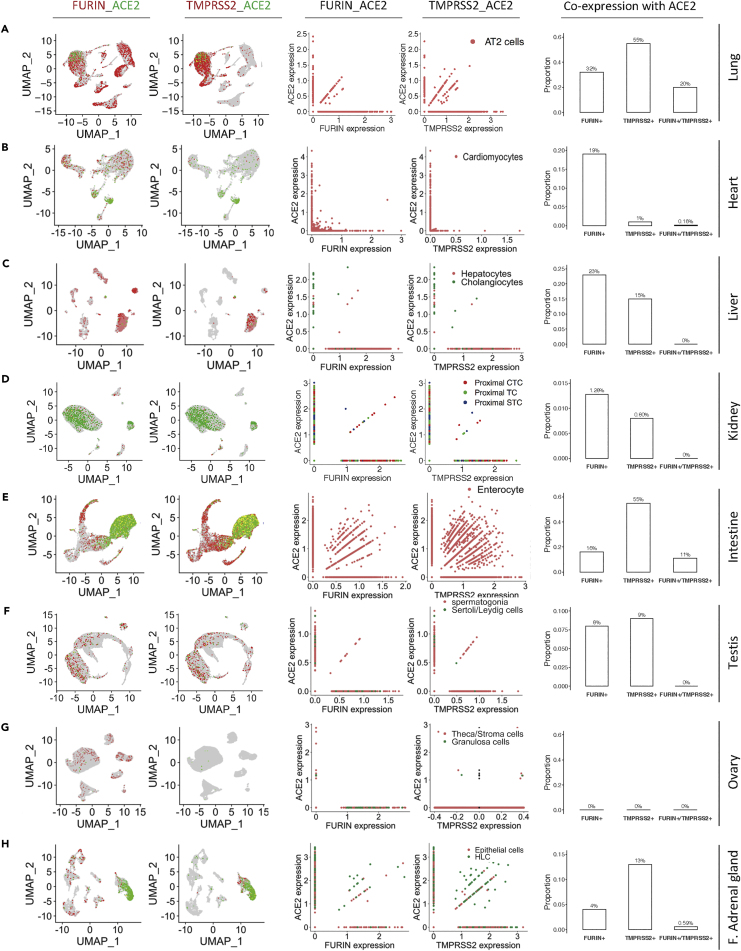
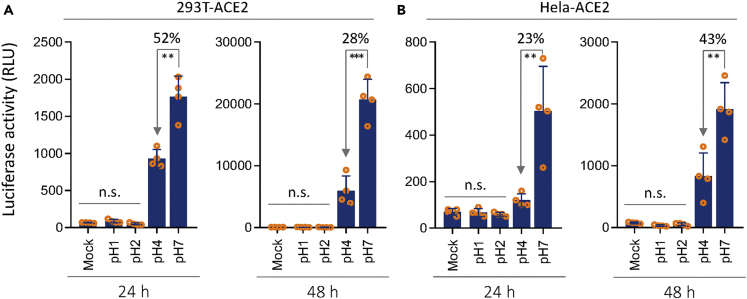
The cellular targets of SARS-CoV-2, the novel coronavirus causing the COVID-19 pandemic, is still rudimentary. Here, we incorporated the protein information to analyze the expression of ACE2, the SARS-CoV-2 receptor, together with co-factors, TMPRSS2 and Furin, at single-cell level in situ, which we called protein-proofed single-cell RNA (pscRNA) profiling. Systemic analysis across 36 tissues revealed a rank list of candidate cells potentially vulnerable to SARS-CoV-2. The top targets are lung AT2 cells and macrophages, then cardiomyocytes and adrenal gland stromal cells, followed by stromal cells in testis, ovary, and thyroid, whereas the kidney proximal tubule cells, cholangiocytes, and enterocytes are less likely to be the primary SARS-CoV-2 targets. Actually, the stomach may constitute a physical barrier against SARS-CoV-2 as the acidic environment (pH < 2.0) could completely inactivate SARS-CoV-2 pseudo-viruses. Together, we provide a comprehensive view on the potential SARS-CoV-2 targets by pscRNA profiling.

Keywords: Microbiology; Transcriptomics; Virology.


Conflict of interest statement

The authors declare no competing interests.

Figures

None
Graphical abstract
Figure 1
Figure 1
Tissue Distribution of ACE2, TMPRSS2, and Furin Proteases (A) Overview of the analysis framework. (B–D) The mRNA expression level and protein expression score of ACE2 (B), TMPRSS2 (C), and Furin (D) in the manifold tissues and organs. N: negative; L: low expression shown in short blue column; M: median expression, shown in medium-sized orange column; H: high expression, shown in long red column. ACE2: angiotensin I-converting enzyme 2; TMPRSS2: transmembrane serine protease 2; HPA: The Human Protein Atlas; GTEx: The Genotype-Tissue Expression dataset; IHC: immunohistochemistry; scRNA: single-cell RNA; TPM: transcripts per million; pTPM: all TPM values per sample scaled to a sum of 1 million TPM. Note: the RNA expression data were retrieved from GTEx database, the protein expression scores were retrieved from HPA database, in which the protein scores of last seven tissues are missing, therefore not indicated. Figure S1 shows RNA and protein expression on more tissues from HPA database.
Figure 2
Figure 2
Protein Expression of ACE2, TMPRSS2, and Furin In Situ in Tissues (A–H) The IHC images for the protein expression of ACE2, TMPRSS2, and Furin in the indicated tissues/organs. F. adrenal gland: fetal adrenal gland. Scale bars: 200 μm for core images, 20 μm for zoom-in images. Arrows indicate the positive IHC signals (note: not all signals were indicated). Please find in supplementary figures image replicates (Figure S2) and images of more tissues (Figure S3).
Figure 3
Figure 3
Single-Cell Profiling of the Cell Types in Tissues and Organs (A–H) UMAP plots on the left panel show single-cell transcriptomic profiling of the cell types from the lung (A), heart (B), liver (C), kidney (D), intestine (E), testis (F), ovary (G) and fetal adrenal gland (H). Dot plots on the right panel represent the expression of canonical marker genes of each cell type in the indicated tissues/organs. AT2: alveolar type II, AT1: alveolar type I, SMC: smooth muscle cells, NK: natural killer, CTC: convoluted tubule cells, TC: tubule cells, STC: straight tubule cells, PEC: parietal epithelial cells, TC: tubule cells, DPC: duct principal cells, DIC: distal tubule cells, EC: enteroendocrine cells, PC: Paneth cells, PLC: Paneth-like cells, TAC: transient amplifying cells, AC: adrenocortical cell, HLC: hepatocyte-like cell, F. adrenal gland: fetal adrenal gland.
Figure 4
Figure 4
Single-Cell Transcriptomic Profiling of ACE2, TMPRSS2, and Furin Proteases in Distinct Cell Types (A–H) UMAP plots (left panel) show the mRNA expression of ACE2, TMPRSS2, and Furin genes as displayed on the top of each column of graphs in different cell clusters from the lung (A), heart (B), liver (C), kidney (D), intestine (E), testis (F), ovary (G) and fetal adrenal gland (H). Violin plots (right panel) illustrate the gene expression of Furin, TMPRSS2, and ACE2 as shown on the top of each column of graphs in different cell types in the indicated tissues or organs. AT2: alveolar type II, AT1: alveolar type I, SMC: smooth muscle cells, NK: natural killer, CTC: convoluted tubule cells, TC: tubule cells, STC: straight tubule cells, PEC: parietal epithelial cells, TC: tubule cells, DPC: duct principal cells, DIC: distal tubule cells, EC: enteroendocrine cells, PC: Paneth cells, PLC: Paneth-like cells, TAC: transient amplifying cells, HLC: hepatocyte-like cell, AC: adrenocortical cell, F. adrenal gland: fetal adrenal gland.
Figure 5
Figure 5
Characterization of the Co-expression Patterns of ACE2, TMPRSS2, and Furin at Single-Cell Level (A-H) UMAP plots (left panels) show the co-expression of ACE2 with Furin or TMPRSS2 in the indicated tissues/organs. The different colors in UMAP plots are corresponding to different genes as indicated on the top of each graph column. Scatterplots (two middle panels) illustrate the expression correlation of ACE2 with Furin or TMPRSS2 in the AT2 cells (A), cardiac cardiomyocytes (B), liver hepatocytes and cholangiocytes (C), the proximal tubule cells of kidney (D), the enterocyte of intestinal tract (E), the spermatogonia and Sertoli/Leydig cells in the testis (F), the stroma cells and granulosa cells in the ovary (G), and the epithelial cell and HLC in the fetal adrenal gland (H). The colors in scatterplots indicate the corresponding cell types depicted on the upper right corner. Barplots (right panels) show the proportion of ACE2-positive cells expressing either or both FURIN and TMPRSS2. The number above the bar in the barplots indicates the corresponding percentage. CTC: convoluted tubule cells, TC: tubule cells, STC: straight tubule cells, HLC: hepatocyte-like cell, F. adrenal gland: fetal adrenal gland.
Figure 6
Figure 6
Compromised Infectivity of SARS-CoV-2 Pseudo-virus in Acidic Environment (A and B) The effects of low pH on the activities of SARS-CoV-2 pseudo-virus to infect 293T-ACE2 cells (A), or Hela-ACE2 cells (B), as determined by luciferase assay 24 h (left) and 48 h (right) postinfection. n.s.: not significant; ∗∗p < 0.01; ∗∗∗p < 0.001.

Similar articles

Cited by

References

    1. Bost P., Giladi A., Liu Y., Bendjelal Y., Xu G., David E., Blecher-Gonen R., Cohen M., Medaglia C., Li H. Host-viral infection maps reveal signatures of severe COVID-19 patients. Cell. 2020;181:1475–1488.e12. - PMC - PubMed
    1. Chai X., Hu L., Zhang Y., Han W., Lu Z., Ke A., Zhou J., Shi G., Fang N., Fan J. Specific ACE2 expression in cholangiocytes may cause liver damage after 2019-nCoV infection. bioRxiv. 2020 doi: 10.1101/2020.02.03.931766. - DOI
    1. Guan W.J., Ni Z.Y., Hu Y., Liang W.H., Ou C.Q., He J.X., Liu L., Shan H., Lei C.L., Hui D.S.C. Clinical characteristics of coronavirus disease 2019 in China. New Engl. J. Med. 2020 doi: 10.1056/NEJMoa2002032. - DOI - PMC - PubMed
    1. Hoffmann M., Kleine-Weber H., Schroeder S., Kruger N., Herrler T., Erichsen S., Schiergens T.S., Herrler G., Wu N.H., Nitsche A. SARS-CoV-2 cell entry depends on ACE2 and TMPRSS2 and is blocked by a clinically proven protease inhibitor. Cell. 2020;181:271–280.e8. - PMC - PubMed
    1. Jiang X., Zhang Z., Wang C., Ren H., Gao L., Peng H., Niu Z., Ren H., Huang H., Sun Q. Bimodular effects of D614G mutation on the spike glycoprotein of SARS-CoV-2 enhance protein processing, membrane fusion, and viral infectivity. Signal Transduction Targeted Ther. 2020 doi: 10.1038/s41392-020-00392-4. - DOI - PMC - PubMed

LinkOut - more resources