. 2020 Oct 13;23(11):101664.
doi: 10.1016/j.isci.2020.101664. eCollection 2020 Nov 20.

A Nuclear Stress Pathway that Parallels Cytoplasmic Stress Granule Formation

Affiliations

A Nuclear Stress Pathway that Parallels Cytoplasmic Stress Granule Formation

Tyler Quoc-Thai Do et al. iScience. .

Abstract

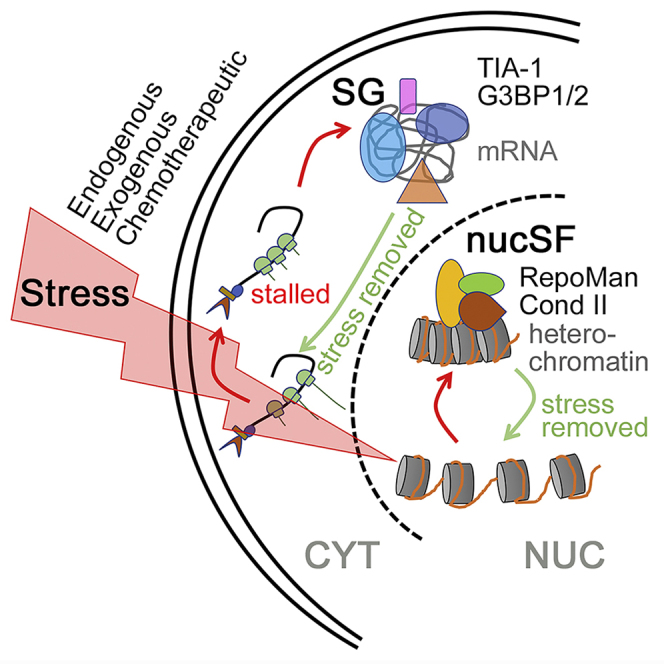
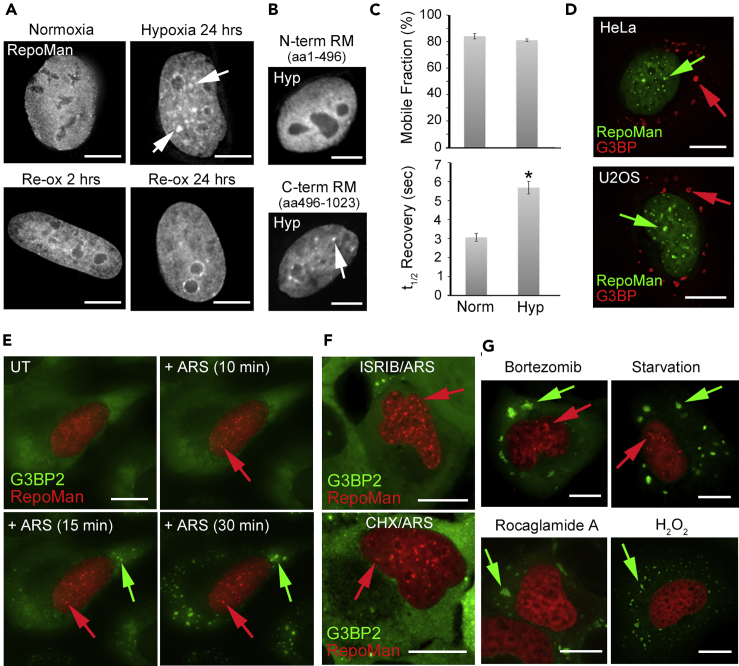
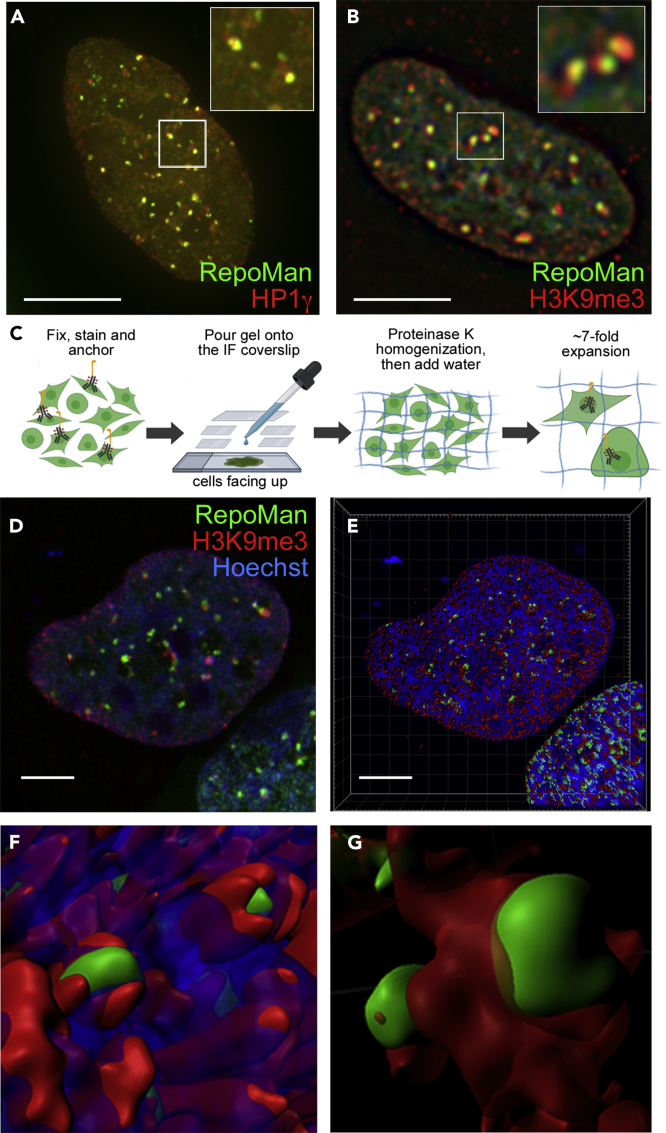
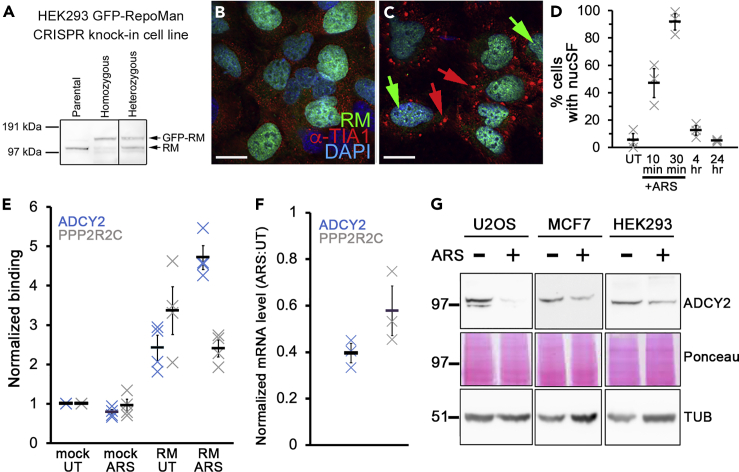
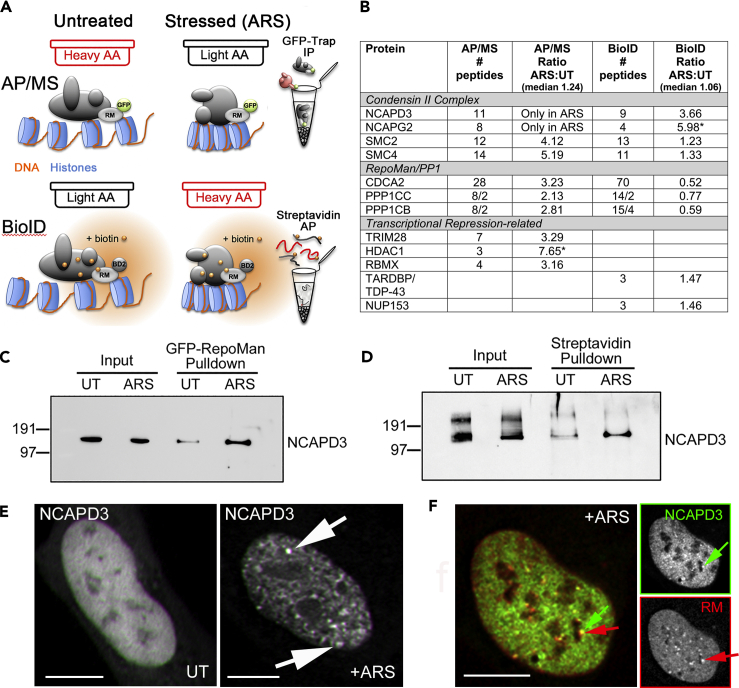
Stress adaptation is exploited by cancer cells to survive and proliferate under adverse conditions. Survival pathways induced by stress are thus highly promising therapeutic targets. One key pathway involves formation of cytoplasmic stress granules, which regulate the location, stability, and translation of specific mRNAs. Here, we describe a transcriptional stress response that is triggered by similar stressors and characterized by accumulation of RepoMan (cell division cycle associated 2) at nuclear stress foci (nucSF). Formation of these structures is reversible, and they are distinct from known nuclear organelles and stress bodies. Immunofluorescence analysis revealed accumulation of heterochromatic markers, and increased association of RepoMan with the adenylate cyclase 2 (ADCY2) gene locus in stressed cells accompanied reduced levels of ADCY2 mRNA and protein. Quantitative comparison of the RepoMan interactome in stressed vs. unstressed cells identified condensin II as a nucSF factor, suggesting their functional association in the establishment and/or maintenance of these facultative heterochromatic domains.

Keywords: Cell Biology; Molecular Biology; Optical Imaging; Proteomics.


Conflict of interest statement

The authors declare no competing interests.

Figures

None
Graphical abstract
Figure 1
Figure 1
Exogenous and Endogenous Stressors Trigger Formation of nucSF in Parallel with Cytoplasmic SGs (A) GFP-RepoMan transiently expressed in HeLa cells exposed to hypoxic (1% O2) conditions for 24 hr showed accumulation in multiple bright nuclear foci (arrows). These foci were largely resolved 24 hr after re-oxygenation (Re-ox). (B) Hypoxia (Hyp; 24 hr) triggered accumulation of the C-terminal half (aa 496–1023) but not the N-terminal half (aa 1–496) of RepoMan at nuclear foci (arrow). (C) FRAP analysis of GFP-RepoMan at hypoxia-induced nucSF revealed a significant decrease in turnover rate with no change in the overall mobile fraction (mean ± SE for >3 biological replicates; ∗p = 2.3 × 10−6 as determined by a paired Student's t-test). (D) GFP-RepoMan accumulates at nucSF (green arrows) in both HeLa and U2OS cells treated with 0.5 mM sodium arsenite for 30 min. The cells were fixed and stained with anti-G3BP to confirm formation of cytoplasmic SGs (red arrows). (E) Live imaging of U2OS cells stably expressing GFP-G3BP2 and transiently expressing mCherry-RepoMan. NucSF (red arrows) and SGs (green arrows) were detected as early as 10 and 15 min, respectively, following addition of 0.5 mM arsenite. See Video S1. (F) Inclusion of ISRIB (200 nM) or pre-treatment with CHX (50 μg/mL, 2 hr) selectively blocked SG but not nucSF formation in arsenite-treated cells. (G) Treatment with the proteasome inhibitor bortezomib (25 μM, 4 hr) and overnight glucose/serum starvation induced both SGs and nucSF, while treatment with the eIF4A inhibitor Rocaglamide (1 μM, 1 hr) or hydrogen peroxide (H2O2; 1 mM, 2 hr) selectively induced only SGs. See Video S2 for the full Rocaglamide A time course. Scale bars are 5 μm.
Figure 2
Figure 2
NucSF are Sites of Accumulation of Heterochromatic Markers (A and B) U2OS cells transiently expressing GFP-RepoMan (green) and treated with 0.5 mM arsenite for 30 min were fixed and stained with anti-HP1γ (A) or anti-H3K9me3 (B) and Alexa Fluor 555 secondary antibodies (red). (C) Simplified model of ExM protocol. The expansion factor averaged 7.1x (see Figure S4). (D) Airyscan image of an expanded arsenite-stressed U2OS cell expressing GFP-RepoMan and fixed and stained with anti-H3K9me3-AlexaFluor555 and Hoechst 33342. (E) 3D volume rendering of the data set in (D). (F and G) Enlarged insets (F and G) show RepoMan (green) relative to H3K9me3 (red) and DNA (blue). Scale bars are 5 μm.
Figure 3
Figure 3
Arsenite Stress Induces Increased Association of RepoMan with the ADCY2 Gene Locus (A) Western blot analysis of HEK293/GFP-RepoMan knock-in cell lysates with anti-RepoMan to assess the shift in molecular mass in heterozygous (single allele knock-in) and homozygous (double allele knock-in) cells. (B and C) To assess their response to acute arsenite treatment (0.5 mM for 30 min), homozygous cells were fixed following no treatment (B) or arsenite treatment (C) and stained with anti-TIA1 (red) and DAPI (blue). Green arrows indicate nucSF and red arrows point to SGs. Scale bars are 5 μm. (D) Time course of arsenite-induced nucSF formation and disassembly in HEK293 GFP-RepoMan CRISPR knock-in cells. For each time point, multiple fields of view were imaged and cells scored for nucSF formation (>6 foci per cell). Results are shown for 3 independent experiments, with a total of 167–262 cells counted for each time point (mean ± SE indicated by black bar). (E) ChIP-qPCR was used to compare binding of GFP-RepoMan to the ADCY2 (blue X) and PPP2R2C (gray X) gene loci in the knock-in cell line (untreated vs. 0.5 mM arsenite for 30 min). Mock immunoprecipitations (IPs) from untreated (UT) and arsenite-treated (ARS) lysates were included as controls, and all data normalized to the mock UT values. The experiment was repeated twice, with 2 technical replicates each time. Black bars indicate mean ± standard deviation (SD). (F) RNA isolated from untreated vs. arsenite-stressed U2OS cells was subjected to RT-qPCR analysis. Values were normalized to GAPDH (see Figure S4 for confirmation that its cellular levels do not change with arsenite stress). Mean ± standard error (SE) is indicated for 3 biological replicates. (G) Lysates from arsenite-stressed vs. untreated U2OS, MCF7, and HEK293 cells were subjected to Western blot analysis with anti-ADCY2. Ponceau staining is shown for the corresponding region on the blot, and alpha-tubulin was stained as an additional loading control (TUB; see Figure S4 for confirmation that its cellular levels do not change with arsenite stress).
Figure 4
Figure 4
Condensin II Accumulates at nucSF and Associates with RepoMan in Arsenite-Stressed Cells (A) Diagram detailing the complementary SILAC-based quantitative AP/MS and BioID strategies used to compare the interactome of RepoMan in arsenite-stressed vs untreated cells. For AP/MS, untreated cells were labeled with heavy (H) media and arsenite-treated cells with light (L) media. Endogenous GFP-tagged RepoMan in the HEK293 knock-in cell line was immunoprecipitated using the GFP-Trap_A affinity resin and associated proteins identified by MS analysis. For BioID, the labeling strategy was flipped so that untreated cells were labeled with light media and arsenite-treated cells with heavy media. BioID2-tagged RepoMan was lentivirally transduced in U2OS cells and biotinylated proteins captured on streptavidin affinity resin and identified by MS analysis. ARS:UT ratios were determined for all proteins identified (L:H for AP/MS, (H)L for BioID). (B) The table highlights overlapping and novel hits that showed increased association with RepoMan in single replicates of the internally controlled complementary screens (full data sets provided as Table S3). The number of peptides detected for each protein is listed, as well as its ratio ARS:UT (with the median ratio for the experiment listed for comparison). Note that in the AP/MS experiment NCAPD3 and NCAPG2 peptides were only detected in the L (+ARS) form. Asterisk (∗) indicates that MaxQuant did not calculate a SILAC ratio for the protein, so enrichment was estimated by comparing the summed L vs. H peptide intensities. (C) AP/Western blot validation of the increased association of endogenous NCAPD3 with endogenous GFP-tagged RepoMan in arsenite-stressed HEK293 knock-in cells. (D) BioID/Western blot validation of increased biotinylation of endogenous NCAPD3 by transduced BioID2-RepoMan in U2OS cells. Both blots were probed with anti-NCAPD3. (E) Live imaging of U2OS cells stably expressing GFP-NCAPD3, either untreated (left panel) or treated with 0.5 mM arsenite for 30 min (arrows indicate stress-induced nuclear foci). (F) Live imaging of U2OS cells stably expressing GFP-NCAPD3 (green) and transiently expressing mCherry-RepoMan (red), treated with 0.5 mM arsenite for 30 min to induce nucSF (red arrow) at which NCAPD3 (green arrow) accumulates. The inset panels show the individual NCAPD3 (top panel) and RepoMan (bottom panel) signals. Scale bars are 5 μm.

Similar articles

Cited by

References

    1. Aird K.M., Zhang R. Detection of senescence-associated heterochromatin foci (SAHF) In: Galluzzi L., Vitale I., Kepp O., Kroemer G., editors. Cell Senescence: Methods and Protocols, Methods in Molecular Biology. Humana Press; 2013. pp. 185–196. - PMC - PubMed
    1. Anderson P., Kedersha N., Ivanov P. Stress granules, P-bodies and cancer. Biochim. Biophys. Acta. 2015;1849:861–870. - PMC - PubMed
    1. Aulas A., Fay M.M., Lyons S.M., Achorn C.A., Kedersha N., Anderson P., Ivanov P. Stress-specific differences in assembly and composition of stress granules and related foci. J. Cell Sci. 2017;130:927–937. - PMC - PubMed
    1. Baguet A., Degot S., Cougot N., Bertrand E., Chenard M.-P., Wendling C., Kessler P., Hir H.L., Rio M.-C., Tomasetto C. The exon-junction-complex-component metastatic lymph node 51 functions in stress-granule assembly. J. Cell Sci. 2007;120:2774–2784. - PubMed
    1. Chen T.C., Hinton D.R., Zidovetzki R., Hofman F.M. Up-regulation of the cAMP/PKA pathway inhibits proliferation, induces differentiation, and leads to apoptosis in malignant gliomas. Lab. Invest. 1998;78:165–174. - PubMed

LinkOut - more resources