

Metabolomics Profiling of Critically Ill Coronavirus Disease 2019 Patients: Identification of Diagnostic and Prognostic Biomarkers
- PMID: 33134953
- PMCID: PMC7587450
- DOI: 10.1097/CCE.0000000000000272
Metabolomics Profiling of Critically Ill Coronavirus Disease 2019 Patients: Identification of Diagnostic and Prognostic Biomarkers
Abstract
Objectives: Coronavirus disease 2019 continues to spread rapidly with high mortality. We performed metabolomics profiling of critically ill coronavirus disease 2019 patients to understand better the underlying pathologic processes and pathways, and to identify potential diagnostic/prognostic biomarkers.
Design: Blood was collected at predetermined ICU days to measure the plasma concentrations of 162 metabolites using both direct injection-liquid chromatography-tandem mass spectrometry and proton nuclear magnetic resonance.
Setting: Tertiary-care ICU and academic laboratory.
Subjects: Patients admitted to the ICU suspected of being infected with severe acute respiratory syndrome coronavirus 2, using standardized hospital screening methodologies, had blood samples collected until either testing was confirmed negative on ICU day 3 (coronavirus disease 2019 negative) or until ICU day 10 if the patient tested positive (coronavirus disease 2019 positive).
Interventions: None.
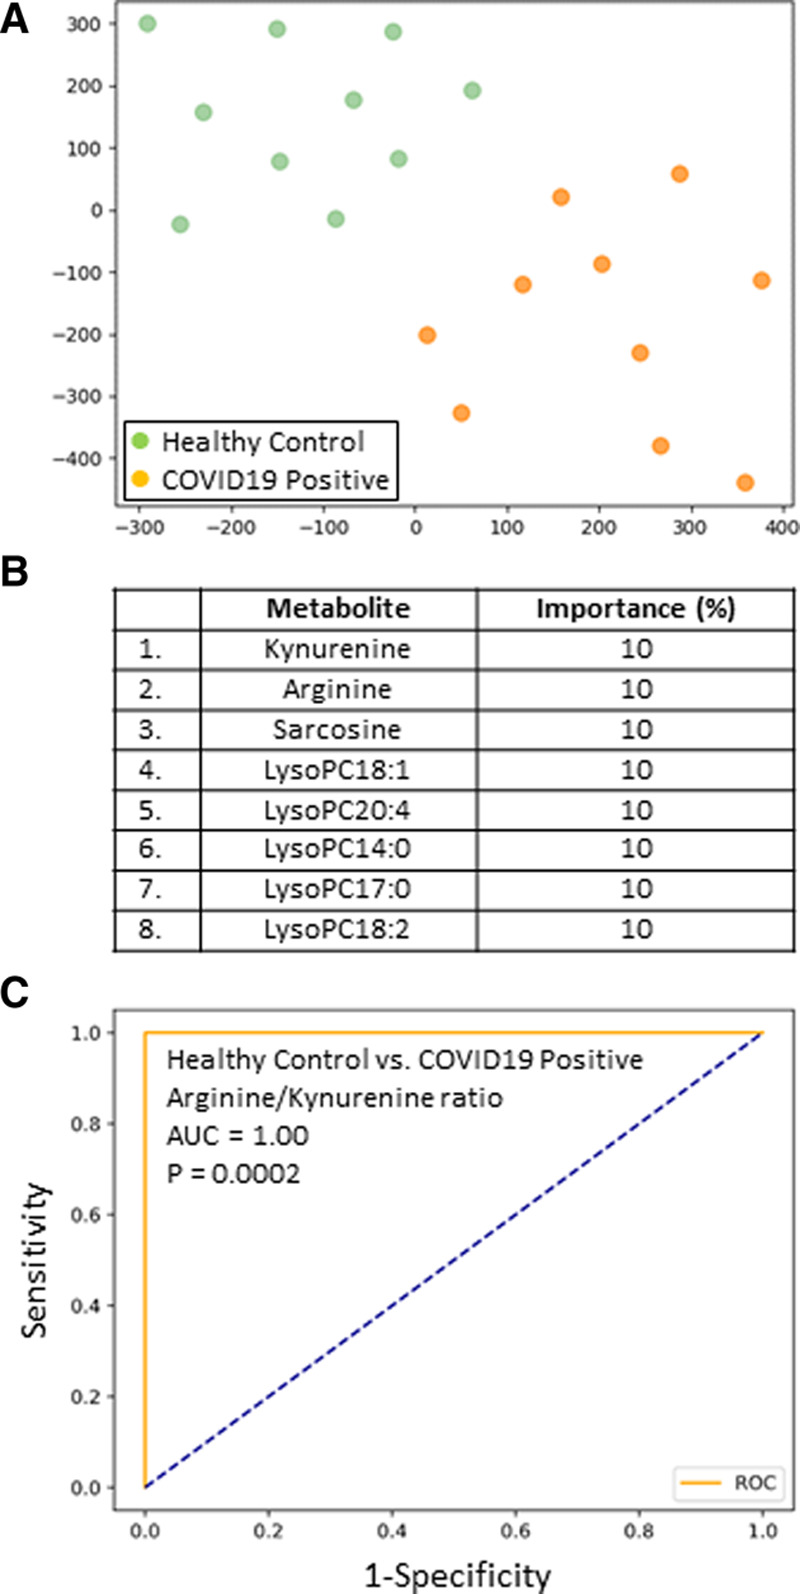
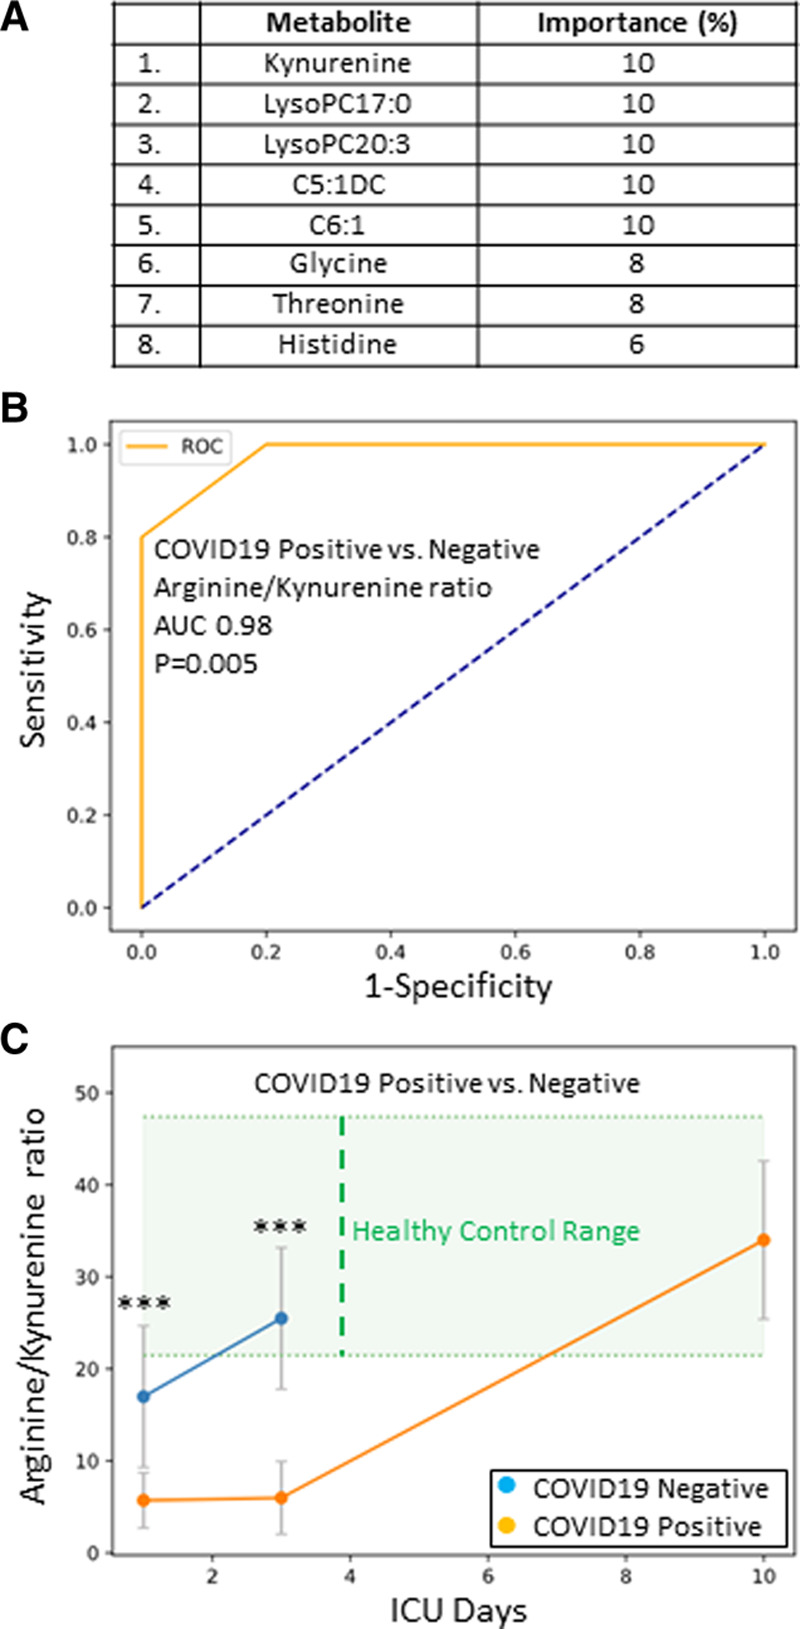
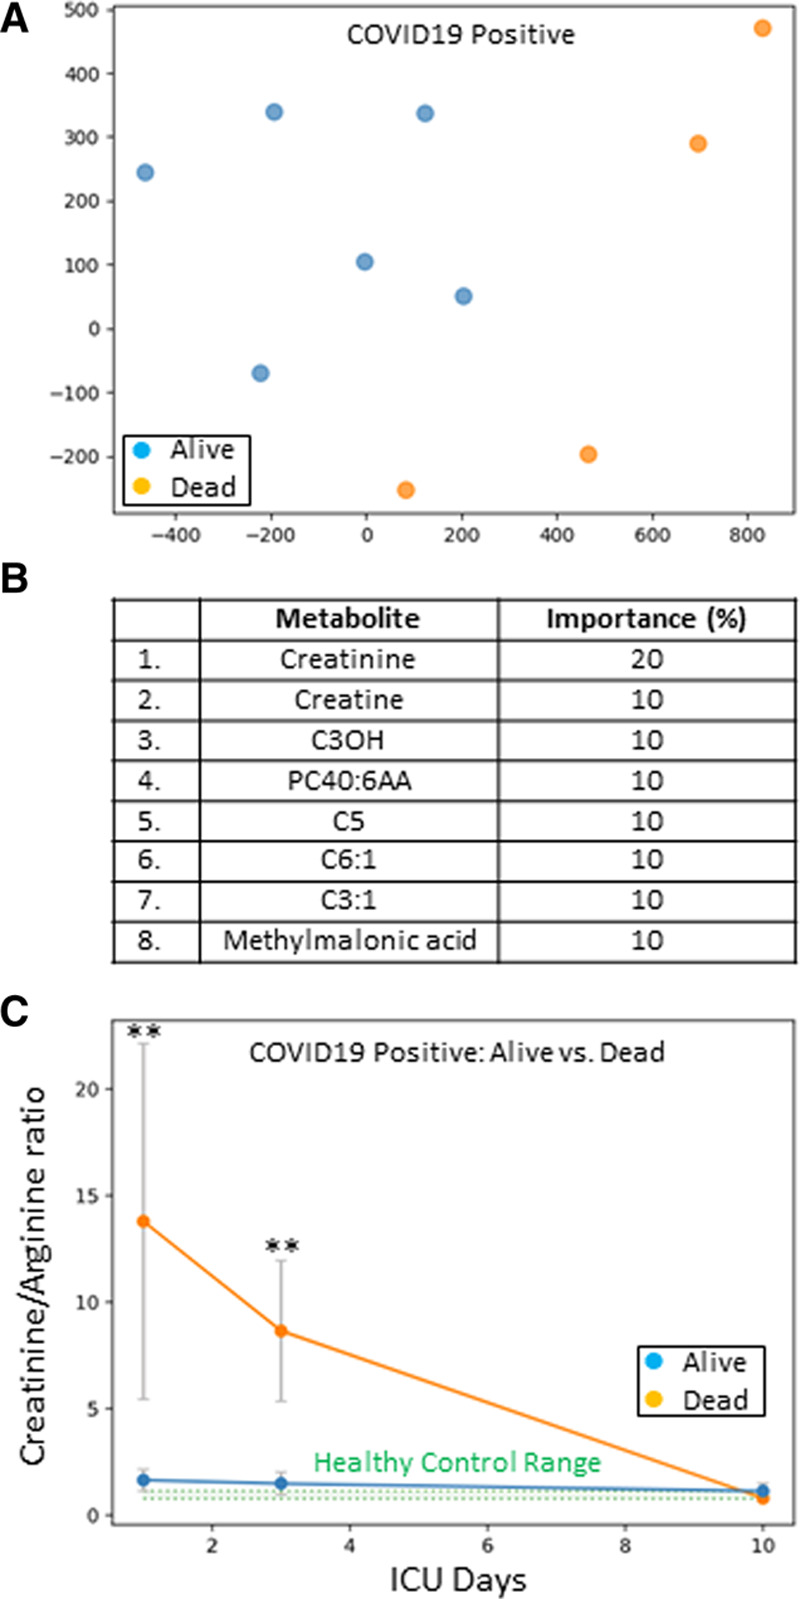
Measurements and main results: Age- and sex-matched healthy controls and ICU patients that were either coronavirus disease 2019 positive or coronavirus disease 2019 negative were enrolled. Cohorts were well balanced with the exception that coronavirus disease 2019 positive patients suffered bilateral pneumonia more frequently than coronavirus disease 2019 negative patients. Mortality rate for coronavirus disease 2019 positive ICU patients was 40%. Feature selection identified the top-performing metabolites for identifying coronavirus disease 2019 positive patients from healthy control subjects and was dominated by increased kynurenine and decreased arginine, sarcosine, and lysophosphatidylcholines. Arginine/kynurenine ratio alone provided 100% classification accuracy between coronavirus disease 2019 positive patients and healthy control subjects (p = 0.0002). When comparing the metabolomes between coronavirus disease 2019 positive and coronavirus disease 2019 negative patients, kynurenine was the dominant metabolite and the arginine/kynurenine ratio provided 98% classification accuracy (p = 0.005). Feature selection identified creatinine as the top metabolite for predicting coronavirus disease 2019-associated mortality on both ICU days 1 and 3, and both creatinine and creatinine/arginine ratio accurately predicted coronavirus disease 2019-associated death with 100% accuracy (p = 0.01).
Conclusions: Metabolomics profiling with feature classification easily distinguished both healthy control subjects and coronavirus disease 2019 negative patients from coronavirus disease 2019 positive patients. Arginine/kynurenine ratio accurately identified coronavirus disease 2019 status, whereas creatinine/arginine ratio accurately predicted coronavirus disease 2019-associated death. Administration of tryptophan (kynurenine precursor), arginine, sarcosine, and/or lysophosphatidylcholines may be considered as potential adjunctive therapies.
Keywords: biomarker; coronavirus disease 2019; diagnoses; intensive care unit; metabolomics; prognoses.
Copyright © 2020 The Authors. Published by Wolters Kluwer Health, Inc. on behalf of the Society of Critical Care Medicine.
Conflict of interest statement
The authors disclosed a patent pending (Metabolomics Profile of Covid19 Patients; #63065966).
Figures
References
-
- Johns Hopkins University & Medicine; Coronavirus Resource Center: COVID-19 Map. Available at: https://coronavirus.jhu.edu/map.html
-
- World Health Organization: WHO Director-General's Opening Remarks at the Media Briefing on COVID-19 - 3 March 2020. Available at: https://www.who.int/dg/speeches/detail/who-director-general-s-opening-re...
LinkOut - more resources
Full Text Sources
Other Literature Sources
