. 2021 Feb 5;31(3):1427-1443.
doi: 10.1093/cercor/bhaa280.

Increased Callosal Connectivity in Reeler Mice Revealed by Brain-Wide Input Mapping of VIP Neurons in Barrel Cortex

Affiliations

Increased Callosal Connectivity in Reeler Mice Revealed by Brain-Wide Input Mapping of VIP Neurons in Barrel Cortex

Georg Hafner et al. Cereb Cortex. .

Abstract

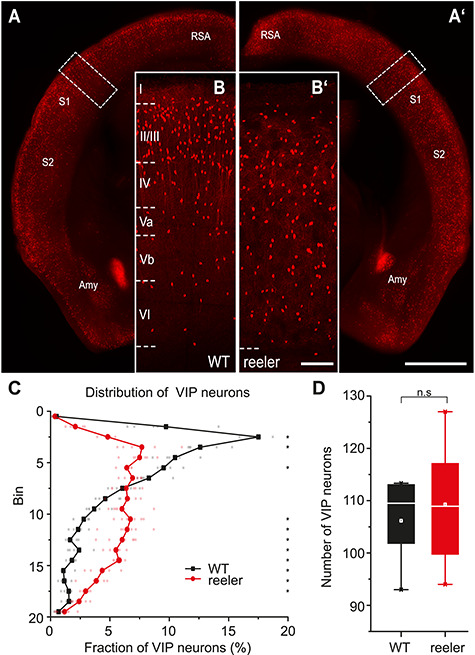
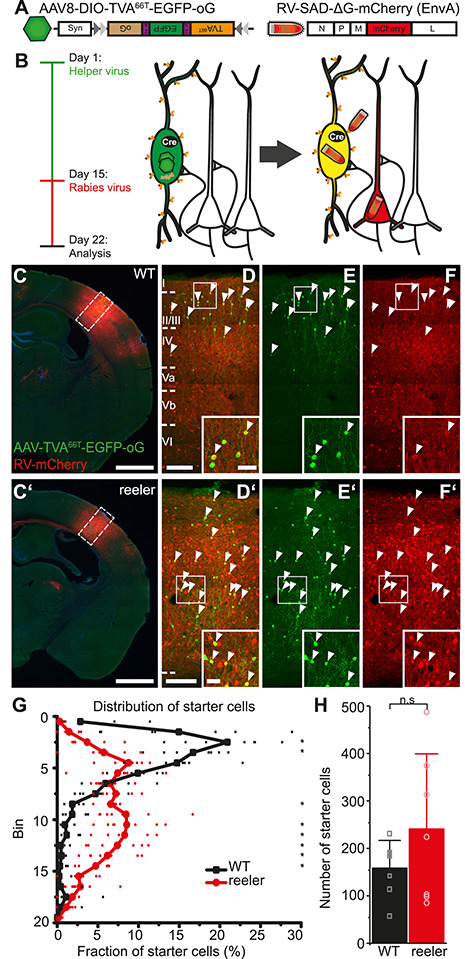
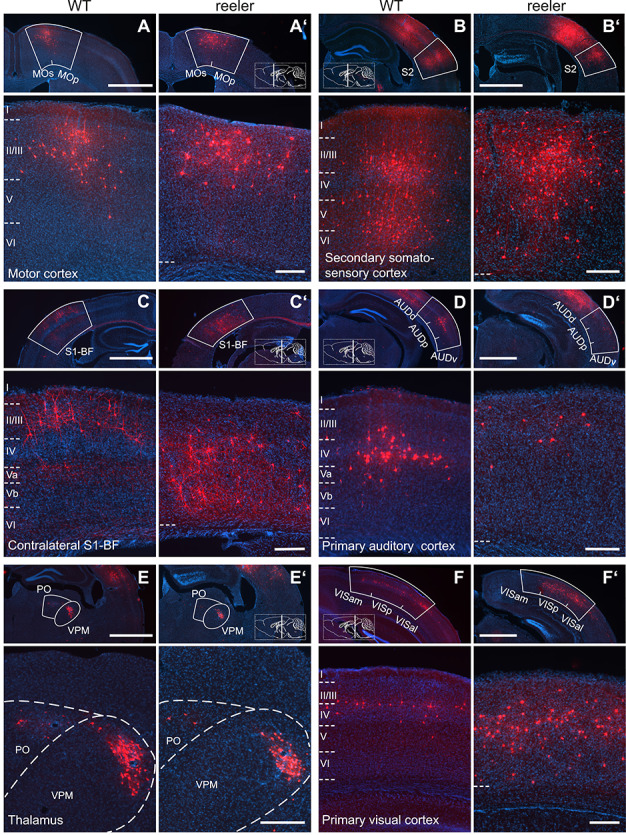
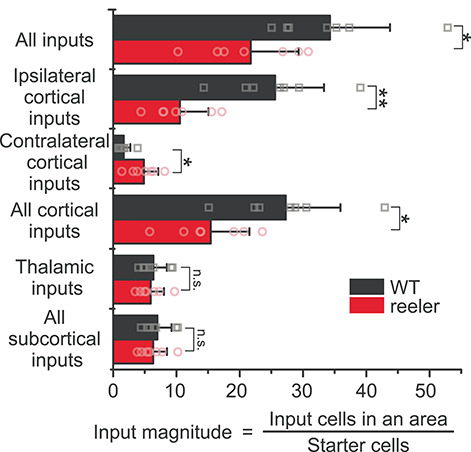
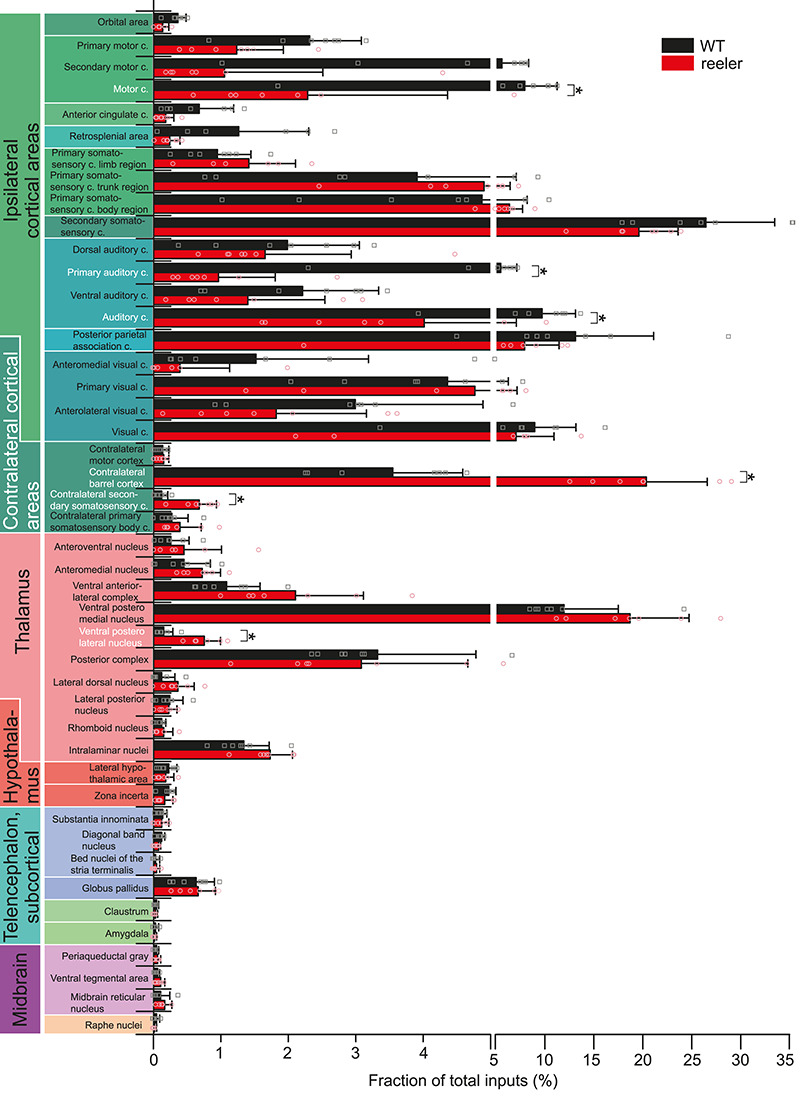
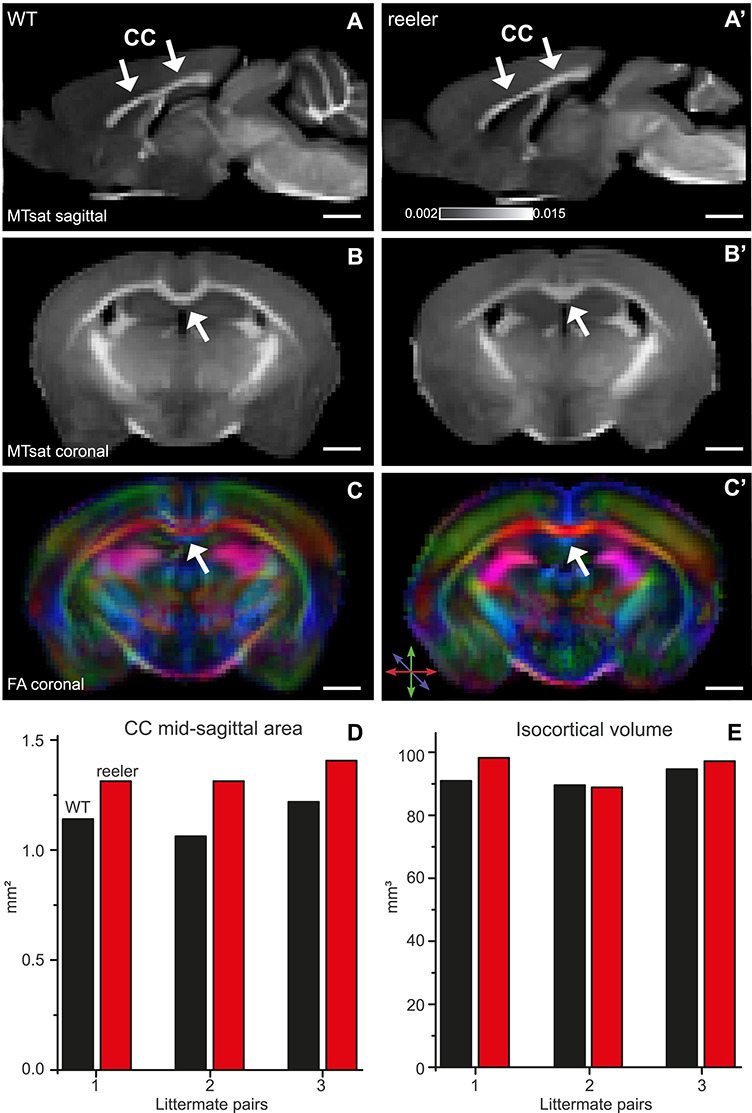
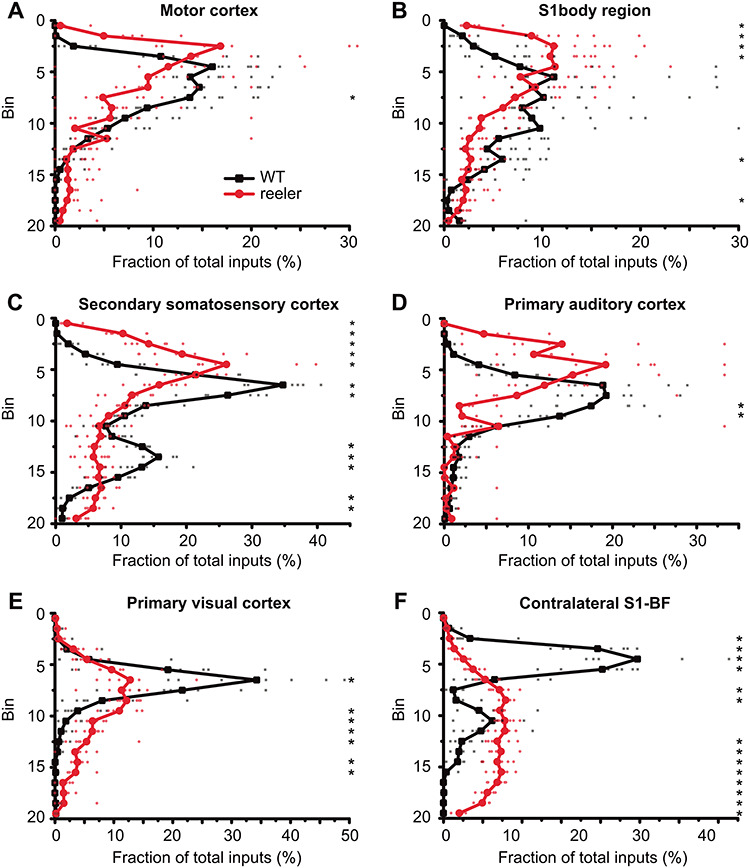
The neocortex is composed of layers. Whether layers constitute an essential framework for the formation of functional circuits is not well understood. We investigated the brain-wide input connectivity of vasoactive intestinal polypeptide (VIP) expressing neurons in the reeler mouse. This mutant is characterized by a migration deficit of cortical neurons so that no layers are formed. Still, neurons retain their properties and reeler mice show little cognitive impairment. We focused on VIP neurons because they are known to receive strong long-range inputs and have a typical laminar bias toward upper layers. In reeler, these neurons are more dispersed across the cortex. We mapped the brain-wide inputs of VIP neurons in barrel cortex of wild-type and reeler mice with rabies virus tracing. Innervation by subcortical inputs was not altered in reeler, in contrast to the cortical circuitry. Numbers of long-range ipsilateral cortical inputs were reduced in reeler, while contralateral inputs were strongly increased. Reeler mice had more callosal projection neurons. Hence, the corpus callosum was larger in reeler as shown by structural imaging. We argue that, in the absence of cortical layers, circuits with subcortical structures are maintained but cortical neurons establish a different network that largely preserves cognitive functions.

Keywords: VIP neurons; barrel cortex; corpus callosum; rabies tracing; reelin.


Figures

Figure 1
Figure 1
Distribution of VIP cells is different between WT and reeler mice. (A, A’) Coronal sections at the level of the barrel cortex of WT and reeler mice in which VIP neurons are labeled with tdTomato. The areal/nuclear locations of VIP expression remained the same in WT and reeler (scale bar: 1000 μm; Amy, amygdala; RSA, retrosplenial agranular cortex; S1/S2, primary/secondary somatosensory cortex). (B, B′) Close-up of barrel cortex area in WT and reeler mice (insert in A, A’). In WT, VIP neurons showed a stronger bias toward upper layers (II–IV). In reeler, VIP neurons were uniformly dispersed across the cortical thickness (scale bar: 100 μm). (C) Distribution of VIP neurons across the cortical depth. In WT, they showed a prominent peak in the upper layers. In reeler, they were fairly uniformly distributed, with few neurons close to pia and white matter (n = 5 WT mice, 6 reeler mice; 6 sections for each mouse; symbols connected by lines show average; small, transparent symbols show individual animals; asterisks highlight significantly different fractions per bin between genotypes with P < 0.05). (D) Number of VIP neurons counted on 40-μm-thick sections in an area of barrel cortex spanning from pia to white matter and being 1000 μm wide (n = 5 WT mice, 6 reeler mice; 6 sections each mouse; box plot: white line = median; white dot = mean). Counts were almost the same in WT and reeler (P > 0.05).
Figure 2
Figure 2
RV tracing in VIP-Cre mice is based on a different distribution and number of VIP starter cells in WT and reeler mice. (A) Viral constructs for RV tracing. TVA66T is a mutated version of TVA, to which EnvA in the RV envelope has a reduced affinity. This ensures that low-level Cre-independent TVA expression does not permit RV entry into cells. oG is the optimized rabies glycoprotein necessary for transsynaptic spread. (B) Injection of Cre-dependent helper AAV on day 1 induces high expression of TVA66T and oG only in VIP cells. RV-mCherry pseudotyped with TVA-ligand EnvA is injected 14 days later to infect VIP neurons and spread from there to first-order presynaptic neurons using oG. Seven days later, starter VIP cells appear yellow due to the mixture of fluorophores; presynaptic neurons have solely mCherry. (C, C’) Coronal sections through an injection site in the barrel cortex of WT and reeler mice (scale bar: 1000 μm). (D/D’–F/F’) Inserts in C, C’. Cells marked by white arrowheads are double-labeled starter cells that have been co-transduced by AAV-TVA66T-EGFP-oG and RV-mCherry. Inserts at the bottom show some of these cells in higher resolution. Exclusively RV-mCherry-positive cells represent local inputs, presynaptic to the starter cells, forming an extremely dense network of cell bodies and neuropil at the injection site (scale bar overview: 100 μm; scale bar insert: 20 μm). (G) Distribution of starter cells across the cortical depth. Cortical thickness was divided into 20 equal-sized bins. The proportion of starter cells in each bin was plotted. While in WT starter cells were predominantly in the upper third, starter cells in reeler were much more dispersed (n = 7 per group; symbols connected by lines show average; small, transparent symbols show individual animals; asterisks highlight significantly different fractions per bin between genotypes with P < 0.05). (H) Number of starter cells in each genotype. (n = 7 per group; mean ± SD, symbols show individual animals; P > 0.05).
Figure 3
Figure 3
Long-range input to VIP cells in barrel cortex of WT and reeler mice. (A/A’–F/F’) Sections along the rostrocaudal extent of WT and reeler mice showing consistently labeled areas with presynaptic partners of VIP cells in barrel cortex. In the top overview panels, the white contour delineates the borders of the respective source area. Higher magnification close-ups are shown below. Section planes are indicated on the schematic sagittal brain section (scale bar overview: 1000 μm; scale bar close-up: 200 μm; AUDd/AUDp/AUDv, dorsal/primary/ventral auditory area; MOp/MOs, primary/secondary motor cortex; PO, posterior complex of the thalamus; S1-BF, primary somatosensory cortex, barrel field; S2, secondary somatosensory cortex; VISal/VISam/VISp, anterolateral/anteromedial/primary visual area; VPM, ventral posteromedial nucleus of the thalamus).
Figure 4
Figure 4
Input magnitude from global cortical and subcortical areas highlights a cortical phenotype. Histograms representing the input magnitude from summed-up cell counts of brain areas. Reeler mice received overall less input per cell, which was due to less input from the ipsilateral cortex. Input from the contralateral hemisphere was increased in reeler, whereas subcortical input remained unaffected (n = 7 per group; mean ± SD; symbols show individual animals; *P < 0.05, **P < 0.01, n.s. P > 0.05).
Figure 5
Figure 5
Comparative analysis of the input fraction from individual brain areas. Mean proportion of RV-labeled cells in 41 individual areas normalized against the total number of inputs in the whole brain for the two genotypes. For motor cortex, primary somatosensory cortex body region, auditory cortex, and visual cortex, the summated proportions of the individual subareas are shown as well. Pairwise comparisons were carried out to assess differences in input fraction for individual areas (n = 7 per group; mean ± SD; symbols show individual animals; *P < 0.05; c, cortex).
Figure 6
Figure 6
MRI reveals a larger and differently shaped CC (arrows) in reeler. (A, A’) Sagittal maps of MTsat of WT and reeler mice brain acquired ex vivo. These maps were used to determine the dimensions of the CC. (B, B’) Coronal MTsat map of WT versus reeler mice. At the midline, the CC showed a different geometry between genotypes. In reeler mice, the characteristic curvature of WT mice was absent so that the top of the CC appeared flattened. (C, C’) FA maps show the color-coded directionality of fibers. Because fibers of the CC run in the mediolateral direction, they could be distinguished from whiter matter bundles more dorsally or more ventrally that run in the rostrocaudal direction. (D) Midsagittal area of the CC of individual WT and reeler mice compared between littermate pairs. In each pair, the reeler mouse had a larger area, probably indicating that it is composed of a higher number of callosal fibers. (E) Total isocortical volume of individual WT and reeler mice compared between littermate pairs. The volume was almost the same, except for one pair in which the reeler mouse showed a slightly higher volume.
Figure 7
Figure 7
Distribution of projection neurons in cortical input areas. (AF) The thickness of the cortex was divided into 20 equal-sized bins. We plotted the fraction of inputs in a bin normalized against the total inputs of VIP cells from this area. In ipsilateral areas, the distribution of projection neurons had one peak that was usually shifted more superficially in reeler, except for visual cortex where the peak was just broader. The distribution of contralateral projection neurons from the barrel cortex was very different, with neurons in WT being mostly located in the upper third, while in reeler predominantly in the lower two thirds of the cortex (n = 7 per group; symbols connected by lines show average; small, transparent symbols show individual animals; asterisks highlight significantly different fractions per bin between genotypes with P < 0.05; S1, primary somatosensory cortex; BF, barrel field).

Similar articles

Cited by

References

    1. Ährlund-Richter S, Xuan Y, Anna van Lunteren J, Kim H, Ortiz C, Pollak Dorocic I, Meletis K, Carlén M. 2019. A whole-brain atlas of monosynaptic input targeting four different cell types in the medial prefrontal cortex of the mouse. Nat Neurosci. 22:657–668. - PubMed
    1. Andersson JLR, Sotiropoulos SN. 2016. An integrated approach to correction for off-resonance effects and subject movement in diffusion MR imaging. Neuroimage. 125:1063–1078. - PMC - PubMed
    1. Avants BB, Tustison NJ, Song G, Cook PA, Klein A, Gee JC. 2011. A reproducible evaluation of ANTs similarity metric performance in brain image registration. Neuroimage. 54:2033–2044. - PMC - PubMed
    1. Badea A, Nicholls PJ, Johnson GA, Wetsel WC. 2007. Neuroanatomical phenotypes in the reeler mouse. Neuroimage. 34:1363–1374. - PMC - PubMed
    1. Basser PJ, Mattiello J, LeBihan D. 1994. MR diffusion tensor spectroscopy and imaging. Biophys J. 66:259–267. - PMC - PubMed

Publication types

Substances