. 2021 May 3;31(4):391-409.
doi: 10.1093/glycob/cwaa100.

Investigation of acidic free-glycans in urine and their alteration in cancer

Affiliations

Investigation of acidic free-glycans in urine and their alteration in cancer

Ken Hanzawa et al. Glycobiology. .

Abstract

Alterations to glycans in cancer patients have been used to identify novel tumor biomarkers. Most of these studies have focused on protein glycosylation but less attention has been paid to free-glycans. Here, we analyzed acidic free-glycans in the urine of cancer patients to identify novel tumor marker candidates. Specifically, urine samples were collected from patients with gastric cancer, pancreatic cancer and cholangiocarcinoma as well as normal controls. The free-glycans were extracted from creatinine-adjusted urine and fluorescently labeled with 2-aminopyridine. Initially, we performed profiling of urinary free-glycans by high-performance liquid chromatography and mass spectrometry with enzymatic and chemical degradation. More than 100 glycans, including novel structures, were identified. The chromatographic peaks suggested some of these glycans were present at elevated levels in cancer patients. To verify cancer-associated alterations, we compared the glycan levels between cancer patients and normal controls by selected reaction monitoring. Representative structures of glycans with elevated levels in cancer patients included the following: small glycans related to sialyllactose; sialyl Lewis X; lactose- and N-acetyllactosamine (LacNAc) type-II-core glycans with LacNAc (type-I or II)-extensions and modifications of α1,3/4-fucose and/or 6-sulfate on the Glc/GlcNAc; free-N-glycans containing sialylation or β1,6-branch of 6-sulfo Lewis X; novel NeuAcα2-3Galβ1-4(+/-Fucα1-3) Xylα1-3Glc glycans. Our results provide further insight into urinary free-glycans and suggest the potential utility of these compounds as tumor markers.

Keywords: HPLC; SRM; cancer; free glycan; urine.


Figures

Fig. 1
Fig. 1
Normal phase chromatogram of PA-labeled free-glycans prepared from urine. Free-glycans in creatinine-adjusted urine from normal controls and cancer patients were labeled with PA and checked by normal phase HPLC. The amount of urine sample corresponded to 1 μg of creatinine. Chromatograms of 21 cases of normal controls (designated as N1–N21) together with representative cases of patients with gastric cancer (three cases; G8, G11 and G12), pancreatic cancer (two cases; P3 and P9) and cholangiocarcinoma (one case; C2) are shown.
Fig. 2
Fig. 2
HPLC fractionation of urinary glycans. The PA-labeled glycans were sequentially fractionated by anion-exchange HPLC and normal phase HPLC. The representative chromatograms from a normal control (N8) are shown. (A) The elution profile of anion-exchange HPLC. PA-glycans were separated on a TSK-gel DEAE-5PW column and the acidic fraction was collected. Arrowheads S0–S4 indicate the elution positions of standard PA-N-glycans with 0–4 neuraminic acids (NeuAc). (B) The elution profile of normal phase HPLC. The acidic fraction from anion-exchange HPLC was fractionated in the range of GU1.4–8.7 on a TSK-gel Amide-80 column.
Fig. 3
Fig. 3
Reversed phase HPLC profiles of the urinary acidic free-glycans. PA-labeled free glycans fractionated by normal phase HPLC were further separated by reversed phase HPLC on a TSK-gel ODS-80Ts column. The amount of urine sample corresponded to 16 μg of creatinine. Representative overlaid chromatograms are shown from six normal controls (N5–N8, N11 and N14), black line; three gastric cancer patients (G8, G11 and G12), blue dotted line; two pancreatic cancer patients (P3 and P9) and one cholangiocarcinoma patient (C2), red dotted line. The major glycans comprising the fluorescent peaks are indicated as numbers. Estimated structures of the numbered glycans are shown in Table II in accordance with their basal structure and in supplementary data (Supplementary Table SII) in numerical order. X indicate peaks mainly composed of non-PA-glycan fluorescent materials. (A) The chromatograms of Fr 1–4, which contained more abundant glycans, are shown at a lower magnification of ×0.1. (B) The chromatograms of Fr 1–Fr 12.
Fig. 3
Fig. 3
Reversed phase HPLC profiles of the urinary acidic free-glycans. PA-labeled free glycans fractionated by normal phase HPLC were further separated by reversed phase HPLC on a TSK-gel ODS-80Ts column. The amount of urine sample corresponded to 16 μg of creatinine. Representative overlaid chromatograms are shown from six normal controls (N5–N8, N11 and N14), black line; three gastric cancer patients (G8, G11 and G12), blue dotted line; two pancreatic cancer patients (P3 and P9) and one cholangiocarcinoma patient (C2), red dotted line. The major glycans comprising the fluorescent peaks are indicated as numbers. Estimated structures of the numbered glycans are shown in Table II in accordance with their basal structure and in supplementary data (Supplementary Table SII) in numerical order. X indicate peaks mainly composed of non-PA-glycan fluorescent materials. (A) The chromatograms of Fr 1–4, which contained more abundant glycans, are shown at a lower magnification of ×0.1. (B) The chromatograms of Fr 1–Fr 12.
Fig. 4
Fig. 4
Structural analysis of PA-glycans by two-dimensional HPLC mapping. The elution positions of PA-glycans on HPLCs of normal phase and reversed phase were standardized into glucose units (GU). Red circles and asterisks indicate the elution positions of the sample glycans and the standard glycans, respectively. The structures designated as #a1–a4, b1–b4, c1–c7 and d1–d4 are the digested glycans and standard glycans, which were not detected as their forms in the analysis. Solid arrows indicate shifts of the elution positions of the glycans by glycosidases. Dotted arrows with “M-Lys” indicate shifts by methanolysis. The glycosidases used were as follows: 3SiaSt, α-neuraminidase under the conditions for nonreducing terminal α2,3-linkages (from S. typhimurium); tSiaSt, α-neuraminidase for nonreducing terminal α2,3/6-linkages (from S. typhimurium); βGuPv, β-glucuronidase (from P. vulgata); βGalEc, β-galactosidase for PA-disaccharides (from E. coli); βGalXm, β-galactosidase with specificity for β1,3 > 6 > 4 (from X. manihotis); βGalSp, β1,4-galactosidase (from S. pneumoniae); FucBk, α-fucosidase (from bovine kidney); 2FucXm, α1,2-fucosidase (from X. manihotis); 34FucSm, α1,3/4-fucosidase (from Streptomyces sp. 142); bHnSm, β-1,3/4/6-N-acetylhexosaminidase (from S. plicatus); LnbSm, lacto-N-biosidase (from Streptomyces sp. 142); and aXylEc, α-xylosidase (from E. coli). (A) Representative small lactose-core glycans. (B) Representative LacNAc extended lactose-core glycans containing Lewis A and Lewis X. (C) Lactose-core glycans with branches of LacNAc-extensions (lacto-N-neohexaose backbone). (D) The Xyl-Glc-core glycan #50 and #60. The digestions suggested partial structural information of NeuAcα2-3Galβ1-Xylα1-Glc-PA with/without α3/4-fucosylation on the xylose residue.
Fig. 5
Fig. 5
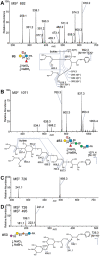
Structural analysis of PA-glycans by MSn after periodate cleavage. PA-glycans were oxidatively cleaved with sodium periodate and reduced with sodium borohydride. The products were analyzed by MSn. (A) Positive mode MS2 spectrum of the cleaved product of PA-glycan #6 from the protonated ion with triethylamine at m/z 692. (B) Negative mode MS2 spectrum of the product of sulfated and fucosylated free-N-glycan #83 from the de-protonated ion at m/z 1171, suggesting 6-sulfo-Lewis X linked to α1,6-Man-arm by β1,6-branching. (C and D) MSn analysis of the Xyl-Glc-core glycan #50, revealing the partial sequence information of NeuAc2-3Hex1-4Pen1-3Hex-PA. (C) Positive mode MS2 spectrum of the product of #50 from the protonated ion at m/z 726. (D) MS3 spectrum of the B-ion composed of C2H2O-tetrose-PA at m/z 241 from MS2 of #50.
Fig. 6
Fig. 6
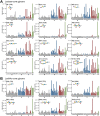
Levels of representative free-glycans in the urine from SRM analysis. The amount of urine sample corresponded to 8 μg of creatinine, but exceptionally 0.8 μg of creatinine for glycans #10, #24, #32, #34, #40, #50 and #52. The peak areas in the extracted ion chromatogram (XIC) of SRM measurements are shown. The levels of the glycans are indicated by bars as follows: normal controls (N1–21), gray; gastric cancer patients (G1–13), blue; pancreatic cancer patients (P1–10), red; and cholangiocarcinoma patients (C1–4), light green. In each glycan panel, glycan number, estimated structure and the mass values of Q1 are indicated. Also, the values of Q1 and Q3 are shown in Supplementary Table SIII. (A) Lactose-core glycans #6, #24, #35, #38, #39, #58, #70, #84, #85, #89, #112 and #118 are shown. (B) LacNAc-core glycans #32, #40, #43, #67, #98 and #100 are shown. (C) Free-N-glycans #76, #83, #91, #92, #102, #105, #106, #108 and #124 are shown. (D) Mucin-type free-glycans #52 and #94 are shown. (E) Xyl-Glc-core glycans #50 and #60 are shown. (F) Other uronylated glycans #10, #74 and #95 are shown.
Fig. 6
Fig. 6
Levels of representative free-glycans in the urine from SRM analysis. The amount of urine sample corresponded to 8 μg of creatinine, but exceptionally 0.8 μg of creatinine for glycans #10, #24, #32, #34, #40, #50 and #52. The peak areas in the extracted ion chromatogram (XIC) of SRM measurements are shown. The levels of the glycans are indicated by bars as follows: normal controls (N1–21), gray; gastric cancer patients (G1–13), blue; pancreatic cancer patients (P1–10), red; and cholangiocarcinoma patients (C1–4), light green. In each glycan panel, glycan number, estimated structure and the mass values of Q1 are indicated. Also, the values of Q1 and Q3 are shown in Supplementary Table SIII. (A) Lactose-core glycans #6, #24, #35, #38, #39, #58, #70, #84, #85, #89, #112 and #118 are shown. (B) LacNAc-core glycans #32, #40, #43, #67, #98 and #100 are shown. (C) Free-N-glycans #76, #83, #91, #92, #102, #105, #106, #108 and #124 are shown. (D) Mucin-type free-glycans #52 and #94 are shown. (E) Xyl-Glc-core glycans #50 and #60 are shown. (F) Other uronylated glycans #10, #74 and #95 are shown.

Similar articles

Cited by

References

    1. Alley WR Jr, Vasseur JA, Goetz JA, Svoboda M, Mann BF, Matei DE, Menning N, Hussein A, Mechref Y, Novotny MV. 2012. N-linked glycan structures and their expressions change in the blood sera of ovarian cancer patients. J Proteome Res. 11:2282–2300. - PMC - PubMed
    1. Arnold JN, Saldova R, Galligan MC, Murphy TB, Mimura-Kimura Y, Telford JE, Godwin AK, Rudd PM. 2011. Novel glycan biomarkers for the detection of lung cancer. J Proteome Res. 10:1755–1764. - PubMed
    1. Bengtson P, Ng BG, Jaeken J, Matthijs G, Freeze HH, Eklund EA. 2016. Serum transferrin carrying the xeno-tetrasaccharide NeuAc-gal-GlcNAc2 is a biomarker of ALG1-CDG. J Inherit Metab Dis. 39:107–114. - PMC - PubMed
    1. Biskup K, Braicu EI, Sehouli J, Fotopoulou C, Tauber R, Berger M, Blanchard V. 2013. Serum glycome profiling: A biomarker for diagnosis of ovarian cancer. J Proteome Res. 12:4056–4063. - PubMed
    1. Björndal H, Lundblad A. 1970. Structure of two urinary oligosaccharides characteristic of blood group O(H)- and B-secretors. Biochim Biophys Acta. 201:434–437. - PubMed

Publication types