. 2021 Jun 9;37(9):1234-1245.
doi: 10.1093/bioinformatics/btaa947.

Inferring TF activities and activity regulators from gene expression data with constraints from TF perturbation data

Affiliations

Inferring TF activities and activity regulators from gene expression data with constraints from TF perturbation data

Cynthia Z Ma et al. Bioinformatics. .

Abstract

Motivation: The activity of a transcription factor (TF) in a sample of cells is the extent to which it is exerting its regulatory potential. Many methods of inferring TF activity from gene expression data have been described, but due to the lack of appropriate large-scale datasets, systematic and objective validation has not been possible until now.

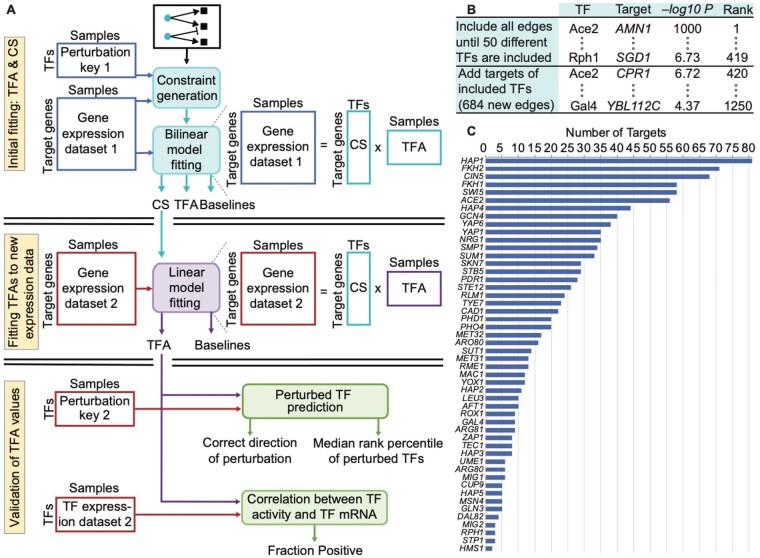
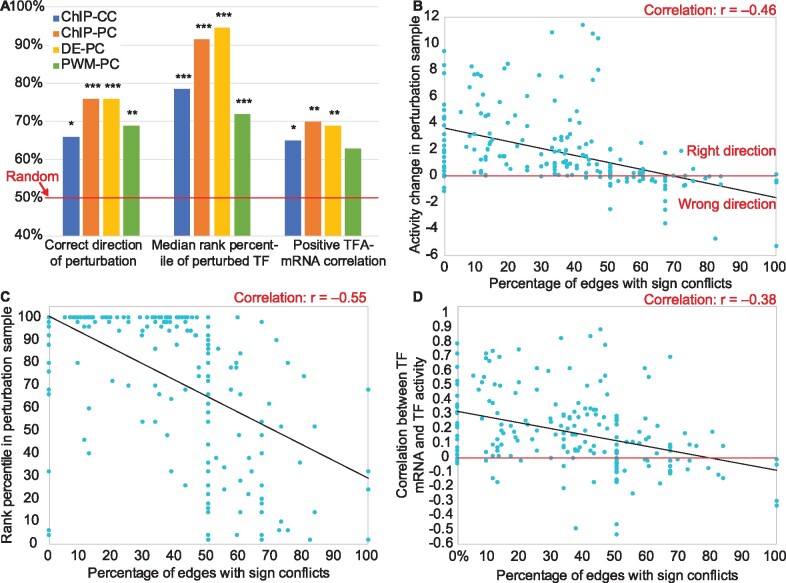
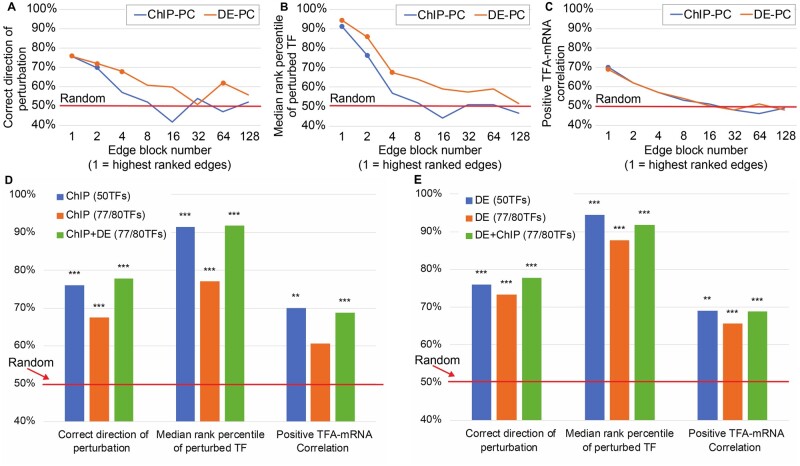
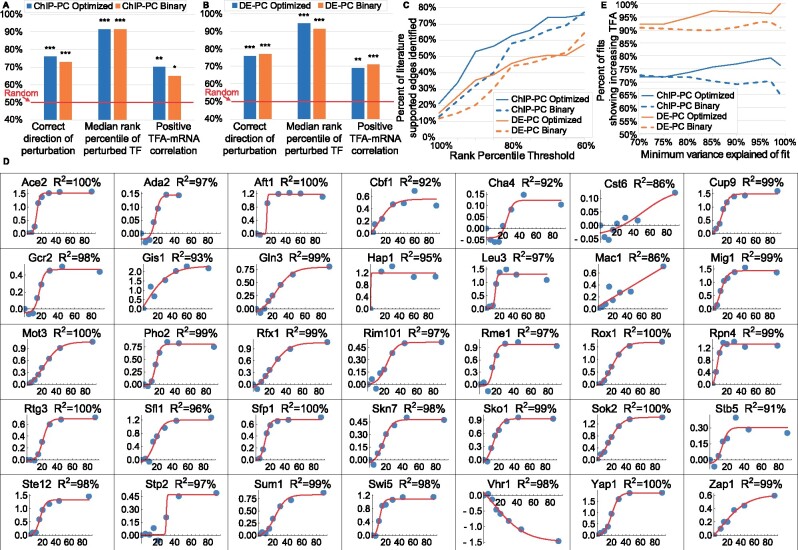
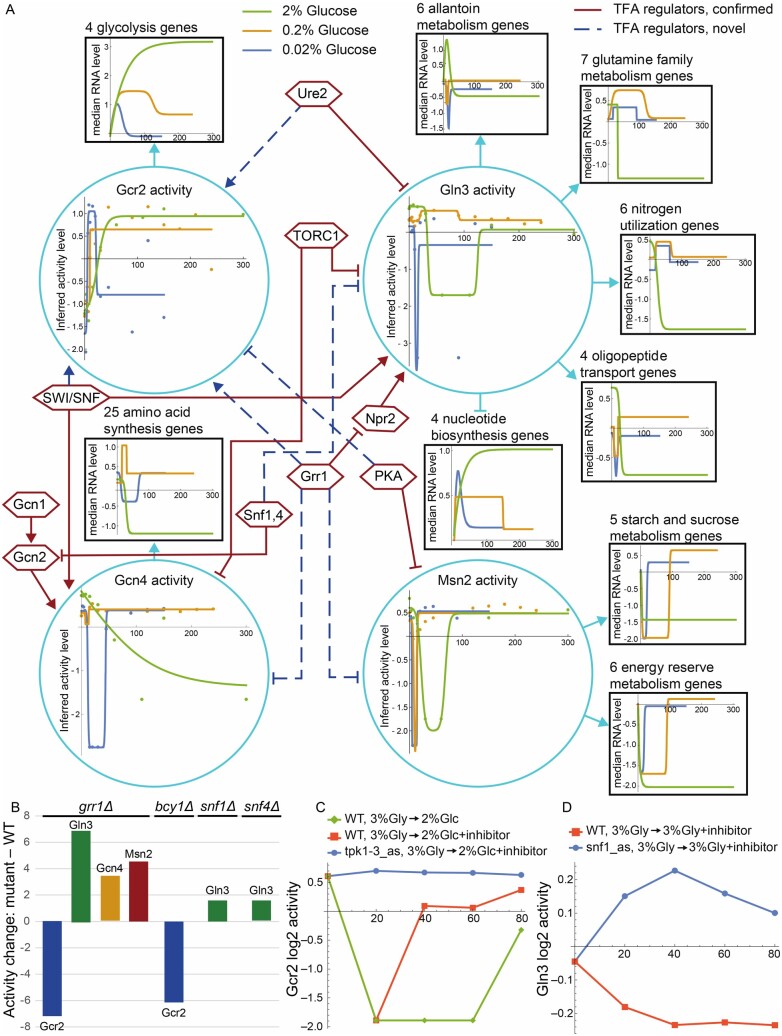
Results: We systematically evaluate and optimize the approach to TF activity inference in which a gene expression matrix is factored into a condition-independent matrix of control strengths and a condition-dependent matrix of TF activity levels. We find that expression data in which the activities of individual TFs have been perturbed are both necessary and sufficient for obtaining good performance. To a considerable extent, control strengths inferred using expression data from one growth condition carry over to other conditions, so the control strength matrices derived here can be used by others. Finally, we apply these methods to gain insight into the upstream factors that regulate the activities of yeast TFs Gcr2, Gln3, Gcn4 and Msn2.

Availability and implementation: Evaluation code and data are available at https://doi.org/10.5281/zenodo.4050573.

Supplementary information: Supplementary data are available at Bioinformatics online.


Figures

Fig. 1.
Fig. 1.
Evaluation framework and ChIP-based network construction. (A) Overview of three-stage model fitting and TFA evaluation procedure. Gene expression levels and the perturbation key from dataset 1 are used only in the initial fitting. The CSs inferred in the initial fitting are fixed while the TFAs and baselines are refit to the target gene expression levels from dataset 2. The mRNA levels of the TFs and the perturbation key from dataset 2 are used only for evaluation. (B) Illustration of how edges were selected for the ChIP-based network. All edges were ranked according to their −log P-value for the TF binding in the promoter of the target. Edges were selected in rank order until there was at least one edge from 50 different TFs. Lower-ranked edges were then selected for those TFs until rank 1,250. After initial model construction, we removed any TFs with a single target and any set of TFs with identical targets, along with those targets. We then returned to the list and iteratively added edges that had previously been passed over until the network stabilized at 50 TFs. This yielded a network with 1,104 edges. (C) The number of targets for each of the 50 different TFs in the ChIP network.
Fig. 2.
Fig. 2.
Determinants of TFA inference accuracy. (A) Effects of network construction and constraint generation on TFA accuracy. Blue: ChIP network with correlation-based constraints. Orange: ChIP network with perturbation-based constraints. Yellow: Differential expression network with perturbation-based constraints. Green: Binding-specificity (PWM) network with perturbation-based constraints. Asterisks above the bars indicate magnitude of significance compared to a random model, with 1, 2 or 3 asterisks representing P-value thresholds of 0.01, 0.001 or 0.0001. (B) Vertical axis: The activity of each TF in the sample in which it was perturbed minus its activity in the unperturbed sample, oriented so that higher is better. TFs plotted below the horizontal axis have been inferred to change activity in the wrong direction. Horizontal axis: The fraction of each TF’s targets for which the TFKO and ZEV datasets suggest conflicting CS signs. TFs with <50% conflict edges are almost all predicted in the correct direction, while most TFs with >50% conflict edges are not. (C) Vertical axis: Rank percentile of the perturbed TF’s activity change in each perturbation sample (higher is better). Horizontal axis: Same as (B). TFs with a higher percentage of conflict edges tend to be ranked lower. (D) Vertical axis: median fraction of bootstrap samples in which a TF’s mRNA level and its inferred activity level are positively correlated (see main text). TFs with a higher percentage of conflicting edges tend to have low or negative correlation. (B–D) Results from the 50-TF ChIP-PC and DE-PC networks, trained on each of the datasets and tested on the other, have been combined, but each individual set of 50 points showed similar, highly significant correlations
Fig. 3.
Fig. 3.
Effects of increasing the number of network TFs on accuracy. (A–C) Accuracy metrics for networks constructed from the ChIP or DE edge lists by taking successively lower ranked edges. Edges were divided into blocks of 2,000 and blocks are plotted in an exponential series. For example, Block 1 is edges ranked 1–2,000 and Block 4 is edges ranked 6,001–8,000. Points are plotted for results that are significantly better than random (P < 0.001). (A) Percent of TFs whose direction of perturbation is predicted correctly. (B) Median rank percentile of the perturbed TF. (C) Percent of TFs with a positive TF-mRNA correlation. In A and B, the ChIP-PC performance starts out similar to DE-PC, but it drops faster, to no better than random in any measure by Block 4. (D) Comparison of two ways of increasing the number of TFs in the network—going further down the list of ChIP edges or using 50-TF ChIP and DE networks and averaging standardized TFAs of TFs that are in both networks. Consistent with A–C, performance degrades when lower ranked edges are included in the ChIP network. Inferring TFAs separately and averaging them, by contrast, yields performance on a larger network that is as good as performance on the smaller, 50-TF networks. (E) Same as D, but blue and orange bars are for DE networks
Fig. 4.
Fig. 4.
Impact of using a CS matrix optimized on a different dataset versus using a signed binary CS matrix. (A) ChIP-PC network. (B) DE-PC network. (C) Percent of literature-supported edges between TFA regulators and TFs identified, as a function of minimum rank percentile for identification. Solid lines: CS matrix optimized on the ZEV dataset and used to infer TFAs in the samples in which a TF regulator was deleted. Dashed lines: Signed binary CS matrix. For TFs whose change in standardized log activity from WT ranks above 85th percentile, more literature supported edges are identified by using optimized CS matrices than by using signed binary matrices. (D) Sigmoidal fits to log2 fold change of TFAs inferred for the ZEV time course data, using the DE-PC network and a CS matrix optimized on the TFKO dataset, relative to the 0 min timepoint. Only fits with variance explained above 85% are shown. In all but one of the 35 fits, TF activity is correctly inferred to be increasing (97%). Only Vhr1 activity is inferred to change in the wrong direction, probably because 9 of its 11 targets have sign conflict (80%, see Fig. 2B–D). (E) After fitting sigmoidal curves as in D and imposing various thresholds on the variance explained by the fit, the percentage of fits that correctly show increasing activity. The DE-PC network (orange lines) performs better than the ChIP-PC network (blue lines). For each network, using a CS matrix optimized on the TFKO data (solid lines) generally shows better performance than using a signed binary CS matrix (dashed lines), and this effect increases as the variance explained by the sigmoidal fits increases
Fig. 5.
Fig. 5.
Gcr2, Gln3, Gcn4 and Msn2, their activity regulators, activity changes in response to different glucose concentrations, target gene sets and target set expression patterns. (A) Turquoise circles: Changes in inferred TF activity after addition of 2% glucose to post-diauxic-shift shake-flasks with synthetic complete medium (green) or addition of 0.2% (gold) or 0.02% (blue) glucose to cultures grown in galactose-limited chemostats with minimal medium. Points are log2 of inferred activity level and lines are impulse or sigmoidal fits to the points, chosen by the Bayes Information Criterion. Black boxes: Sets of target genes that are regulated in the same direction and are annotated to a Gene Ontology or KEGG term enriched among targets of the TF that regulates them. Arrowheads indicate activation and T-heads repression. Colored lines are impulse or sigmoidal fits to the median log2 fold-change of the annotated genes at each time point, relative to time 0. Hexagons: TF activity regulators inferred from analysis of two datasets as described in the text. Solid maroon lines indicate clear literature support while dashed blue lines indicate hypothesized novel edges. (B) Change in activity of TFs in response to deletion of GRR1, BCY1 (inhibitory subunit of PKA), SNF1 or SNF4 (activating subunit of Snf1 complex). (C) Gcr2 activity after addition of 2% glucose to cells growing on 3% glycerol. In wild-type cells, glucose initially reduces Gcr2 activity (green, orange). (This response is different from Gcr2’s response to glucose under the conditions of Fig. 5A.) Addition of the Tpk1-3 inhibitor with glucose to analog-sensitive cells (blue) eliminates that response, suggesting that PKA represses Gcr2 activity. This is consistent with the observation that deletion of BCY1 reduces Gcr2 activity in 2% glucose (B). (D) Gln3 activity is slightly elevated when inhibitor is added to cells growing in 3% glycerol and expressing an analog-sensitive Snf1 (blue), relative to WT cells (orange), suggesting that the Snf1,4 complex represses Gln3 activity. This is consistent with the observation that deletion of either Snf1 or Snf4 increases Gln3 activity in 2% glucose (B)

Similar articles

Cited by

References

    1. Alvarez M.J. et al. (2016) Functional characterization of somatic mutations in cancer using network-based inference of protein activity. Nat. Genet., 48, 838–847. - PMC - PubMed
    1. Apweiler E. et al. (2012) Yeast glucose pathways converge on the transcriptional regulation of trehalose biosynthesis. BMC Genomics, 13, 239. - PMC - PubMed
    1. Arrieta-Ortiz M.L. et al. (2015) An experimentally supported model of the Bacillus subtilis global transcriptional regulatory network. Mol. Syst. Biol., 11, 839. - PMC - PubMed
    1. Azofeifa J.G. et al. (2018) Enhancer RNA profiling predicts transcription factor activity. Genome Res., 28, 334–344. - PMC - PubMed
    1. Balwierz P.J. et al. (2014) ISMARA: automated modeling of genomic signals as a democracy of regulatory motifs. Genome Res., 24, 869–884. - PMC - PubMed

Publication types

MeSH terms

Substances