. 2020 Oct;10(6):e181.
doi: 10.1002/ctm2.181.

BRD4 regulates self-renewal ability and tumorigenicity of glioma-initiating cells by enrichment in the Notch1 promoter region

Affiliations

BRD4 regulates self-renewal ability and tumorigenicity of glioma-initiating cells by enrichment in the Notch1 promoter region

Zhennan Tao et al. Clin Transl Med. 2020 Oct.

Abstract

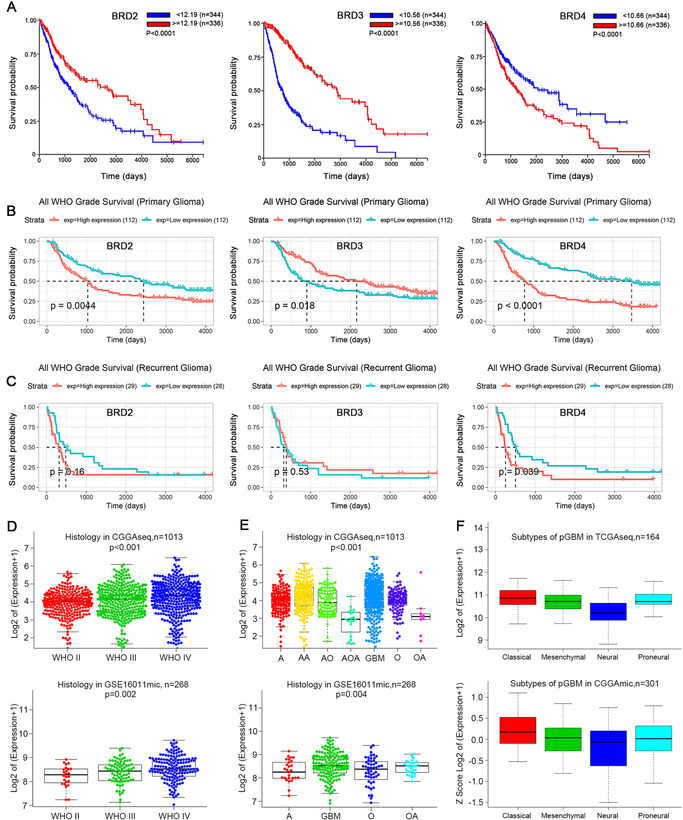
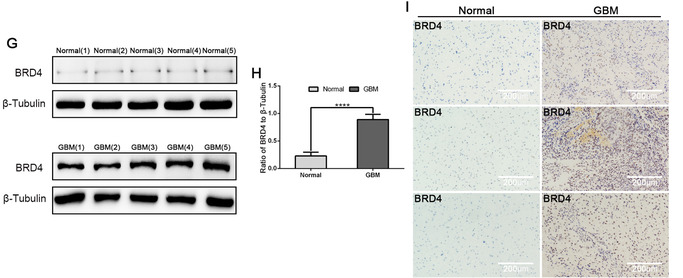
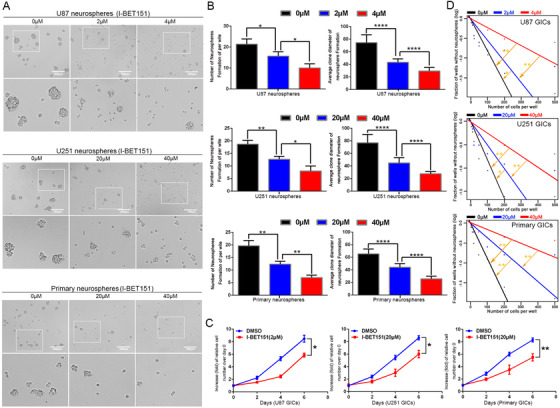
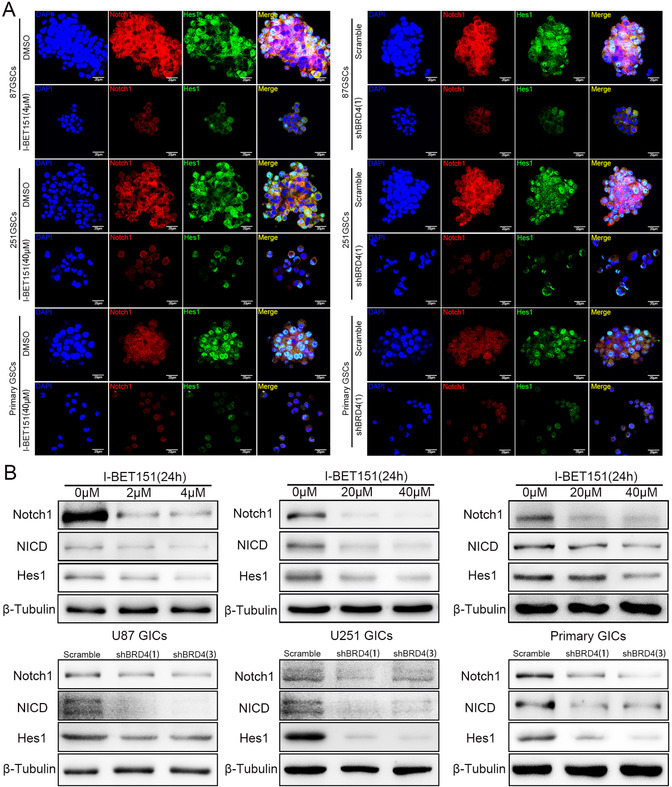
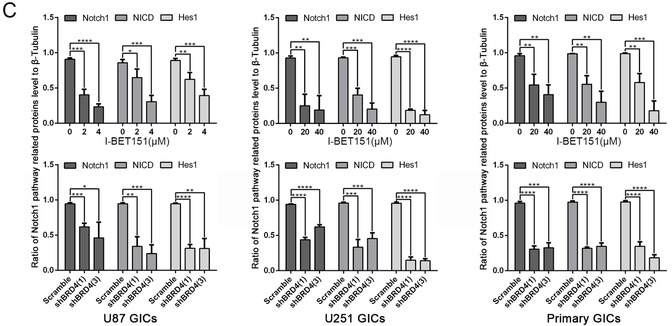
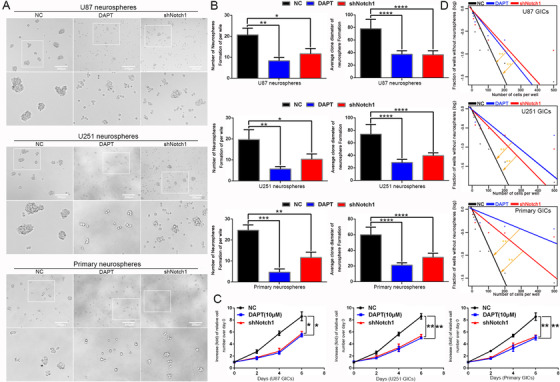
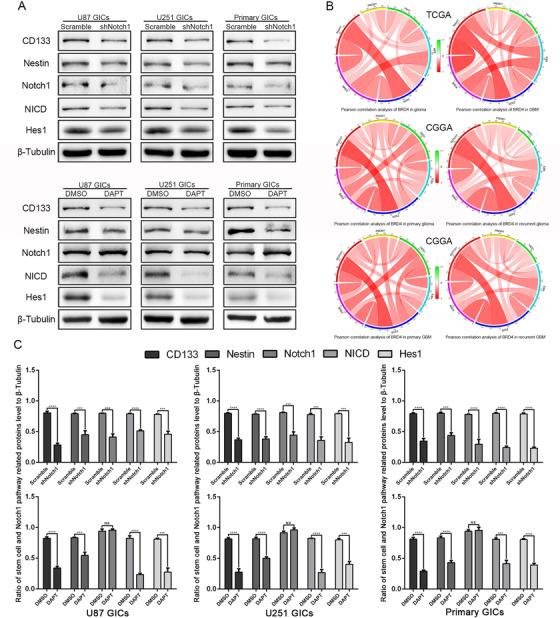
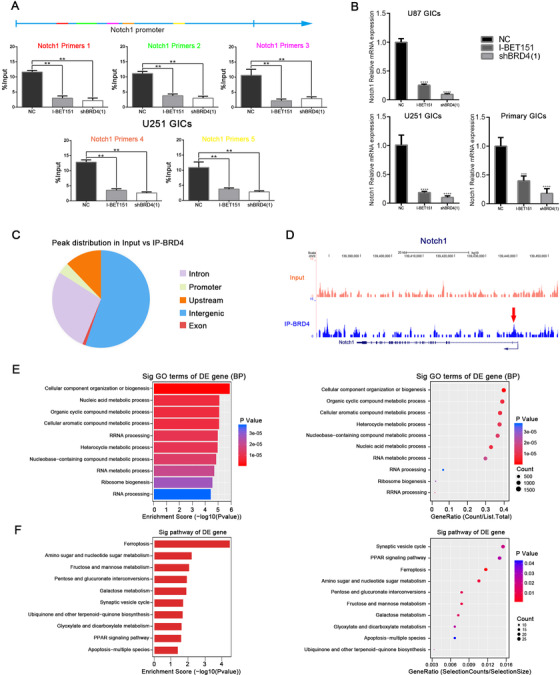
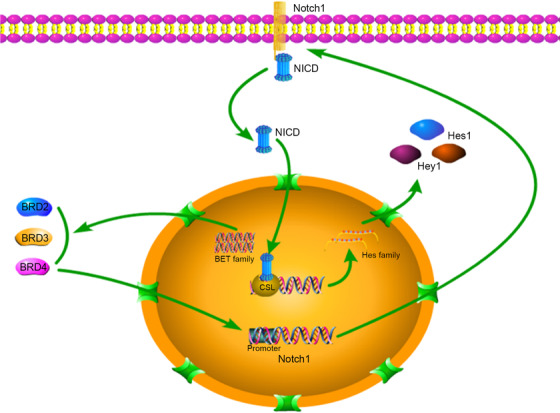
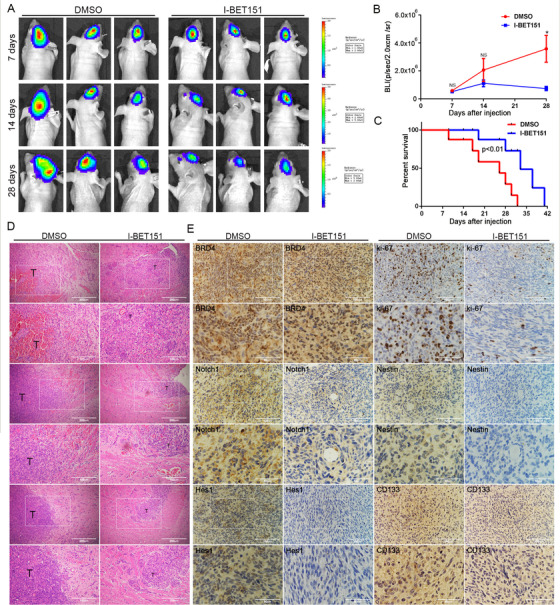
Bromodomain and extraterminal domain (BET) family proteins are considered to be epigenetic readers that regulate gene expression by recognizing acetyl lysine residues on histones and nonhistone chromatin factors and have been classified as curative targets for a variety of cancers. Glioma-initiating cells (GICs), which commit self-renewal, perpetual proliferation, multidirectional differentiation, and vigorous tumorigenicity, sustain the peculiar genetic and epigenetic diversification in the GBM patients, thus, GICs result in tumor recurrence. Abundant evidence demonstrates that BET proteins regulate differentiation of stem cells. However, it endures ambiguous how individual BET proteins take part in GIC advancement, and how do small molecule inhibitors like I-BET151 target functional autonomous BET proteins. Here, we validated that BRD4, not BRD2 or BRD3, has value in targeted glioma therapy. We announce a signaling pathway concerning BRD4 and Notch1 that sustains the self-renewal of GICs. Moreover, in-depth mechanistic research showed that BRD4 was concentrated at the promoter region of Notch1 and may be involved in the process of tumor metabolism. Furthermore, in intracranial models, I-BET151 eliminated U87 GICs' tumorigenicity. The outcomes of this research could be conducive to design clinical trials for treatment of glioma based on BRD4.

Keywords: BET protein; BRD4; glioma-initiating cells; notch1; self-renewal; tumorigenicity.


Conflict of interest statement

The authors declare no conflict of interest.

Figures

FIGURE 1
FIGURE 1
BRD4 mRNA is inversely correlated with OS in patients with glioma and relates to glioma histology and GBM subtype. (A‐B) BRD2, BRD3, BRD4 correlated with OS of patients with glioma. TCGAs Equation (A), CGGAs Equation (B, C) datasets were used for survival analysis in primary/recurrent glioma/glioma. The median of the data was sampled to distinguish BRD low‐ and high‐expression in patient samples. (D‐E) CGGAseq and GSE16011mic datasets were used to estimate the correlation between BRD4 mRNA expression and tumor grade (WHO grade). (E) mRNAs of different histologies were examined with CGGAseq and GSE16011mic datasets, which oligodendroglioma (O), anaplastic oligodendroglioma (AO), oligoastrocytoma (OA), anaplastic oligoastrocytoma (AOA), astrocytoma (A), anaplastic astrocytoma (AA), and GBM. (F) The expression features in GBM subtypes were also explored with the TCGA and CGGA datasets. (G ,H) Protein expressions of BRD4 in normal and tumor tissues were detected by western blot. Data are shown as means ± SD, n = 5, #P = NS, *P < .05,**P < .01, ***P < .001, ****P < .0001, Student's t‐test. (I) IHC staining in normal and tumor tissues (× 40 magnification, scale bar = 200 µm)
FIGURE 1
FIGURE 1
BRD4 mRNA is inversely correlated with OS in patients with glioma and relates to glioma histology and GBM subtype. (A‐B) BRD2, BRD3, BRD4 correlated with OS of patients with glioma. TCGAs Equation (A), CGGAs Equation (B, C) datasets were used for survival analysis in primary/recurrent glioma/glioma. The median of the data was sampled to distinguish BRD low‐ and high‐expression in patient samples. (D‐E) CGGAseq and GSE16011mic datasets were used to estimate the correlation between BRD4 mRNA expression and tumor grade (WHO grade). (E) mRNAs of different histologies were examined with CGGAseq and GSE16011mic datasets, which oligodendroglioma (O), anaplastic oligodendroglioma (AO), oligoastrocytoma (OA), anaplastic oligoastrocytoma (AOA), astrocytoma (A), anaplastic astrocytoma (AA), and GBM. (F) The expression features in GBM subtypes were also explored with the TCGA and CGGA datasets. (G ,H) Protein expressions of BRD4 in normal and tumor tissues were detected by western blot. Data are shown as means ± SD, n = 5, #P = NS, *P < .05,**P < .01, ***P < .001, ****P < .0001, Student's t‐test. (I) IHC staining in normal and tumor tissues (× 40 magnification, scale bar = 200 µm)
FIGURE 2
FIGURE 2
Effects of GIC self‐renewal and proliferation treated with I‐BET151 in vitro. (A) The representative images of GICs neurospheres showed that neurosphere formation ability of GICs was significantly inhibited by I‐BET151 treatment. The outlined sections of top images were defined as higher magnification sections below. n = 5, scale bar = 200 µm. (B) The quantification of numbers and diameter of the GICs neurospheres showing that neurosphere formation ability of GICs were obviously inhibited after I‐BET151 treatment. (C) The ability of GICs proliferation was showed by cell viability assay. (D) The ability of GICs self‐renewal was detected by in vitro limiting dilution assay. Data are shown as means ± SD, n = 5, *P < .05, **P < .01, likelihood ratio test. Data in B, C are shown as means ± SD, n = 5, *P < .05, **P < .01, ****P < .0001, Student's t‐test
FIGURE 3
FIGURE 3
BRD4 regulated the protein expression of Notch pathway. Cells were treated with I‐BET151 and shBRD4 knockdown.(A) Immunofluorescence staining of GICs, which treated by DMSO, I‐BET151(4/40 µM) and scramble, shBRD4(1). (B,C) Protein expressions of Notch1 pathway were detected by western blot. Data are shown as mean ± SD, n = 3, #P = NS, *P < .05,**P < .01, ***P < .001, ****P < .0001, Student's t‐test. The nuclei were stained with DAPI and the antibody against Notch1 and Hes1. Images were captured by laser confocal microscope (× 400), scale bar = 20 µm
FIGURE 3
FIGURE 3
BRD4 regulated the protein expression of Notch pathway. Cells were treated with I‐BET151 and shBRD4 knockdown.(A) Immunofluorescence staining of GICs, which treated by DMSO, I‐BET151(4/40 µM) and scramble, shBRD4(1). (B,C) Protein expressions of Notch1 pathway were detected by western blot. Data are shown as mean ± SD, n = 3, #P = NS, *P < .05,**P < .01, ***P < .001, ****P < .0001, Student's t‐test. The nuclei were stained with DAPI and the antibody against Notch1 and Hes1. Images were captured by laser confocal microscope (× 400), scale bar = 20 µm
FIGURE 4
FIGURE 4
Impacts of GIC self‐renewal and proliferation treated by Notch1 inhibition in BRD4 overexpression GICs. (A) The representative images of GICs neurospheres showed that neurosphere formation ability of GICs was significantly inhibited by DAPT (10 µM) treatment and shNotch1 knockdown. The outlined sections of top images were defined as higher magnification sections below. n = 5, Scale bar = 200 µm. (B) The quantification of numbers and diameter of the GICs neurospheres showing that neurosphere formation ability of GICs were obviously inhibited after DAPT treatment and shNotch1 knockdown. (C) The ability of GICs proliferation was showed by cell viability assay. (D) The ability of GICs self‐renewal was detected by in vitro limiting dilution assay. Data are shown as means ± SD, n = 5, **P < .01, likelihood ratio test. Data in B, C are shown as means ± SD, n = 5, *P < .05, **P < .01, ***P < .001, ****P < .0001, Student's t‐test
FIGURE 5
FIGURE 5
Notch1 regulated the protein expression of stem cell markers in BRD4 overexpression GICs, and Pearson correlation analysis of BRD4 with Notch1, Hes1, Nestin, CD133, and SOX2 in TCGA and CGGA databases. (A) Cells were treated the same as in (Picture 4). (A,C) Protein expressions of Notch1 pathway and stem cell markers were detect by western blot. Data are shown as means ± SD, n = 3, #P = NS, *P < .05,**P < .01, ***P < .001, ****P < .0001, Student's t‐test. (B) Pearson correlation analysis between BRD4 and Notch1 pathway, stem cell markers in TCGA and CGGA data sets
FIGURE 6
FIGURE 6
BRD4 was enriched in the Notch1 promoter region and occupied cell metabolism genes regulatory regions in U251 GICs. (A) BRD4 ChIP qPCR at promoters of Notch1. IgG was used as a reference, n = 3. (B) The effect of silencing Notch1 was validated by RT‐PCR. Statistical analysis was performed by using one‐way ANOVA followed by Tukey's post‐hoc test. Data represent means ± SEM. **P < .01. (C) Pie chart showing BRD4 distribution in input versus IP‐BRD4. (D) BRD4 ChIP‐seq tracks of Notch1gene. Bottom to top: IP‐BRD4, Input. (E‐F) Gene ontology analysis and KEGG pathway analysis of genes with higher BRD4 enrichment in U251 GICs of Input versus IP‐BRD4
FIGURE 7
FIGURE 7
Mechanism diagram described the line of Notch1 pathway activation and the progress of BRD4 regulating Notch1 promoter
FIGURE 8
FIGURE 8
I‐BET151 inhibited the tumorigenicity of U87‐MG GICs in vivo. The mice were treated with intraperitoneal injection with DMSO, I‐BET151 (16 mg/kg/day) for 3 days a week. The treatment started from the 7th day after implantation and lasted for approximately 28 days. (A) Representative images of bioluminescence of mice on days 7, 14, and 28 after implantation. (B) Quantitative analysis of these bioluminescence images for the DMSO, I‐BET151 treatment groups. Data are shown as the mean ± SD, n = 6, **P < .01 compared to the control, Student's t‐test (C) The overall survival of mice in the DMSO, I‐BET151 treatment groups. Data are shown as the mean ± SD, n = 6, NS P > .05, **P < .01 compared to the control, ANOVA test. (D‐E) Representative images of the HE (× 40 magnification, scale bar = 200 µm) and IHC staining in tumor sections (× 100 magnification, scale bar = 100 µm).The three rows of HE samples are repeated data from different processing groups. The outlined sections of top images were defined as higher magnification sections below

References

    1. Stupp R, Hegi ME, Mason WP, et al. Effects of radiotherapy with concomitant and adjuvant temozolomide versus radiotherapy alone on survival in glioblastoma in a randomised phase III study: 5‐year analysis of the EORTC‐NCIC trial. Lancet Oncol. 2009;10:459‐466. - PubMed
    1. Lee E, Yong RL, Paddison P, Zhu J. Comparison of glioblastoma (GBM) molecular classification methods. Semin Cancer Biol. 2018;53:201‐211. - PubMed
    1. Hemmati HD, Nakano I, Lazareff JA, et al. Cancerous stem cells can arise from pediatric brain tumors. Proc Natl Acad Sci USA. 2003;100:15178‐15183. - PMC - PubMed
    1. Singh SK, Clarke ID, Terasaki M, et al. Identification of a cancer stem cell in human brain tumors. Cancer Res. 2003;63:5821‐5828. - PubMed
    1. Galli R, Binda E, Orfanelli U, et al. Isolation and characterization of tumorigenic, stem‐like neural precursors from human glioblastoma. Cancer Res. 2004;64:7011‐7021. - PubMed