. 2020 Oct;10(6):e208.
doi: 10.1002/ctm2.208.

ANXA6 suppresses the tumorigenesis of cervical cancer through autophagy induction

Affiliations

ANXA6 suppresses the tumorigenesis of cervical cancer through autophagy induction

Xin Sun et al. Clin Transl Med. 2020 Oct.

Abstract

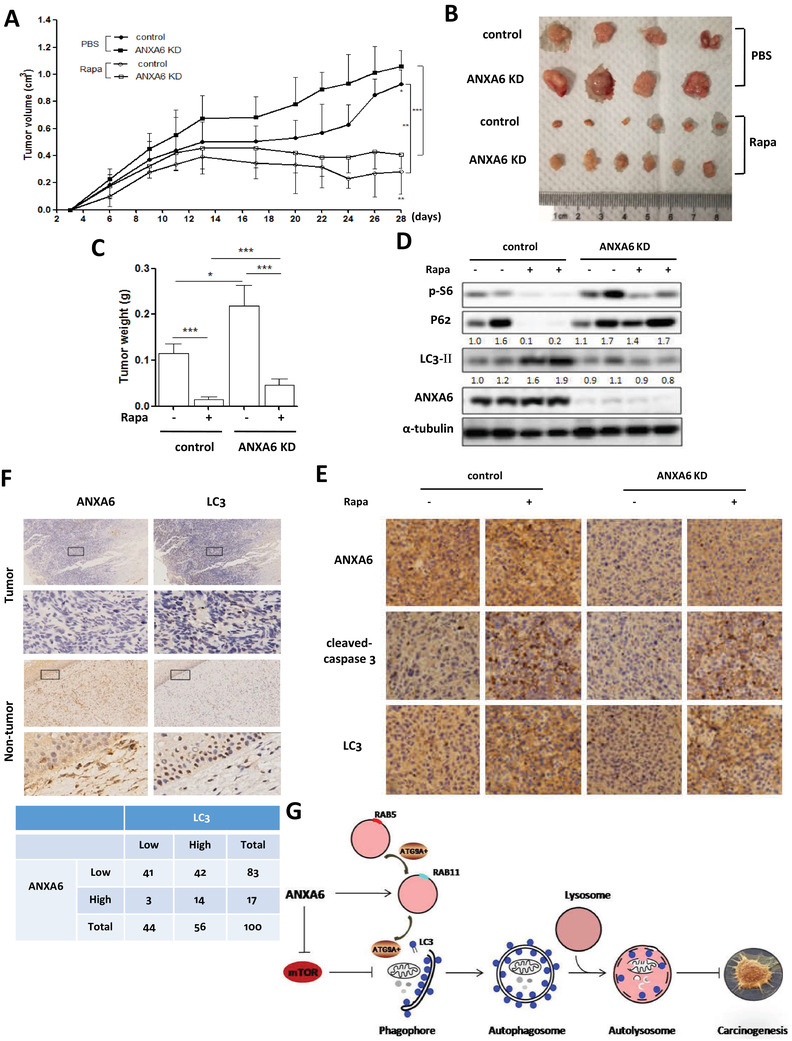
Background: Autophagy is an intracellular degradation pathway conserved in eukaryotes. ANXA6 (annexin A6) belongs to a family of calcium-dependent membrane and phospholipid-binding proteins. Here, we identify ANXA6 as a newly synthesized protein in starvation-induced autophagy and validate it as a novel autophagy modulator that regulates autophagosome formation.

Results: ANXA6 knockdown attenuates starvation-induced autophagy, while restoration of its expression enhances autophagy. GO (gene ontology) analysis of ANXA6 targets showed that ANXA6 interacts with many RAB GTPases and targets endocytosis and phagocytosis pathways, indicating that ANXA6 exerts its function through protein trafficking. ATG9A (autophagy-related 9A) is the sole multispanning transmembrane protein and its trafficking through recycling endosomes is an essential step for autophagosome formation. Our results showed that ANXA6 enables appropriate ATG9A+ vesicle trafficking from endosomes to autophagosomes through RAB proteins or F-actin. In addition, restoration of ANXA6 expression suppresses mTOR (mammalian target of rapamycin) activity through the inhibition of the PI3K (phosphoinositide 3-kinase)-AKT and ERK (extracellular signal-regulated kinase) signaling pathways, which is a negative regulator of autophagy. Functionally, ANXA6 expression is correlated with LC3 (microtubule-associated protein 1 light chain 3) expression in cervical cancer, and ANXA6 inhibits tumorigenesis through autophagy induction.

Conclusions: Our results reveal an important mechanism for ANXA6 in tumor suppression and autophagy regulation.

Keywords: ANXA6; ATG9A; ERK; autophagy; cervical cancer; mTOR.


Figures

FIGURE 1
FIGURE 1
ANXA6 is a newly synthesized protein in starvation‐induced autophagy in human cervical cancer. A, Identification of de novo proteins using AHA labeling. HeLa cells were labeled with AHA (50 µM) under starvation in the presence or absence of CHX (10 µM). Intensity of AHA‐labeled proteins was detected in gel fluorescence. The newly synthesized ANXA6 protein was detected using western blotting. B, The representative proteins were shown in database by LC‐MS/MS, including ANXA6. C, D, ANXA6 was downregulated in both mRNA and protein levels in human cervical cancer tissues when compared with that in noncancer tissues. The mRNA levels of ANXA6 were obtained from Oncomine database (total 45 samples). IHC analysis of ANXA6 expression was performed in 100 human cervical cancer patients from Shanghai Putuo District People's Hospital. * P < .05 E, Low expression of ANXA6 was correlated with poor survival in human cervical cancer patients. The data were obtained from TIMER database. F, G, The levels of ANXA6 were increased with time under starvation. HeLa cells were starved with EBSS for autophagy induction
FIGURE 2
FIGURE 2
Knockdown of ANXA6 decreases autophagy levels under starvation. A, B, Hela cells with GFP‐LC3 expressing were starved for 2 h and then cells were examined by confocal microscopy (scale bar 10 µm). The number of GFP‐LC3 puncta was counted and statistically analyzed. * P < 0.05 C, HeLa cells were transfected with scrambled or ANXA6 siRNA for 48 h and then starved in the presence or absence of CQ (20 µM). D, E, HeLa cells with GFP‐LC3 expressing were treated with EBSS for 2 h. After LysoTracker staining (50 nM, 30 min), cells were examined using confocal microscopy (scale bar 10 µm). The Pearson's coefficient was calculated and colocalization was statistically analyzed. ** P < 0.01 F, L929‐tfLC3 cells were first transfected with scrambled or ANXA6 siRNA for 48 h and then starved for 2 h. Cells fluorescence was examined by flow cytometry and the fluorescence ratio of RFP to GFP was calculated and statistically analyzed. ** P < 0.01 G, H, as in F, confocal microscope was performed to determine the fluorescence intensity (scale bar 10 µm). The number of yellow puncta (GFP+RFP+) versus red puncta (GFPRFP+) was calculated and statistically analyzed. * P < 0.05
FIGURE 3
FIGURE 3
Quantitative proteomics reveals ANXA6‐specific target proteins and involved pathways. A, Total 587 proteins were profiled as target proteins of ANXA6 under starvation. B, GO analysis of CC (cellular component) localization of the ANXA6 targets. C, The top regulated BPs (biological processes) of ANXA6 targets were shown according to their ranking. D, Top molecular and cellular functional classes to which the ANXA6‐targeted proteins are associated. E, Top canonical pathways that the ANXA6 protein targets are significantly over‐represented
FIGURE 4
FIGURE 4
ANXA6 targets molecular transporters to regulate the formation of autophagosome. A, The representative target proteins of ANXA6 identified by LC‐MS/MS in cells (sorted by average enrichment ratios). B, IPA reveals that ANXA6 affects protein trafficking. All proteins shown were identified as specific targets of ANXA6. C, D, The colocalization of ATG9A with P62 in HeLa cells was examined under starvation (scale bar 10 µm). The Pearson's coefficient was calculated and statistically analyzed. * P < 0.05 ** P < 0.01 E, F, Hela cells were starved in EBSS for 2 h in the presence or absence of CDN1163 (an activator of Ca2+‐ATPase) or thapsigargin (an inhibitor of Ca2+‐ATPase). The colocalization of endogenous ATG9A with ANXA6 was determined by confocal microscopy (scale bar 10 µm). The Pearson's coefficient was calculated and statistically analyzed. * P < 0.05 ** P < 0.01 *** P < 0.001 G, H, The colocalization of ATG9A with F‐actin was examined under starvation (scale bar 10 µm). The Pearson's coefficient was calculated and statistically analyzed. * P < 0.05 I, IP assay was also conducted to determine the interaction between ATG9A and F‐actin
FIGURE 5
FIGURE 5
Knockdown of ANXA6 attenuates ATG9A trafficking through the recycling endosomes. A, B, Confocal pictures showed the colocalization of ATG9A with RAB5 in starved HeLa cells with ANXA6 knockdown (scale bar 10 µm). The Pearson's coefficient was calculated and statistically analyzed. * P < 0.05 C, IP assay was performed to determine the interaction between ATG9A and ANXA6. HEK293 cells with ANXA6 knockdown were transfected with pcDNA3.1‐ATG9A and then starved with EBSS. Cell lysates were prepared for IP assay. D, E, The colocalization of ATG9A with RAB11 in ANXA6 knockdown cells was determined under starvation. (scale bar 10 µm). The Pearson's coefficient was calculated and statistically analyzed. ** P < 0.01 *** P < 0.001 F as in C, IP assay was conducted to examine the interaction between ATG9A and RAB11 in ANXA6 knockdown cells
FIGURE 6
FIGURE 6
ATG9A trafficking by ANXA6 is required for the formation of autophagosome. A, C, GFP‐ANXA6 was transiently transfected into HeLa cells with ANXA6 knockdown and then cells were starved in EBSS for 2 h. Confocal microscope was used to determine the colocalization of ATG9A with RAB5 or RAB11 (scale bar 10 µm). The Pearson's coefficient was calculated and statistically analysed in B, D. * P < 0.05 ** P < 0.01 *** P < 0.001 E, HeLa cells with or without ANXA6 knockdown were starved for 2 h. Cells were harvested and lysed for western blotting. α‐tubulin served as loading control. F, HeLa cells with ANXA6 knockdown were transiently transfected with different amount of ANXA6. Cell lysates were prepared for western blotting to determine the expression levels of the indicated proteins. α‐tubulin was used as loading control. G, HeLa cells with ANXA6 knockdown were treated with ERK inhibitor U0126 (10 µM) for 2 h. Cells were harvested for western blotting to determine the indicated proteins expression. H, HeLa cells with ANXA6 knockdown were first transiently transfected with GFP‐ANXA6 and then starved in EBSS for 2 h in the presence or absence of CQ (20 µM). Cells were harvested and lysed for western blotting and α‐tubulin served as loading control
FIGURE 7
FIGURE 7
Low levels of autophagy promotes the proliferation of cancer cells. HeLa cells were first transfected with the ANXA6‐ or Atg7‐specific lentiviral shRNA. After 72 h, cells were cultured in EBSS for 24 h starvation. A, HeLa cells with indicated treatment were examined under an inverted microscope and morphological change of cells was photographed (scale bar 100 µm). Western blotting was used to determine ANXA6 and ATG7 expression. B, Cell proliferation was measured by CCK‐8 (cell counting kit‐8) under starvation and statistically analyzed. ** P < 0.01 *** P < 0.001 C, Cell lysates were prepared for western blotting to determine the apoptotic markers. D, E, as in A, cells were treated with autophagy inducer rapamycin. Cell proliferation was determined by colony formation assay. A quantitative analysis of the colony numbers was shown in the bar diagram. * P < 0.05 F, G, HeLa cells with or without ANXA6 knockdown were transfected with GFP‐WIPI2 and colony formation assay was performed to measure cell proliferation. * P < 0.05 ** P < 0.01 H, I, HeLa cells with ANXA6 knockdown were first restored the expression of ANXA6 and then transfected with the Atg7‐specific lentiviral shRNA. Western blotting was conducted to examine the expression levels of ANXA6 and ATG7. Cell proliferation was determined by colony formation assay. ** P < 0.01 J, Cell proliferation was measured using CCK‐8 and statistically analyzed. ** P < 0.01 *** P < 0.001
FIGURE 8
FIGURE 8
Activation of autophagy suppresses the tumorigenesis of cervical cancer. A, Tumor volumes from each group were measured using a vernier caliper twice per week and then statistically analyzed. * P < 0.05, **< 0.01, *** P < 0.001 B, Typical images of the xenograft tumors from different treatment groups were shown. C, The average tumor weight from each group was calculated and statistically analyzed. * P < 0.05, *** P < 0.001 D, Autophagy markers were examined in tumor tissue from various groups using western blotting. E, Representative images of ANXA6, cleaved‐caspase 3, and LC3 by IHC staining were shown on serial sections of tumors from various groups. F, ANXA6 expression was associated with LC3 level in human cervical tumor and nontumor tissues by IHC staining (upper panel). IHC staining results were summarized in two different cohorts of human cervical cancer specimens (lower panel). G, A schematic model of autophagy induction by ANXA6 in human cervical cancer

Similar articles

Cited by

References

    1. Trottier H, Burchell AN. Epidemiology of mucosal human papillomavirus infection and associated diseases. Public Health Genomics. 2009;12:291‐307. 10.1159/000214920. - DOI - PubMed
    1. Einstein MH, Schiller JT, Viscidi RP, et al. Clinician's guide to human papillomavirus immunology: knowns and unknowns. Lancet Infect Dis. 2009;9:347‐356. 10.1016/S1473-3099(09)70108-2. - DOI - PubMed
    1. Li X, Gong Z, Zhang L, et al. Autophagy knocked down by high‐risk HPV infection and uterine cervical carcinogenesis. Int J Clin Exp Med. 2015;8:10304‐10314. - PMC - PubMed
    1. Ishii Y. Electron microscopic visualization of autophagosomes induced by infection of human papillomavirus pseudovirions. Biochem Biophys Res Commun. 2013;433:385‐389. 10.1016/j.bbrc.2013.02.130. - DOI - PubMed
    1. Surviladze Z, Sterk RT, Deharo SA, Ozbun MA. Cellular entry of human papillomavirus type 16 involves activation of the phosphatidylinositol 3‐kinase/Akt/mTOR pathway and inhibition of autophagy. J Virol. 2013;87:2508‐2517. 10.1128/JVI.02319-12. - DOI - PMC - PubMed