. 2020 Nov 2:9:e60849.
doi: 10.7554/eLife.60849.

CD14 release induced by P2X7 receptor restricts inflammation and increases survival during sepsis

Affiliations

CD14 release induced by P2X7 receptor restricts inflammation and increases survival during sepsis

Cristina Alarcón-Vila et al. Elife. .

Abstract

P2X7 receptor activation induces the release of different cellular proteins, such as CD14, a glycosylphosphatidylinositol (GPI)-anchored protein to the plasma membrane important for LPS signaling via TLR4. Circulating CD14 has been found at elevated levels in sepsis, but the exact mechanism of CD14 release in sepsis has not been established. Here, we show for first time that P2X7 receptor induces the release of CD14 in extracellular vesicles, resulting in a net reduction in macrophage plasma membrane CD14 that functionally affects LPS, but not monophosphoryl lipid A, pro-inflammatory cytokine production. Also, we found that during a murine model of sepsis, P2X7 receptor activity is important for maintaining elevated levels of CD14 in biological fluids and a decrease in its activity results in higher bacterial load and exacerbated organ damage, ultimately leading to premature deaths. Our data reveal that P2X7 is a key receptor for helping to clear sepsis because it maintains elevated concentrations of circulating CD14 during infection.

Keywords: CD14; LPS; cytokines; human; immunology; inflammation; mouse; purinergic signaling; sepsis.

Plain language summary

When the immune system detects an infection, it often launches an inflammatory response to fight off the disease. This defense mechanism is activated by a cascade of signaling molecules that can aggravate inflammation, causing it to damage the body’s own tissues and organs. This life-threatening reaction is referred to as sepsis, and kills around 11 million people each year. New approaches are therefore needed to help alleviate the damage caused by this condition. The inflammatory response is often triggered by proteins called receptors, which sit on the surface of immune cells. When these receptors are activated, they induce cells to secrete proteins that travel around the body and activate immune cells that can eliminate the infection. In 2016, a group of researchers showed that a receptor called P2X7 stimulates the release of a signaling molecule called CD14. Patients with sepsis often have elevated amounts of CD14 in their bloodstream. Yet, it remained unclear what causes this rise in CD14 and what role this molecule plays in the development of sepsis. Now, Alarcón-Vila et al. – including some of the researchers involved in the 2016 study – have investigated the role of P2X7 in mice undergoing sepsis. This was done by puncturing the mice’s intestines, causing bacteria to leak out and initiate an over-active immune response. Alarcón-Vila et al. found that mice lacking the P2X7 receptor had less CD14 and struggled to eliminate the bacterial infection from their system. This increase in bacteria caused excessive damage to the mice’s organs, ultimately leading to premature death. These findings suggest that P2X7 plays an important role in preventing the onset of sepsis by helping maintain high levels of CD14 following infection. This result could help to identify new therapies that reduce the mortality rates of septic infections.


Conflict of interest statement

CA, AB, Cd, CM, JM, HM, CG, PP No competing interests declared

Figures

Figure 1.
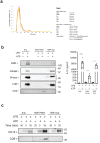
Figure 1.. P2X7 receptor stimulation induces the release of extracellular vesicles containing CD14.
(a) Immunoblot for CD14 and CD9 in cell lysate (CL), cell-free supernatant (Sup) and supernatant fractions (100K pellet and 100K supernatant) obtained from extracellular vesicle (EV) isolation from BMDMs treated for 4 hr with LPS (10 ng/ml) and then stimulated or not for 20 min with ATP (3 mM); representative of n = 3 experiments. (b) Quantification of extracellular CD14 by ELISA in Sup, EV isolated with the Exo-Quick kit and flow-through fraction obtained in cell-free supernatants from BMDM treated as in (a), but before ATP application cells were treated for 10 min with A438079 (20 μM) as indicated (left) or from EV isolated with the Exo-Quick in supernatants from P2rx7−/− macrophages (right); each dot represents an independent experiment (n = 4 to 8). (c) Immunoblot for CD14 and CD9 in Sup, 100K pellet and 100K supernatant from BMDM cell-free supernatants treated as in (a), but after the first step of EV isolation, Sup was treated with 2% of Triton X-100; representative of n = 3 independent experiments. (d) Immunoblot for CD14 and CD9 in Sup, 100K pellet and 100K supernatant in cell-free supernatants from BMDM unprimed or primed for 4 hr with LPS (10 ng/ml) or IL-4 (20 ng/ml) and then treated with ATP as in (a); representative of n = 3 experiments. (e) Quantification of EV released from BMDM treated as in (d), left panel; each dot represents an independent experiment (n = 3 to 5); Normalized number of EV to the number of cells obtained in each treatment is shown. Representative transmission electron microscopy image obtained from the 100K pellet, right panel. (f) Immunoblot for CD14 and CD9 in 100K pellet obtained from cell-free supernatants of C57BL/6 (wild-type), Nlrp3−/− or Casp1/11−/− BMDM treated as in (a), representative of n = 3 independent experiments. (g) Quantification of EV in cell-free supernatants of C57BL/6 (wild-type), Nlrp3−/− or Casp1/11−/− BMDM treated as in (a); each dot represents an independent experiment (n = 3 to 5); Normalized number of EV to the number of cells obtained in each treatment is shown. (h) Quantification of CD14 mean fluorescence intensity (MFI) in BDMD treated as in (b); each dot represents an independent experiment (n = 6). *p<0.05, **p<0.01, ***p<0.001, Mann-Whitney test. For a, c, d, and f numbers on the right of the blots correspond to the molecular weight in kDa.
Figure 1—figure supplement 1.
Figure 1—figure supplement 1.. Characterization of P2X7 receptor-induced extracellular vesicles.
(a) Nanoparticle tracking analysis of extracellular vesicles isolated from BMDM cell-free supernatant primed for 4 hr with LPS (10 ng/ml) and then stimulated during 20 min with ATP (3 mM); n = 3. (b) Immunoblot for macrophage mannose receptor 1 (MMR), peptidyl-prolyl cis-trans isomerase A (PPIase), cathepsin B (CathpB), cystatin B (CstB) and CD9 (left panel) or ELISA for IL-1β (right panel) in cell-free supernatant (Sup) and fractions (100K pellet and 100K supernatant) obtained from extracellular vesicles isolated from BMDM cell-free supernatant primed for 4 hr with LPS (10 ng/ml) and then stimulated or not during 20 min with ATP (3 mM); results are representative from n = 2 independent experiments (left panel), or n = 4 to 8 independent experiments (right panel); *p<0.05, ***p<0.001, Mann-Whitney test. (c) Immunoblot for CD14 and CD9 in cell-free supernatant (Sup) and fractions (100K pellet and 100K supernatant) obtained from extracellular vesicles isolated from BMDM cell-free supernatant treated for 4 hr with LPS (10 ng/ml) and then stimulated or not at indicated times with ATP (3 mM); representative of n = 3 independent experiments. For b and c numbers on the right of the blots correspond to the molecular weight in kDa.
Figure 1—figure supplement 2.
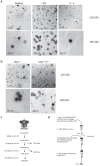
Figure 1—figure supplement 2.. Electron microscopy of P2X7 receptor-induced extracellular vesicles.
(a) Representative transmission electron microscopy images obtained from extracellular vesicle fraction isolated from cell-free supernatants of BMDM untreated (resting) or primed for 4 hr with LPS (10 ng/ml) or IL-4 (20 ng/ml) and then stimulated during 20 min with ATP (3 mM). Representative images from n ≥ 3 independent experiments. (b) Representative transmission electron microscopy images obtained from 100K pellet fraction obtained from cell-free supernatant of Casp1/11−/− and Nlrp3−/− BMDM primed for 4 hr with LPS (10 ng/ml) and then stimulated during 20 min with ATP (3 mM). Representative images of n = 3 independent experiments. (c) Diagram for extracellular vesicle isolation protocol based on differential centrifugation. Speed, duration, and temperature of each centrifugation step are indicated. Pellets are discarded after first two centrifugations and the supernatant is kept for the next step. In the last 100,000 xg centrifugation, 100K pellet fraction is obtained. (d) Diagram for extracellular vesicle isolation protocol based on Exo-Quick kit.
Figure 2.
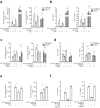
Figure 2.. P2X7 receptor stimulation impairs LPS-mediated signaling.
(a) Expression of Il6 and Tnfa genes analyzed by qPCR in C57BL/6 (wild-type) or P2rx7−/− BMDM treated or not for 10 min with A438079 (10 μM), then incubated for 30 min with ATP (5 mM), then washed and finally primed for 4 hr with LPS (10 ng/ml). (b) IL-6 and TNF-α concentration in cell-free supernatants from C57BL/6 (wild-type) or P2rx7−/− BMDM treated as in (a). (c,d) Expression of Il6 and Tnfa genes analyzed by qPCR (c) and ELISA for IL-6 and TNF-α in cell-free supernatants (d) from C57BL/6 (wild-type) or P2rx7−/− BMDM treated as in (a) but finally stimulated for 4 hr with MPLA (1 μg/ml) instead of LPS. (e) Expression of Il1b gene analyzed by qPCR from BMDM treated as in (a) and (c). (f) IL-1β concentration in cell-free supernatants from BMDM treated as in (e) and after LPS or MPLA stimulation, cells were incubated for 30 min with nigericin (10 μM). Each dot represents a single independent experiment; data are represented as mean ± SEM; n = 4–6 single experiments; *p<0.05; **p<0.01; ns, no significant difference (p>0.05); Mann–Whitney test.
Figure 2—figure supplement 1.
Figure 2—figure supplement 1.. Anti-CD14 reduced LPS, but not MPLA, induced cytokine production.
(a) Expression of Il6 and Tnfa genes analyzed by qPCR from BMDM treated for 10 min with a blocking αCD14 antibody (clone M14-23, 20 μg/mL, 4°C), and then cells were incubated for 4 hr with LPS (10 ng/mL) or MPLA (1 μg/mL) at 37°C. (b) Release of IL-6 and TNF-α from BMDMs treated as in (a). Each dot represents a single independent experiment; mean ± standard error is represented in all panels; n = 4–5 independent experiments; *p<0.05; **p<0.01; ns, no significant difference (p>0.05); Mann–Whitney test.
Figure 3.
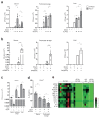
Figure 3.. P2X7 receptor controls CD14 in extracellular vesicles during sepsis.
(a) Blood plasma concentration of CD14 (left) and quantification of P2X7 receptor mean fluorescence intensity (MFI) in monocytes (right) from non-septic donors and intra-abdominal origin septic patients within the first 24 hr of admission to the surgical unit. Each dot represents a donor or septic individual, n = 10. (b) CD14 concentration in the serum and peritoneal lavage of C57BL/6 (wild-type) and P2rx7−/− mice collected 24 and 48 hr after CLP measured by ELISA. (c) CD14 concentration in the serum and peritoneal lavage of C57BL/6 (wild-type) mice collected 24 hr after CLP, treated or not with A438079 (100 µM/kg) 1 hr before CLP. (d) CD14 concentration in extracellular vesicles (E.V.) isolated from the peritoneal lavage of C57BL/6 (wild-type) and P2rx7−/− mice collected 48 hr after CLP. For b–d, each dot represents a single mouse; data are represented as mean ± SEM; *p<0.05; **p<0.01; ***p<0.0001; Mann-Whitney test.
Figure 4.
Figure 4.. The deficiency or blocking of P2X7 receptor increases cytokine production during sepsis.
(a) ELISA of IL-6 in the serum of C57BL/6 (wild-type) and P2rx7−/− mice collected 24 and 48 hr after CLP; each dot represents a single mouse; data are represented as mean ± SEM; *p<0.05; Mann-Whitney test. (b,c) Heatmaps for the concentrations of different cytokines, chemokines and acute phase proteins as indicated in the serum of C57BL/6 (wild-type) and P2rx7−/− mice (b) or C57BL/6 treated with A438074 (100 µM/kg) (c) collected 24 hr after CLP. For (b,c) C57BL/6 sham n = 5 (b) and n = 4 (c); P2rx7−/− sham n = 5; sham+A438079 n = 3; C57BL/6 CLP n = 8 (b) and n = 8 (c); P2rx7−/− CLP n = 9; and C57BL/6 CLP+A438079 n = 6.
Figure 5.
Figure 5.. Extracellular CD14 limits bacterial dissemination and cytokine production during sepsis caused by P2X7 receptor deficiency.
(a) Bacterial load in serum, peritoneal lavage and liver homogenates from C57BL/6 (wild-type) and P2rx7−/− mice collected 24 and 48 hr after CLP. (b) Bacterial load in serum, peritoneal lavage, and liver homogenates from C57BL/6 (wild-type) mice treated with A438074 (100 µM/kg) and collected 24 hr after CLP. (c) Bacterial load in serum, peritoneal lavage and liver from P2rx7−/− mice treated with recombinant CD14 (rCD14, 10 µg/g) 30 min before CLP and collected 24 hr after CLP. (d) ELISA for IL-6 in serum and peritoneal lavage samples from P2rx7−/− mice collected 24 hr after CLP with or without treatment with recombinant CD14 (rCD14, 10 µg/g) 30 min before CLP; each dot represents a single mouse and data are represented as mean ± SEM. (e) Heatmaps for the concentrations of different cytokines, chemokines and acute phase proteins as indicated in the serum of P2rx7−/−mice treated with rCD14 as in (d) collected 24 and 48 hr after CLP. For a-d panels, each dot represents a single mouse and data are represented as mean ± SEM; *p<0.05; **p<0.01; ***p<0.001; ****p<0.0001; Mann-Whitney test.
Figure 6.
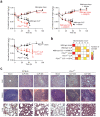
Figure 6.. Release of P2X7 receptor-dependent CD14 during sepsis is important for survival.
(a) Kaplan-Meier analysis of C57BL/6 (wild-type) mice survival after sham operation or CLP, a group of mice were treated with A438074 (100 µM/kg) before CLP. Sham groups n = 6 each; CLP n = 14 and CLP+A438079 n = 10. (b) Kaplan-Meier analysis of C57BL/6 (wild-type) and P2rx7−/− mice survival after sham operation or CLP. A group of P2rx7−/− mice were treated with recombinant CD14 (rCD14, 10 µg/g) 30 min before CLP. Sham groups n = 4 each; CLP n = 14, CLP P2rx7−/−= 9; and rCD14+CLP P2rx7−/−= 9. (c,d) Representative images of hematoxylin and eosin-stained liver sections 24 and 48 hr after CLP of mouse groups described in (a,b); scale bar, 50 µm. CLP 24 hr n = 9; rCD14+CLP 24 hr n = 7; CLP 48 hr n = 4, rCD14+CLP 48 hr n = 3. *p<0.05; **p<0.01; ****p<0.0001; ns, no significant difference (p>0.05); Mann-Whitney test for (e) and Log-rank (Mantel-Cox) test for (a) and (b).
Figure 6—figure supplement 1.
Figure 6—figure supplement 1.. Impact of P2X7 deficiency in sepsis.
(a) Normalized body weight (weight at different times/weight at the beginning, time 0: gt/g0) after sham operation or CLP for wild-type mice, wild-type treated with A438079, P2rx7−/− mice, P2rx7−/− mice with rCD14 treatment; data are represented as mean ± SEM of n = 6 animals per group, except n = 4 for the wild-type sham group treated with A438079. (b) Monitorization score of n = 5 mice per group. Animals were scored from the beginning of the study following individual values for: spiky hair, weight loss, ocular discharge, bending posture, ataxia, trembling, hypothermia, cyanosis, auto-mutilation, aggressive/comatose behavior, and stool type. When the score was between 4 and 10, the animal was supervised every hour. (c) Representative images of hematoxylin and eosin-stained liver, spleen, and lung sections from C57BL/6 (wild-type) and P2rx7−/− mice 24 and 48 hr after CLP. Scale bar 50 μm; images representative of n = 6 independent mice.
Figure 6—figure supplement 2.
Figure 6—figure supplement 2.. Impact of P2X7 antagonist A438079 in sepsis.
Representative images of hematoxylin and eosin-stained liver, spleen, and lung sections obtained 24 hr after CLP from C57BL/6 (wild-type) mice treated with A438079 (100 µM/kg) 1 hr before CLP. Scale bar 50 μm; images representative of n = 6 independent mice.
Figure 6—figure supplement 3.
Figure 6—figure supplement 3.. Impact of recombinant CD14 in sepsis.
Representative images of hematoxylin and eosin-stained liver, spleen, and lung sections obtained 24 hr after CLP from P2rx7−/− mice treated with recombinant CD14 (rCD14, 100 µg/g) 30 min before CLP. Scale bar 50 μm; images representative of n = 6 independent mice.

References

    1. Akashi-Takamura S, Miyake K. TLR accessory molecules. Current Opinion in Immunology. 2008;20:420–425. doi: 10.1016/j.coi.2008.07.001. - DOI - PubMed
    1. Barberà-Cremades M, Baroja-Mazo A, Gomez AI, Machado F, Di Virgilio F, Pelegrín P. P2X7 receptor-stimulation causes fever via PGE2 and IL-1β release. The FASEB Journal. 2012;26:2951–2962. doi: 10.1096/fj.12-205765. - DOI - PubMed
    1. Barratt-Due A, Pischke SE, Nilsson PH, Espevik T, Mollnes TE. Dual inhibition of complement and Toll-like receptors as a novel approach to treat inflammatory diseases-C3 or C5 emerge together with CD14 as promising targets. Journal of Leukocyte Biology. 2017;101:193–204. doi: 10.1189/jlb.3VMR0316-132R. - DOI - PMC - PubMed
    1. Bas S, Gauthier BR, Spenato U, Stingelin S, Gabay C. CD14 is an acute-phase protein. The Journal of Immunology. 2004;172:4470–4479. doi: 10.4049/jimmunol.172.7.4470. - DOI - PubMed
    1. Baumann CL, Aspalter IM, Sharif O, Pichlmair A, Blüml S, Grebien F, Bruckner M, Pasierbek P, Aumayr K, Planyavsky M, Bennett KL, Colinge J, Knapp S, Superti-Furga G. CD14 is a coreceptor of Toll-like receptors 7 and 9. Journal of Experimental Medicine. 2010;207:2689–2701. doi: 10.1084/jem.20101111. - DOI - PMC - PubMed

Publication types

MeSH terms