Review
. 2021 Jan 22;17(2):241-253.
doi: 10.1039/d0sm01442g.

Long-range mechanical signaling in biological systems

Affiliations
Review

Long-range mechanical signaling in biological systems

Farid Alisafaei et al. Soft Matter. .

Erratum in

Abstract

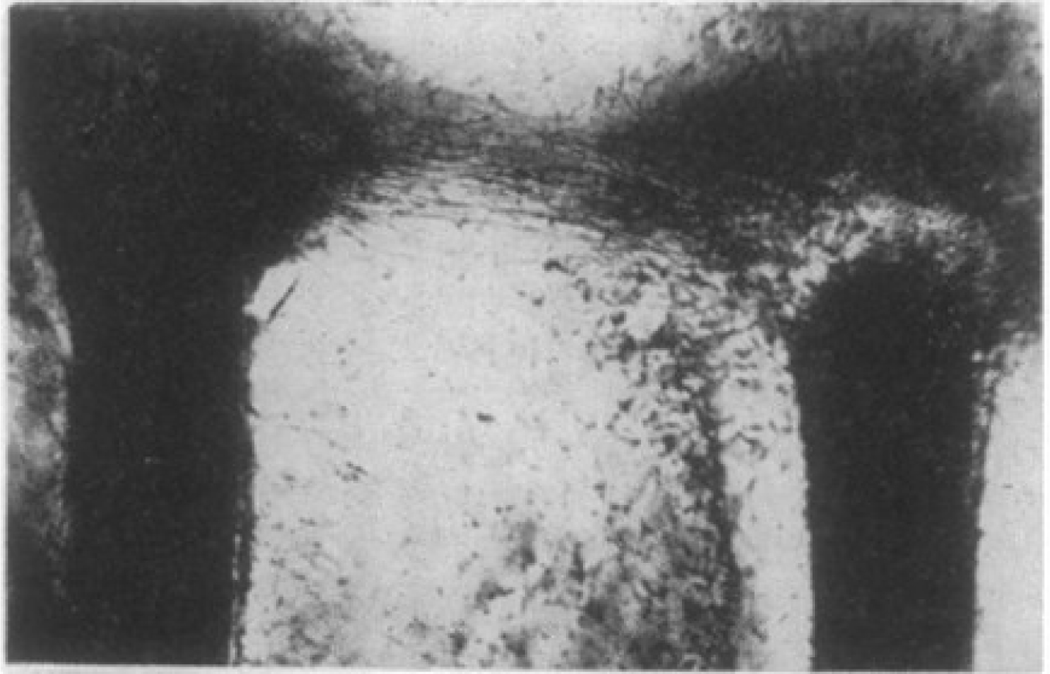
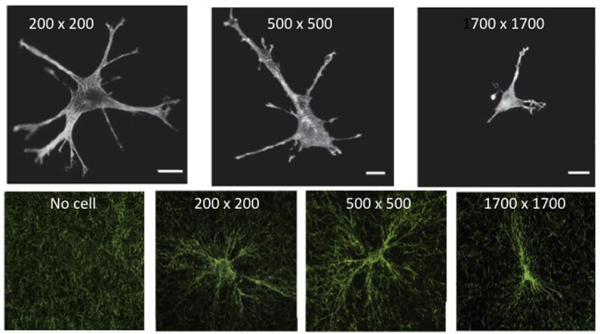
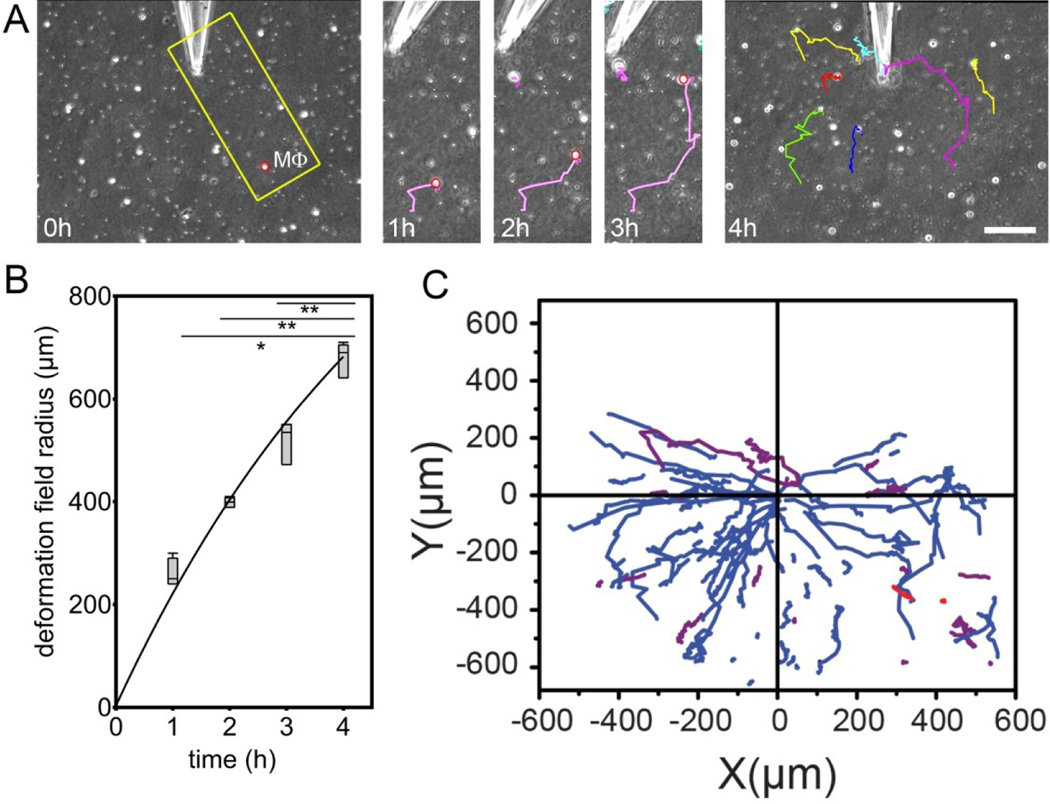
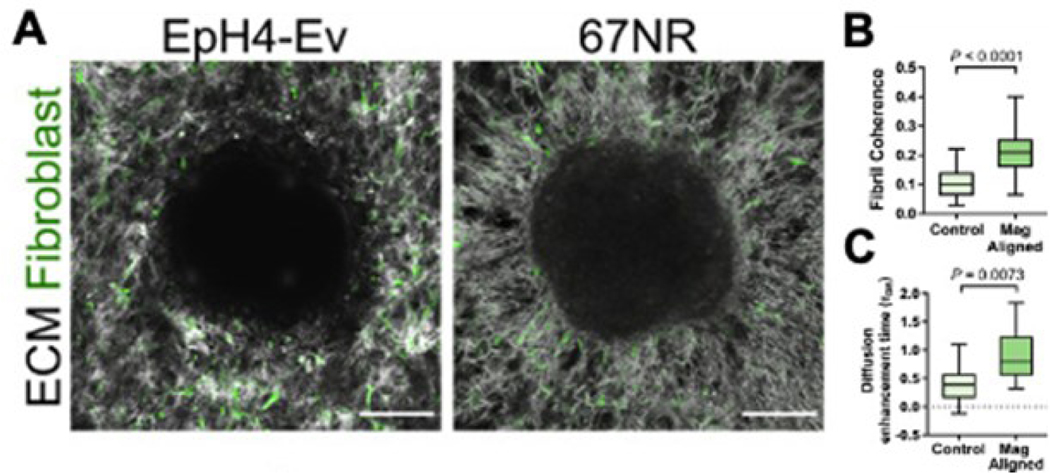
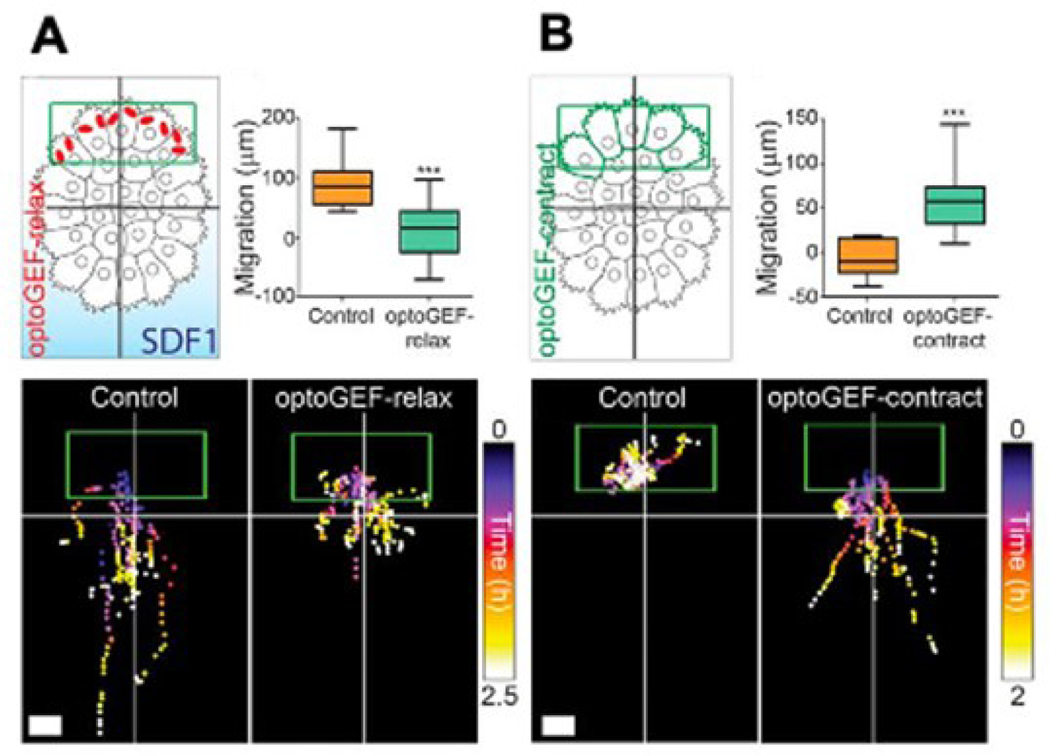
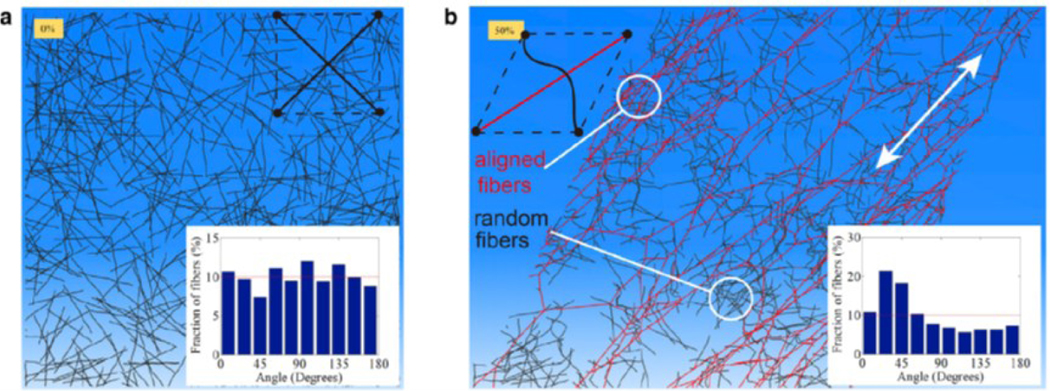
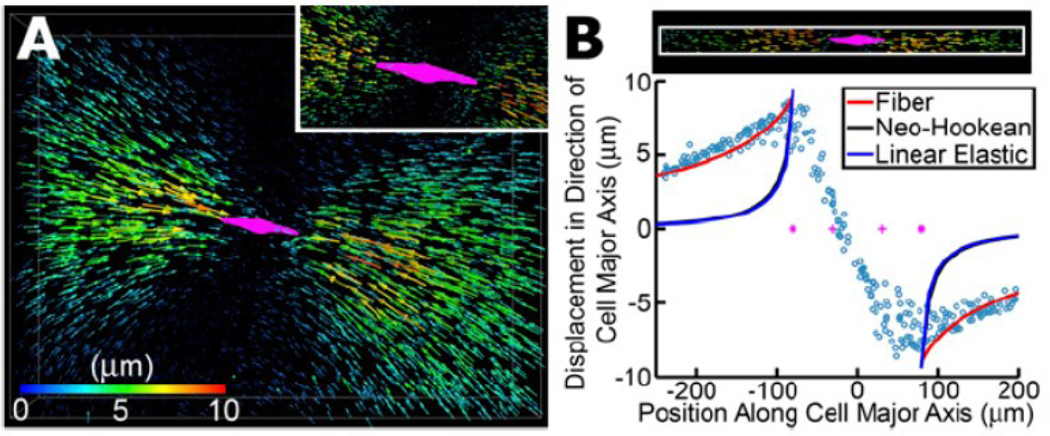
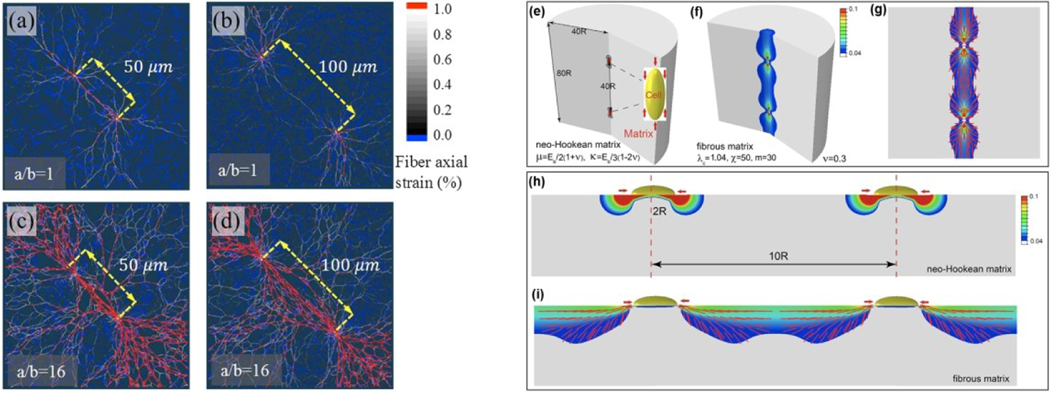
Cells can respond to signals generated by other cells that are remarkably far away. Studies from at least the 1920's showed that cells move toward each other when the distance between them is on the order of a millimeter, which is many times the cell diameter. Chemical signals generated by molecules diffusing from the cell surface would move too slowly and dissipate too fast to account for these effects, suggesting that they might be physical rather than biochemical. The non-linear elastic responses of sparsely connected networks of stiff or semiflexible filament such as those that form the extracellular matrix (ECM) and the cytoskeleton have unusual properties that suggest multiple mechanisms for long-range signaling in biological tissues. These include not only direct force transmission, but also highly non-uniform local deformations, and force-generated changes in fiber alignment and density. Defining how fibrous networks respond to cell-generated forces can help design new methods to characterize abnormal tissues and can guide development of improved biomimetic materials.


Figures

Figure 1.
Figure 1.
Two rat nerves were severed and then placed in a blood plasma clot. The regenerating cell at the top form a bridge from one nerve end to the other. From 1.
Figure 2.
Figure 2.
(A) Morphology of 3T3 fibroblasts in grids with opening widths of 200 μm, 500 μm, and 1700 μm visualized by rhodamine phalloidin staining for actin filaments. (B) Cell-induced alignment of collagen networks. After remodeling by cells, collagen fibers imaged by confocal reflectance microscopy were aligned parallel to cell extensions. Scale bar: 20 μm. From 17.
Figure 3.
Figure 3.
Macrophages (Mϕ) are attracted by local pulling events in collagen ECM. (A) Mϕ were seeded onto collagen ECM with microneedles inserted 5 μm into the 200 μm thick collagen gel. Lateral collagen deformation was performed by using negative pressure to pull collagen fibers into the tip. Mϕ migration was tracked from phase contrast movies. Scale bar: 100 μm. (B) Deformation field growth with time. (C) Mϕ trajectories are plotted with respect to distance from the microneedle.
Figure 4.
Figure 4.
A. Morphology of collagen ECM and fibroblasts surrounding a non-metastatic EpH4-Ev spheroid and a metastatic 67NR spheroid, demonstrating increased alignment surrounding the metastatic spheroid. B,C. Magnetically-controlled increased fiber alignment to model the effect of the cancerous spheroid results in increased rates of diffusion of exosome-sized particles. From 3.
Figure 5.
Figure 5.
A. Neural crest cell group treated with SDF1 gradient to induce migration, with migratory behavior abolished via relaxing contractility at the rear of the cell group via optoGEF-relax. B. Neural crest cell group without SDF1 begins to directionally migrate when contractility at the rear side of the group is induced via optoGEF-contract. From 2.
Figure 6.
Figure 6.
Discrete fiber simulations of an initially random (isotropic) fiber network before (a) and after (b) 50% shear strain. The inset in (a) shows that fibers are isotropically distributed in all directions in the initial configuration. The inset in (b) shows that after the shear deformation, more fibers are aligned in the 45o orientation which coincides with the direction of the maximum principal stretch 8.
Figure 7.
Figure 7.
Long-range force transmission within a three-dimensional collagen network. (A) Deformation field generated by an MDA-MB-231 breast cancer cell within a three-dimensional collagen network. Each arrow represents the displacement of a fluorescent bead covalently bonded to collagen fibers. 4,000 of 12,000 tracked bead displacements are shown. Arrows are rendered at four times their true size. The cell is shown in magenta. The inset shows a zoomed-in view where all displacement vectors are rendered at their true scale. (B) Bead displacements along the long axis of the cell are plotted as a function of their position along the long axis of the cell. Coordinate (0,0) represents the center of the cell. Solid lines are fits to the experimental data (circles) using three different material models: fibrous model (red) 57, nonlinear hyperelastic neo-Hookean model (black), and linear elastic model (blue).
Figure 8.
Figure 8.
(a-d) Numerical results from discrete network fiber simulations show the interaction between two cells with different center-to-center distances at 90% cell contraction 77. When the distance is 50 μm, cells of all aspects ratios mechanically interact by forming collagen tracts (a and c). However, as the separation distance increases, only cells with high aspect ratios (d) can mechanically interact with each other, while no visible collagen tracts are observed for circular cells (b). (e-i) Numerical results from continuum models 8. Contour plots of the maximum principal strain in three-dimensional matrices for linear isotropic materials (e) and fibrous materials (f). Vector plots of the maximum principal strain which coincides with the orientation of the collagen fibers after cellular contraction (g). Contour plots of the maximum principal strain on two-dimensional matrices for linear isotropic materials (h) and fibrous materials (i).
Figure 9.
Figure 9.
Different networks for discrete fiber simulations. (a) A triangular lattice network. The arc denotes that one of the three crossing fibers is detached from the cross-link which reduces the local connectivity from 6 to 4. (b) A hexagonal lattice which has a local connectivity of 3. (c) A Delaunay network with a nonuniform local connectivity which has the average local connectivity of 6. (d) A Voronoi network which has a local connectivity of 3.

References

    1. Weiss P, Roux Archiv für Entwicklungsmechanik der Organismen, 1929, 116, 438–554. - PubMed
    1. Janmey PA, Amis EJ and Ferry JD, Journal of Rheology, 1983, 27, 135–153.
    1. Storm C, Pastore JJ, MacKintosh FC, Lubensky TC and Janmey PA, Nature, 2005, 435, 191–194. - PubMed
    1. Onck PR, Koeman T, van Dillen T and van der Giessen E, Physical Review Letters, 2005, 95. - PubMed
    1. Wang H, Abhilash AS, Christopher S.Chen, Wells Rebecca G.and Shenoy Vivek B., Biophysical Journal, 2014, 107, 2592–2603. - PMC - PubMed

LinkOut - more resources