

Multisystem Imaging Manifestations of COVID-19, Part 2: From Cardiac Complications to Pediatric Manifestations
- PMID: 33136488
- PMCID: PMC7646410
- DOI: 10.1148/rg.2020200195
Multisystem Imaging Manifestations of COVID-19, Part 2: From Cardiac Complications to Pediatric Manifestations
Abstract
Infection with severe acute respiratory syndrome coronavirus 2 results in coronavirus disease 2019 (COVID-19), which was declared an official pandemic by the World Health Organization on March 11, 2020. COVID-19 has been reported in most countries, and as of August 15, 2020, there have been over 21 million cases of COVID-19 reported worldwide, with over 800 000 COVID-19-associated deaths. Although COVID-19 predominantly affects the respiratory system, it has become apparent that many other organ systems can also be involved. Imaging plays an essential role in the diagnosis of all manifestations of the disease and its related complications, and proper utilization and interpretation of imaging examinations is crucial. A comprehensive understanding of the diagnostic imaging hallmarks, imaging features, multisystem involvement, and evolution of imaging findings is essential for effective patient management and treatment. In part 1 of this article, the authors described the viral pathogenesis, diagnostic imaging hallmarks, and manifestations of the pulmonary and peripheral and central vascular systems of COVID-19. In part 2 of this article, the authors focus on the key imaging features of the varied pathologic manifestations of COVID-19, involving the cardiac, neurologic, abdominal, dermatologic and ocular, and musculoskeletal systems, as well as the pediatric and pregnancy-related manifestations of the virus. Online supplemental material is available for this article. ©RSNA, 2020.
Figures

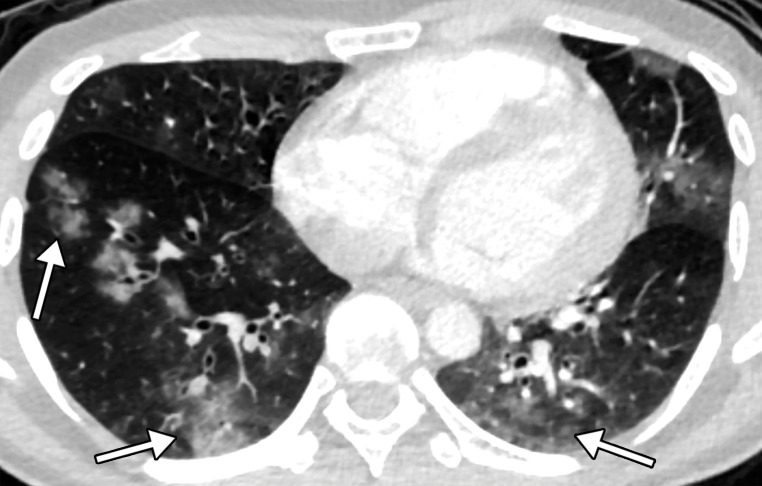
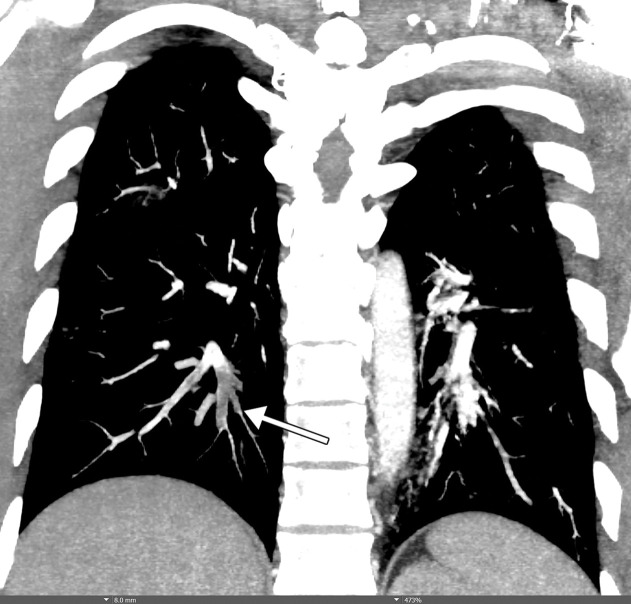
![Pulmonary edema in a 50-year-old woman with a history of end-stage renal disease who underwent hemodialysis and who was admitted to the hospital for hypoxia and pneumonia in the setting of COVID-19. (a) Upright posteroranterior chest radiograph obtained at hospital admission shows a right lower lobe consolidation (circle). (b–d) Chest radiograph (b) and axial contrast material–enhanced chest CT images (c, d) obtained after 1 month for persistent hypoxemia show pulmonary edema (with pulmonary venous congestion [black arrows in b] depicted on the chest radiograph), increasing small bilateral pleural effusions (arrows in c), cardiomegaly (arrowheads in b and c), prominent interlobular septal (arrowheads in d) and peribronchovascular (arrow in d) thickening, and diffuse ground-glass opacities. The findings are indicative of pulmonary edema superimposed on the typical appearance of COVID-19 pneumonia. Note that the right lower lobe pneumonia depicted in a is almost completely resolved in b (white arrow in b).](https://cdn.ncbi.nlm.nih.gov/pmc/blobs/3872/7646410/2a96c2c186b2/rg.2020200195.fig2a.jpg)
![Pulmonary edema in a 50-year-old woman with a history of end-stage renal disease who underwent hemodialysis and who was admitted to the hospital for hypoxia and pneumonia in the setting of COVID-19. (a) Upright posteroranterior chest radiograph obtained at hospital admission shows a right lower lobe consolidation (circle). (b–d) Chest radiograph (b) and axial contrast material–enhanced chest CT images (c, d) obtained after 1 month for persistent hypoxemia show pulmonary edema (with pulmonary venous congestion [black arrows in b] depicted on the chest radiograph), increasing small bilateral pleural effusions (arrows in c), cardiomegaly (arrowheads in b and c), prominent interlobular septal (arrowheads in d) and peribronchovascular (arrow in d) thickening, and diffuse ground-glass opacities. The findings are indicative of pulmonary edema superimposed on the typical appearance of COVID-19 pneumonia. Note that the right lower lobe pneumonia depicted in a is almost completely resolved in b (white arrow in b).](https://cdn.ncbi.nlm.nih.gov/pmc/blobs/3872/7646410/a5f36ee49b84/rg.2020200195.fig2b.jpg)
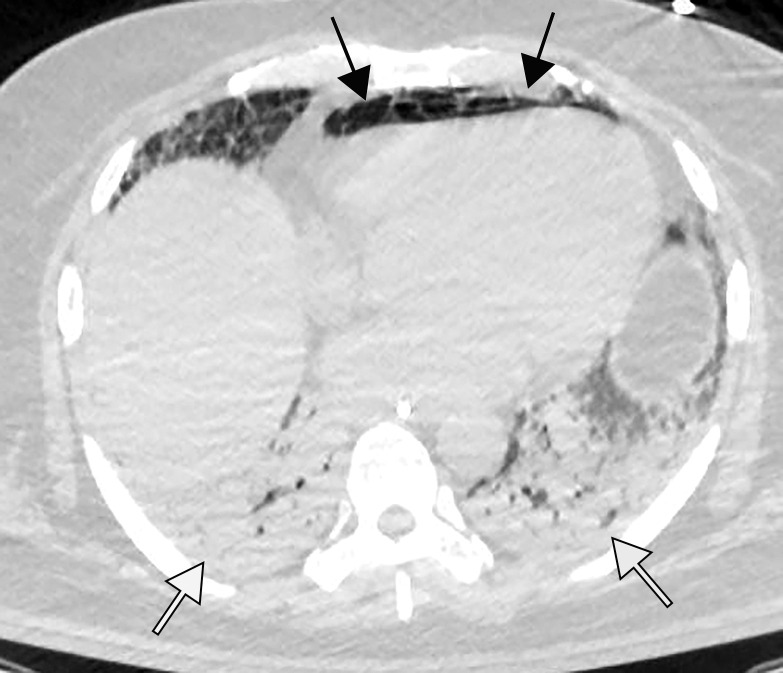
![Pulmonary edema in a 50-year-old woman with a history of end-stage renal disease who underwent hemodialysis and who was admitted to the hospital for hypoxia and pneumonia in the setting of COVID-19. (a) Upright posteroranterior chest radiograph obtained at hospital admission shows a right lower lobe consolidation (circle). (b–d) Chest radiograph (b) and axial contrast material–enhanced chest CT images (c, d) obtained after 1 month for persistent hypoxemia show pulmonary edema (with pulmonary venous congestion [black arrows in b] depicted on the chest radiograph), increasing small bilateral pleural effusions (arrows in c), cardiomegaly (arrowheads in b and c), prominent interlobular septal (arrowheads in d) and peribronchovascular (arrow in d) thickening, and diffuse ground-glass opacities. The findings are indicative of pulmonary edema superimposed on the typical appearance of COVID-19 pneumonia. Note that the right lower lobe pneumonia depicted in a is almost completely resolved in b (white arrow in b).](https://cdn.ncbi.nlm.nih.gov/pmc/blobs/3872/7646410/c44259fcc187/rg.2020200195.fig2c.jpg)
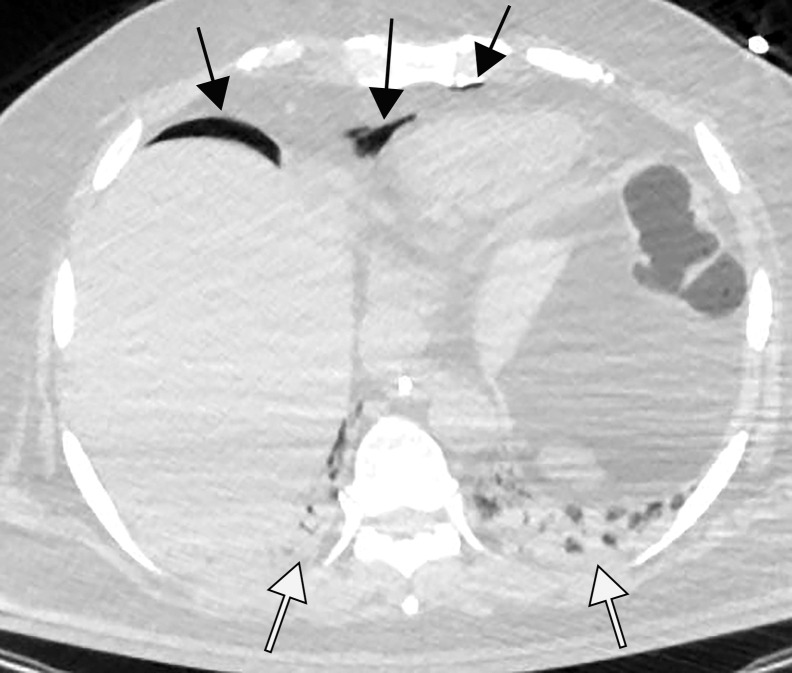
![Pulmonary edema in a 50-year-old woman with a history of end-stage renal disease who underwent hemodialysis and who was admitted to the hospital for hypoxia and pneumonia in the setting of COVID-19. (a) Upright posteroranterior chest radiograph obtained at hospital admission shows a right lower lobe consolidation (circle). (b–d) Chest radiograph (b) and axial contrast material–enhanced chest CT images (c, d) obtained after 1 month for persistent hypoxemia show pulmonary edema (with pulmonary venous congestion [black arrows in b] depicted on the chest radiograph), increasing small bilateral pleural effusions (arrows in c), cardiomegaly (arrowheads in b and c), prominent interlobular septal (arrowheads in d) and peribronchovascular (arrow in d) thickening, and diffuse ground-glass opacities. The findings are indicative of pulmonary edema superimposed on the typical appearance of COVID-19 pneumonia. Note that the right lower lobe pneumonia depicted in a is almost completely resolved in b (white arrow in b).](https://cdn.ncbi.nlm.nih.gov/pmc/blobs/3872/7646410/8cce645215bb/rg.2020200195.fig2d.jpg)


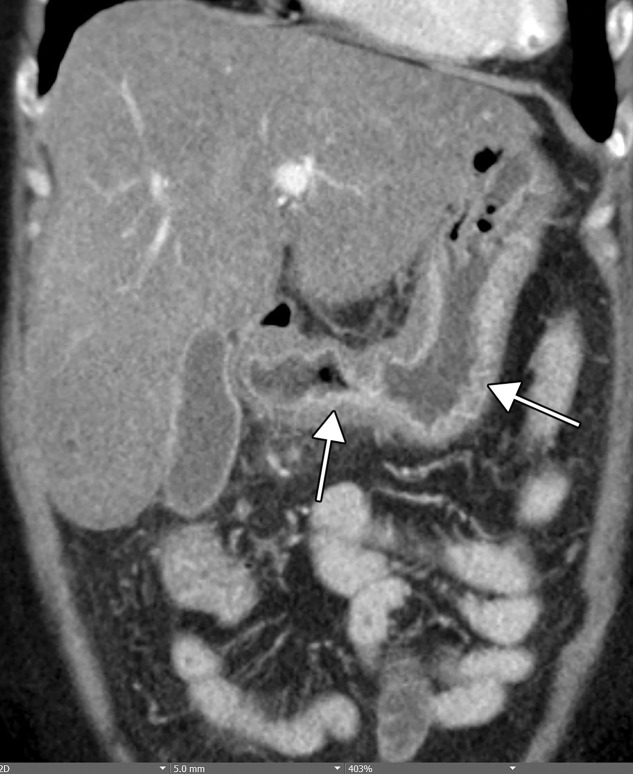

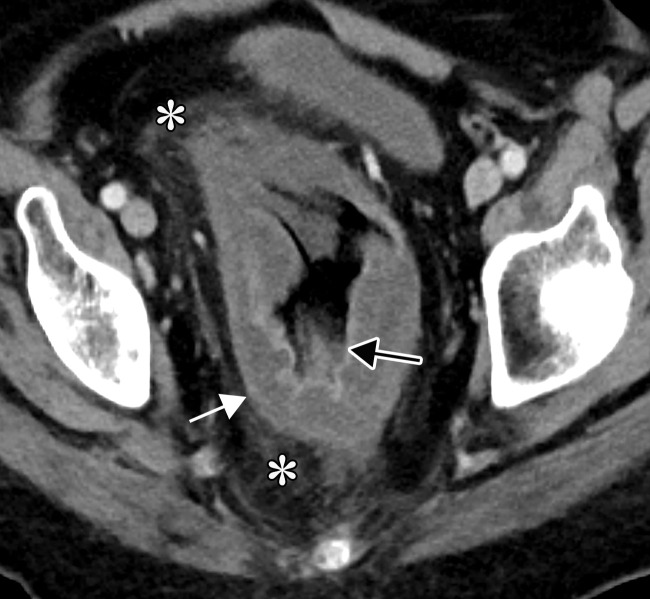

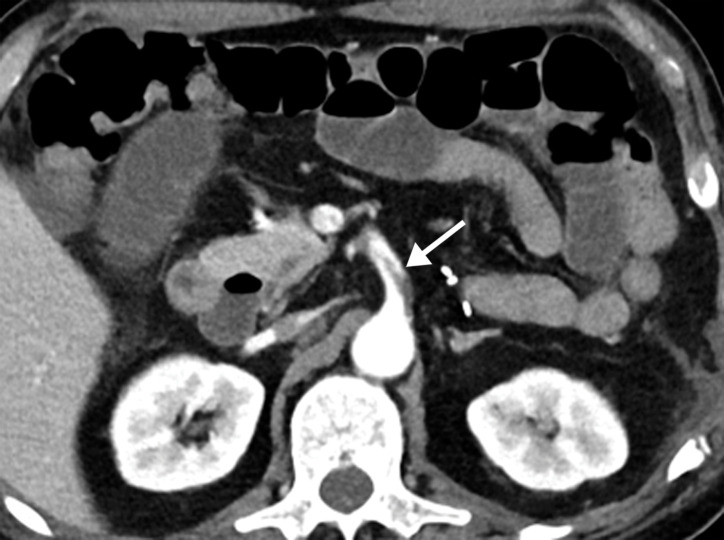
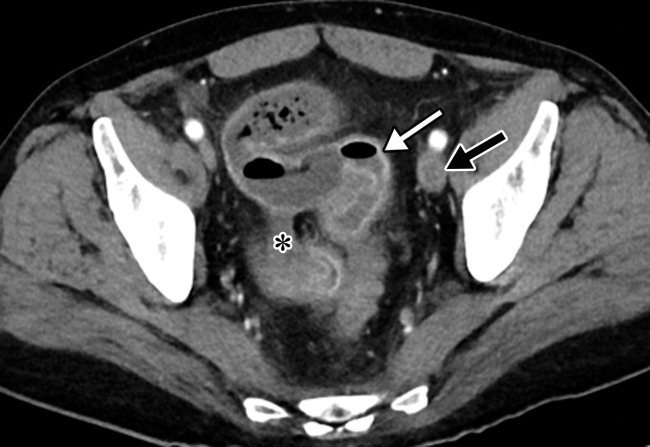

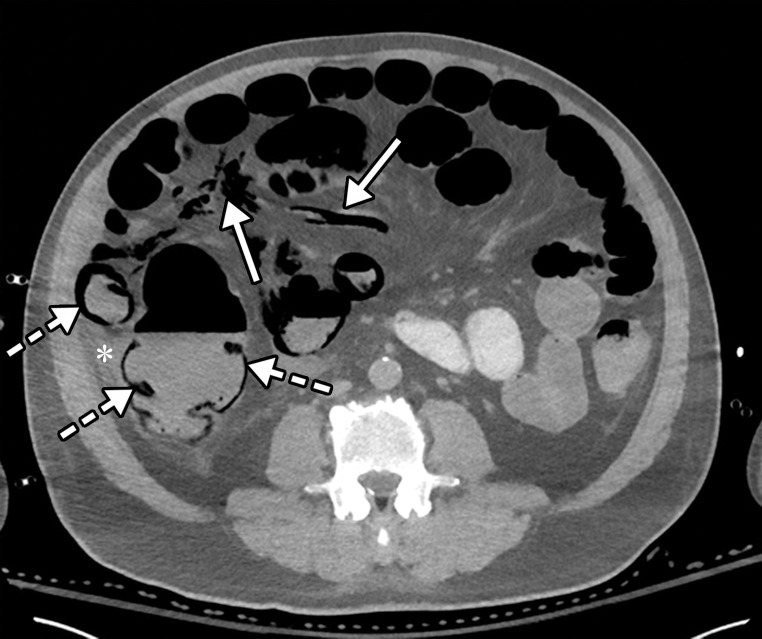

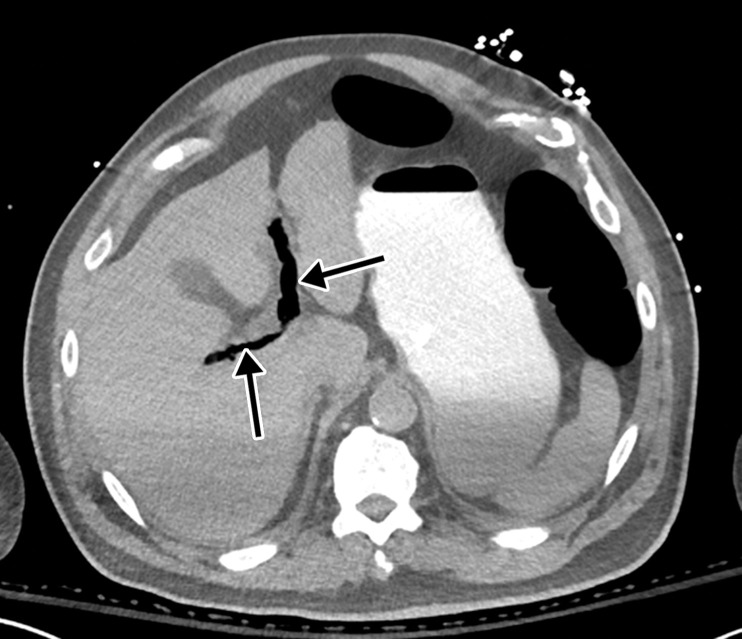
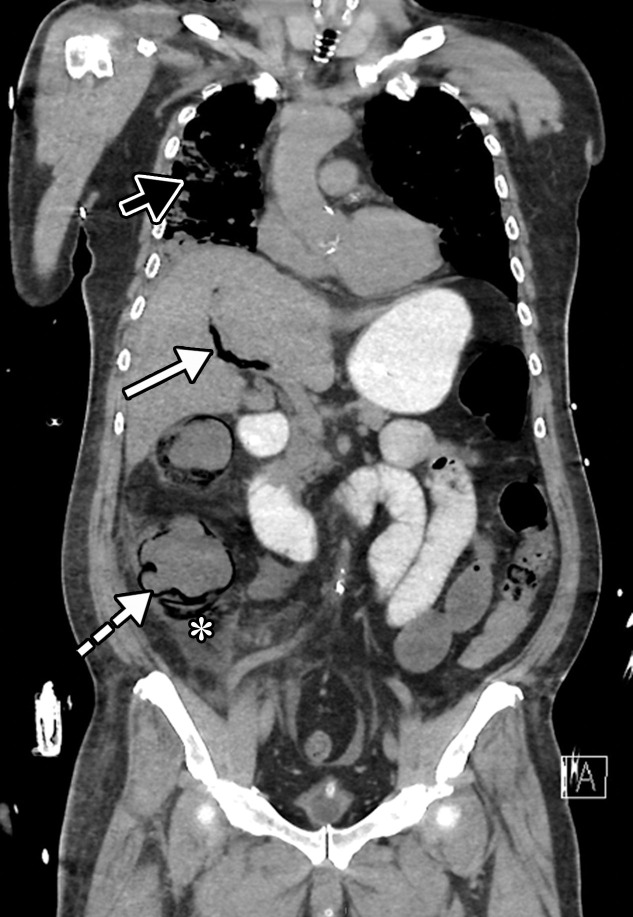
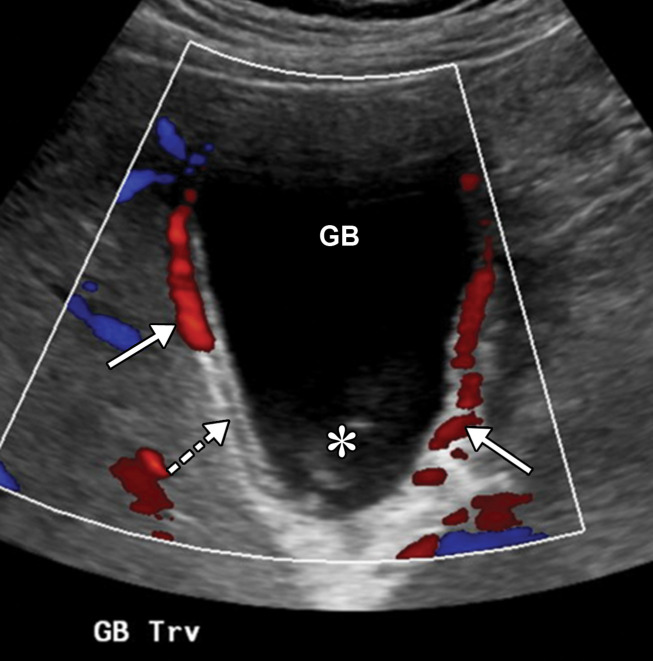
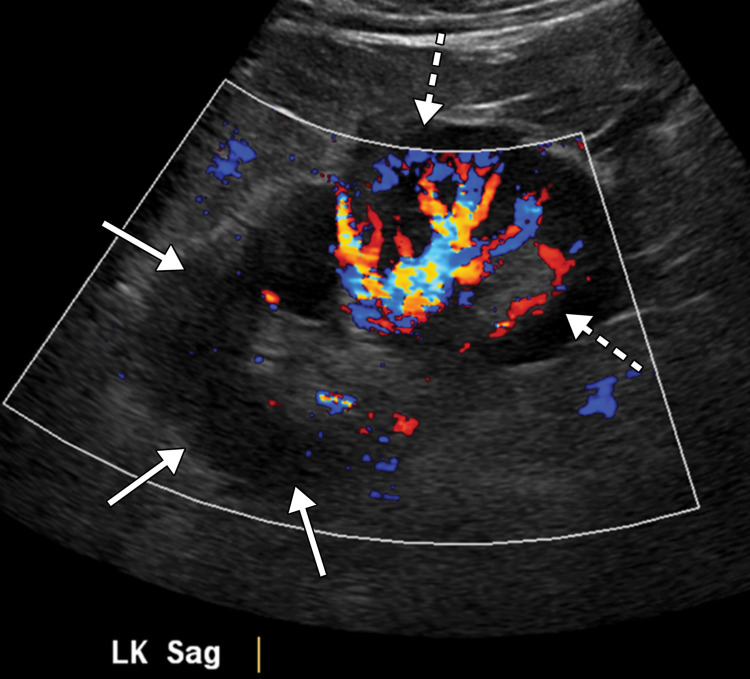
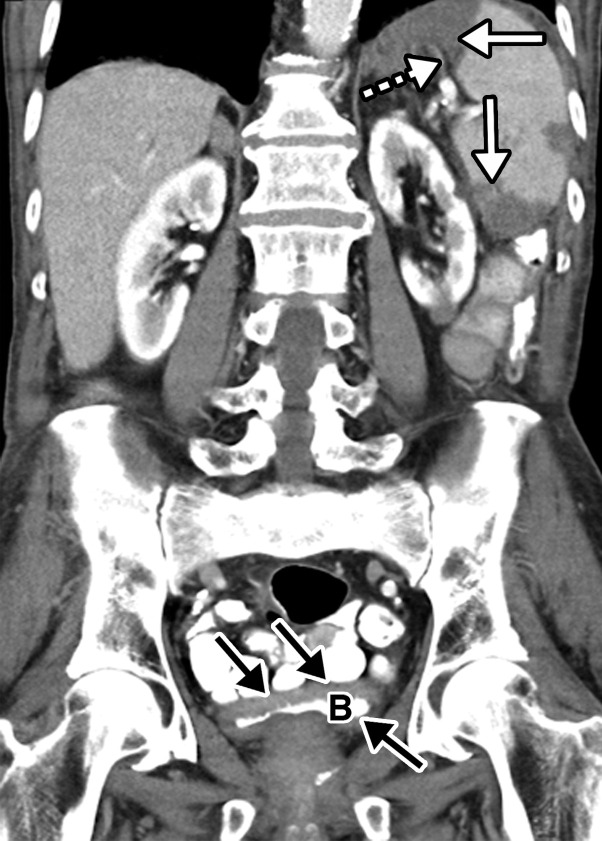
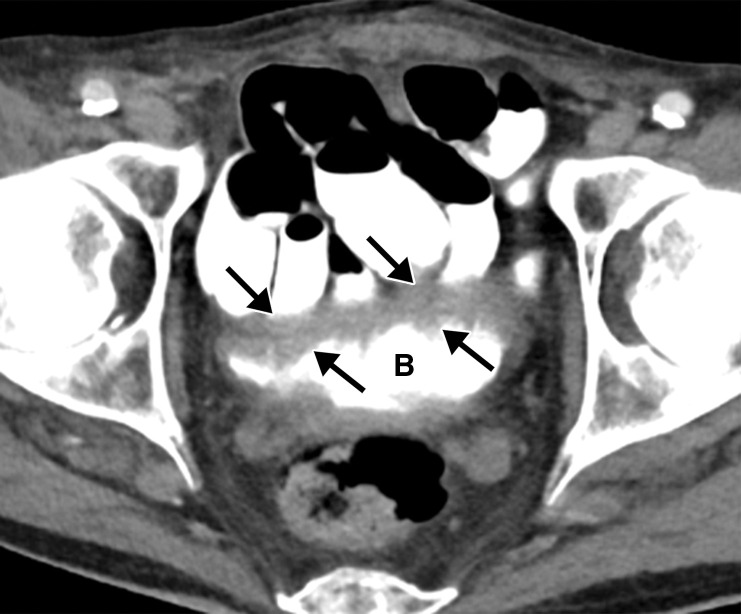
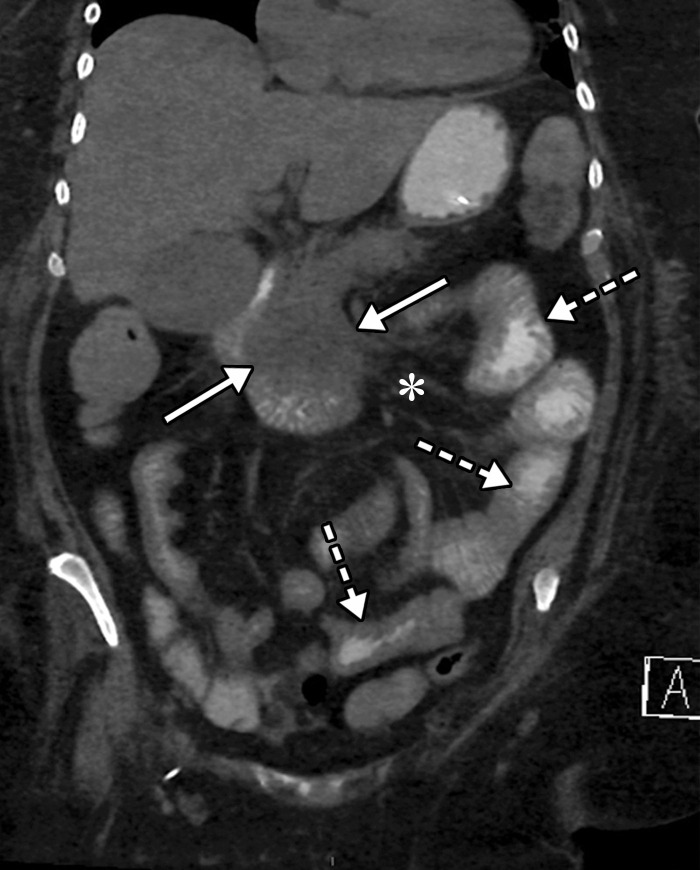
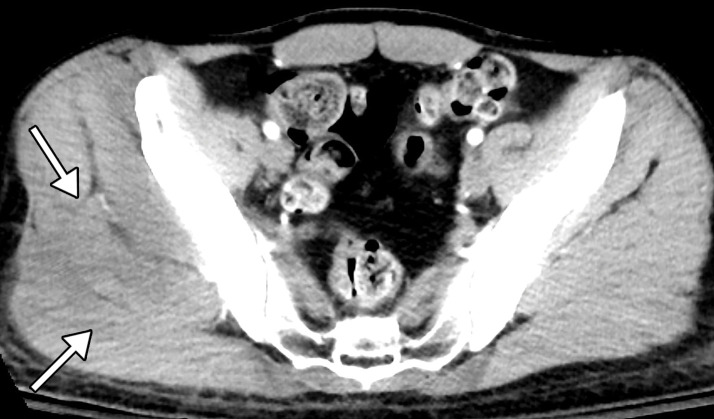
![Ischemic enterocolitis, periportal edema, mesenteric congestion, ascites, and multifocal bilateral native and renal transplant infarcts in a severely ill 75-year-old man with COVID-19 pneumonia, elevated liver function test results, and oliguria. (a, b) Coronal (a) and axial (b) contrast-enhanced images of the abdomen and pelvis show marked pericholecystic and periportal edema (white arrows) and thickened small and large bowel (black arrows). Note that the colon is fluid filled. Multifocal wedge-shaped areas of hypoattenuation are depicted in the renal cortex of the transplant kidney allograft and native kidneys (arrowheads), compatible with multifocal native renal and renal transplant infarcts. Note the marked heterogeneity of the liver parenchyma that could be attributable to hepatitis (* in a). The main mesenteric vasculature was patent. Mesenteric congestion and ascites were also present, implying the manifestation of mesenteric ischemia, likely as a result of microthrombosis. (c) Endoscopic image of the left colon shows denudation of the colonic epithelium, compatible with ischemic colitis. (Case courtesy of Christine [Cooky] Menias, MD, Mayo Clinic, Phoenix, Ariz.)](https://cdn.ncbi.nlm.nih.gov/pmc/blobs/3872/7646410/b7547d1091bd/rg.2020200195.fig16a.jpg)
![Ischemic enterocolitis, periportal edema, mesenteric congestion, ascites, and multifocal bilateral native and renal transplant infarcts in a severely ill 75-year-old man with COVID-19 pneumonia, elevated liver function test results, and oliguria. (a, b) Coronal (a) and axial (b) contrast-enhanced images of the abdomen and pelvis show marked pericholecystic and periportal edema (white arrows) and thickened small and large bowel (black arrows). Note that the colon is fluid filled. Multifocal wedge-shaped areas of hypoattenuation are depicted in the renal cortex of the transplant kidney allograft and native kidneys (arrowheads), compatible with multifocal native renal and renal transplant infarcts. Note the marked heterogeneity of the liver parenchyma that could be attributable to hepatitis (* in a). The main mesenteric vasculature was patent. Mesenteric congestion and ascites were also present, implying the manifestation of mesenteric ischemia, likely as a result of microthrombosis. (c) Endoscopic image of the left colon shows denudation of the colonic epithelium, compatible with ischemic colitis. (Case courtesy of Christine [Cooky] Menias, MD, Mayo Clinic, Phoenix, Ariz.)](https://cdn.ncbi.nlm.nih.gov/pmc/blobs/3872/7646410/6a0b62f58ff8/rg.2020200195.fig16b.jpg)
![Ischemic enterocolitis, periportal edema, mesenteric congestion, ascites, and multifocal bilateral native and renal transplant infarcts in a severely ill 75-year-old man with COVID-19 pneumonia, elevated liver function test results, and oliguria. (a, b) Coronal (a) and axial (b) contrast-enhanced images of the abdomen and pelvis show marked pericholecystic and periportal edema (white arrows) and thickened small and large bowel (black arrows). Note that the colon is fluid filled. Multifocal wedge-shaped areas of hypoattenuation are depicted in the renal cortex of the transplant kidney allograft and native kidneys (arrowheads), compatible with multifocal native renal and renal transplant infarcts. Note the marked heterogeneity of the liver parenchyma that could be attributable to hepatitis (* in a). The main mesenteric vasculature was patent. Mesenteric congestion and ascites were also present, implying the manifestation of mesenteric ischemia, likely as a result of microthrombosis. (c) Endoscopic image of the left colon shows denudation of the colonic epithelium, compatible with ischemic colitis. (Case courtesy of Christine [Cooky] Menias, MD, Mayo Clinic, Phoenix, Ariz.)](https://cdn.ncbi.nlm.nih.gov/pmc/blobs/3872/7646410/8e5a5b81ba88/rg.2020200195.fig16c.jpg)


References
-
- Cantwell R, Clutton-Brock T, Cooper G, et al. Saving Mothers’ Lives: Reviewing maternal deaths to make motherhood safer: 2006-2008—The Eighth Report of the Confidential Enquiries into Maternal Deaths in the United Kingdom. BJOG 2011;118(suppl 1):1–203 [Published correction appears in BJOG 2015;122(5):e1.]. - PubMed
-
- COVID-19 Coronavirus Pandemic. https://www.worldometers.info/coronavirus/. Accessed August 15, 2020.
MeSH terms
Grants and funding
LinkOut - more resources
Full Text Sources
