

Geographic Variation In Medicare Per Capita Spending Narrowed From 2007 To 2017
- PMID: 33136493
- PMCID: PMC7935410
- DOI: 10.1377/hlthaff.2020.00188
Geographic Variation In Medicare Per Capita Spending Narrowed From 2007 To 2017
Abstract
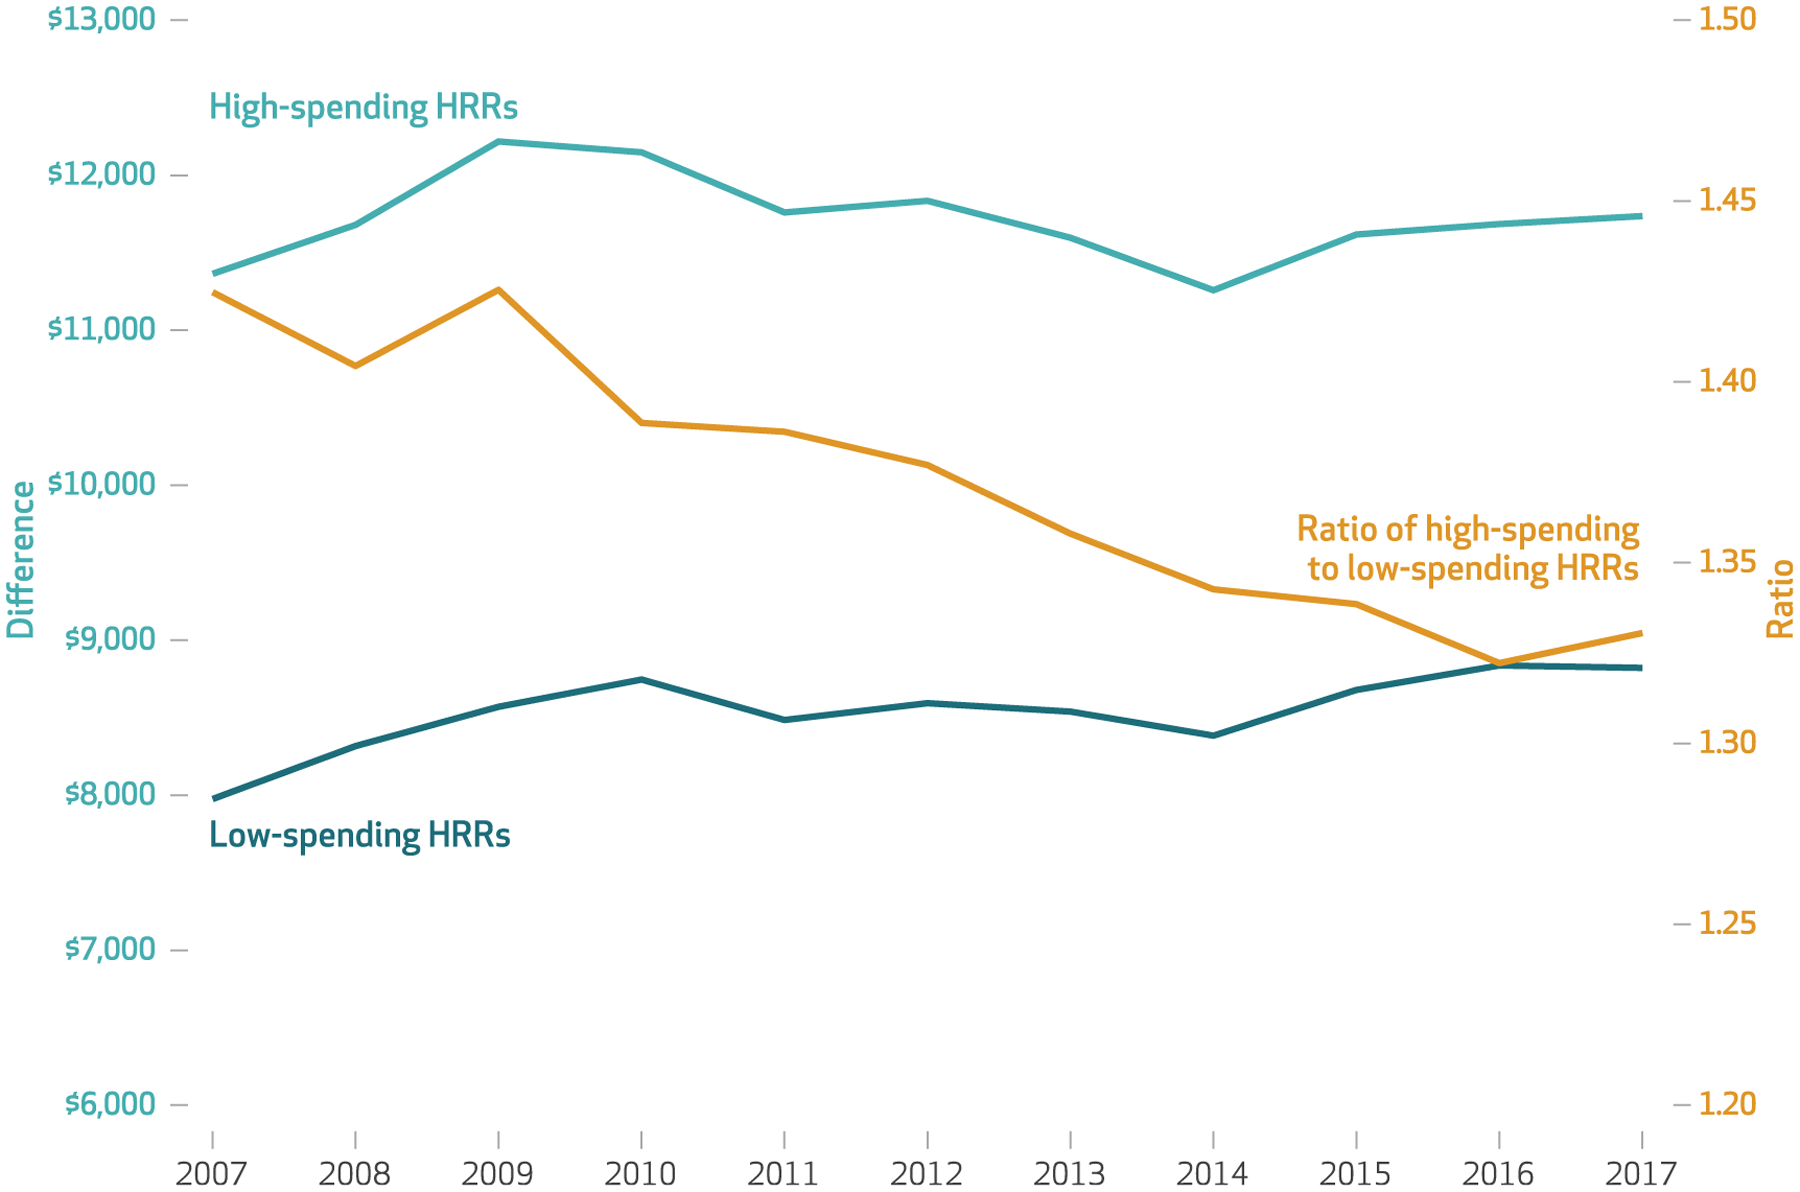
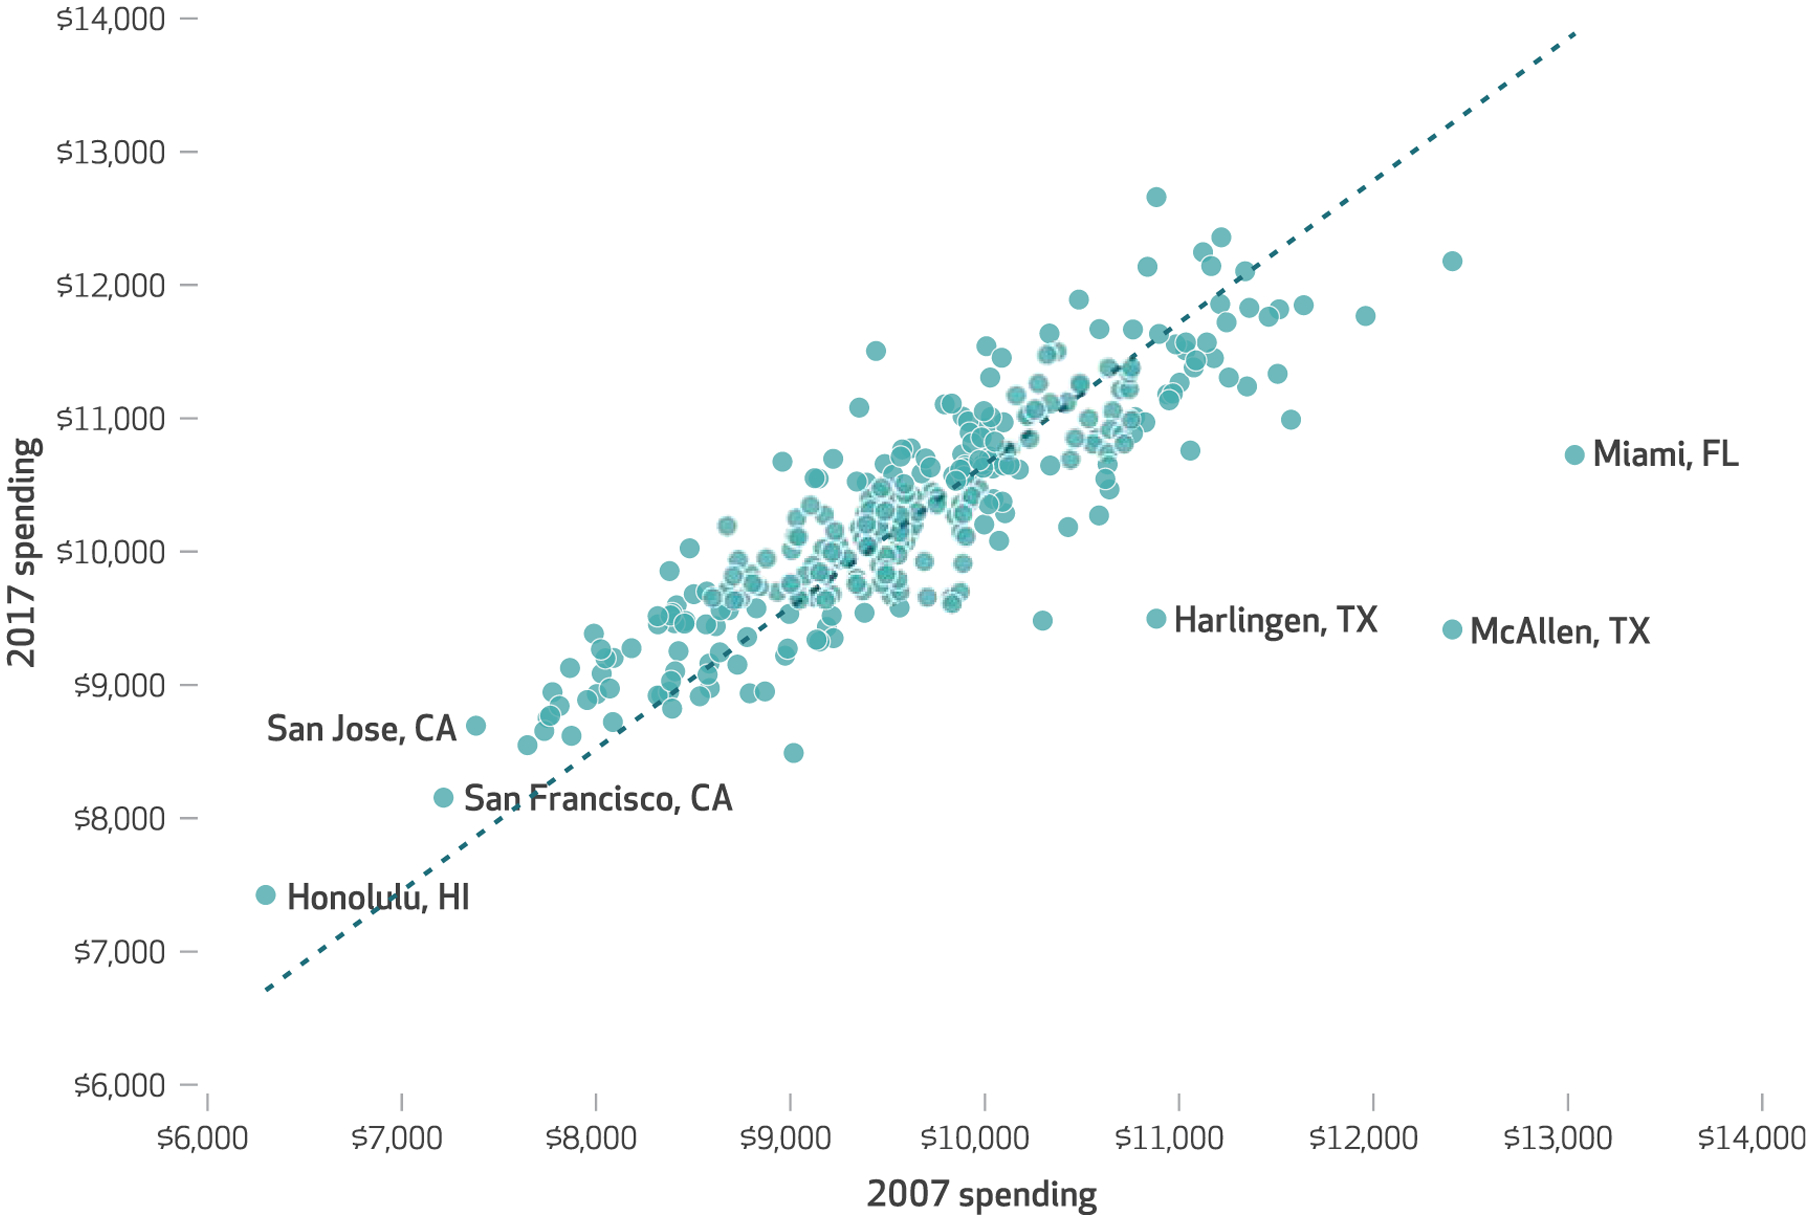
We examined the trends in geographic variation in Medicare per capita spending and growth from 2007 to 2017 and found that the variation narrowed during this period. The difference in Medicare price- and risk-adjusted per capita spending between hospital referral regions (HRRs) in the top decile and those in the bottom decile decreased from $3,388 in 2007 to $2,916 in 2017-a reduction of $472, or 14 percent. The spending convergence occurred almost entirely between 2009 and 2014, during the early years of the Affordable Care Act (ACA). The highest-spending HRRs in 2007 had the lowest annual growth rates from 2007 to 2017, and the lowest-spending HRRs in 2007 had the highest annual growth rates. We also found that a greater supply of postacute care providers, especially hospice providers, significantly predicted lower spending growth across HRRs after the implementation of the ACA.
Figures
References
-
- Newhouse JP, Garber AM, Graham RP, McCoy MA, Mancher M, Kibria A, editors. Variation in health care spending: target decision making, not geography. Washington (DC): National Academies Press; 2013. - PubMed
-
- Newhouse JP, Garber AM. Geographic variation in health care spending in the United States: in-sights from an Institute of Medicine report. JAMA. 2013;310(12):1227–8. - PubMed
-
- Newhouse JP, Garber AM. Geographic variation in Medicare services. N Engl J Med. 2013;368(16): 1465–8. - PubMed
-
- Zuckerman S, Waidmann T, Berenson R, Hadley J. Clarifying sources of geographic differences in Medicare spending. N Engl J Med. 2010;363(1):54–62. - PubMed
Publication types
MeSH terms
Grants and funding
LinkOut - more resources
Full Text Sources
Medical