. 2020 Nov 2;12(21):21446-21468.
doi: 10.18632/aging.103896. Epub 2020 Nov 2.

High phosphate induces skeletal muscle atrophy and suppresses myogenic differentiation by increasing oxidative stress and activating Nrf2 signaling

Affiliations

High phosphate induces skeletal muscle atrophy and suppresses myogenic differentiation by increasing oxidative stress and activating Nrf2 signaling

Lin-Huei Chung et al. Aging (Albany NY). .

Abstract

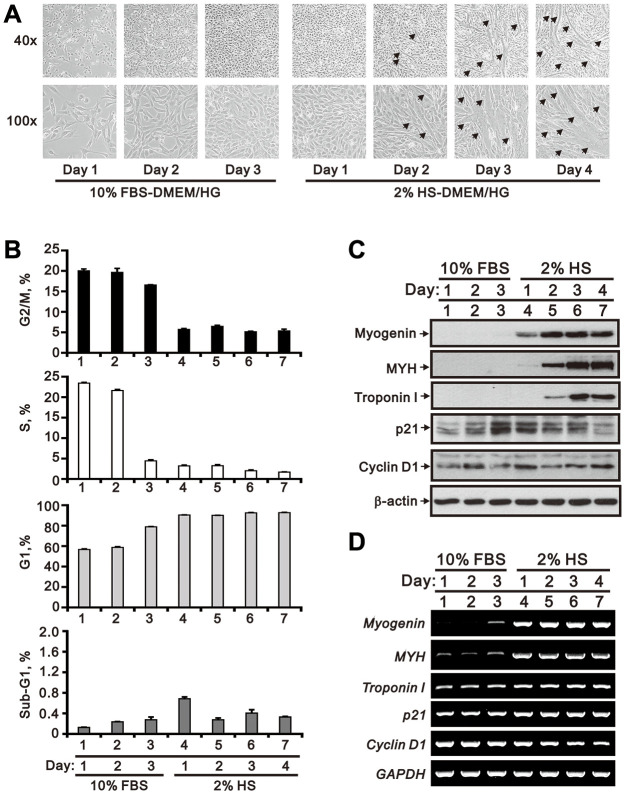
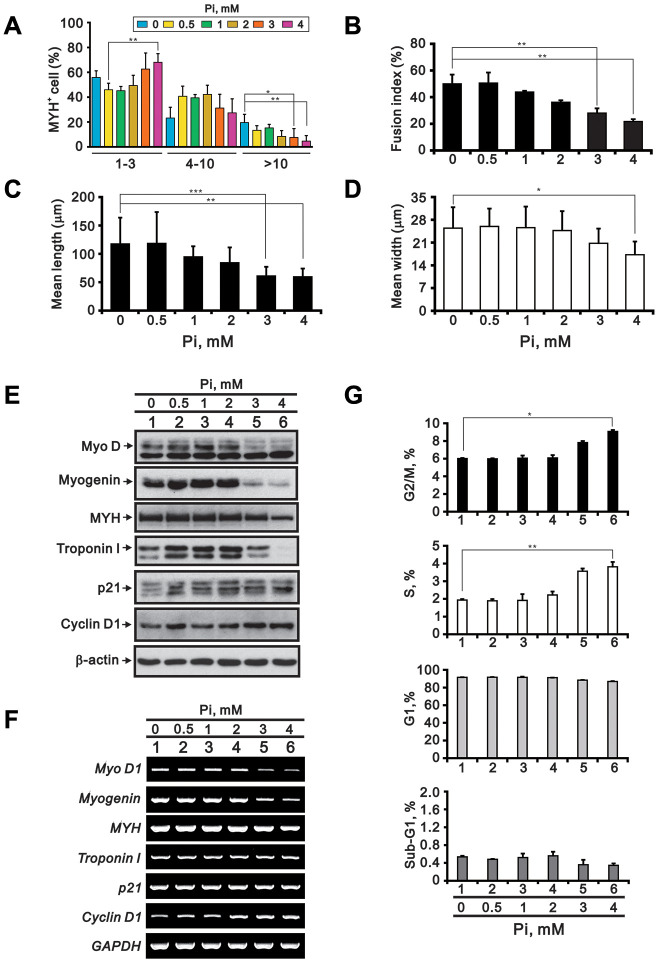
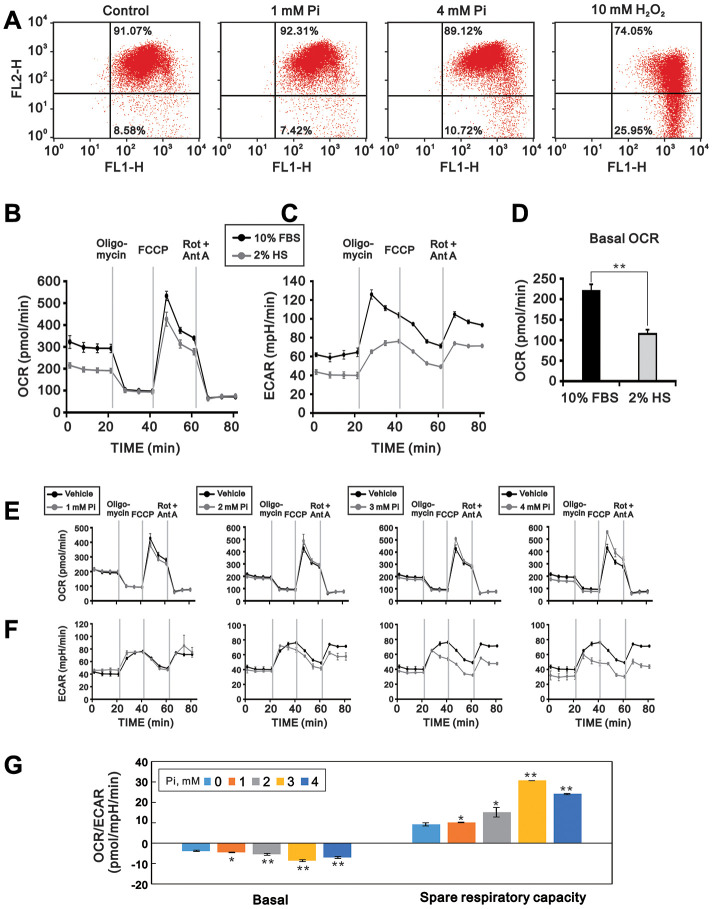
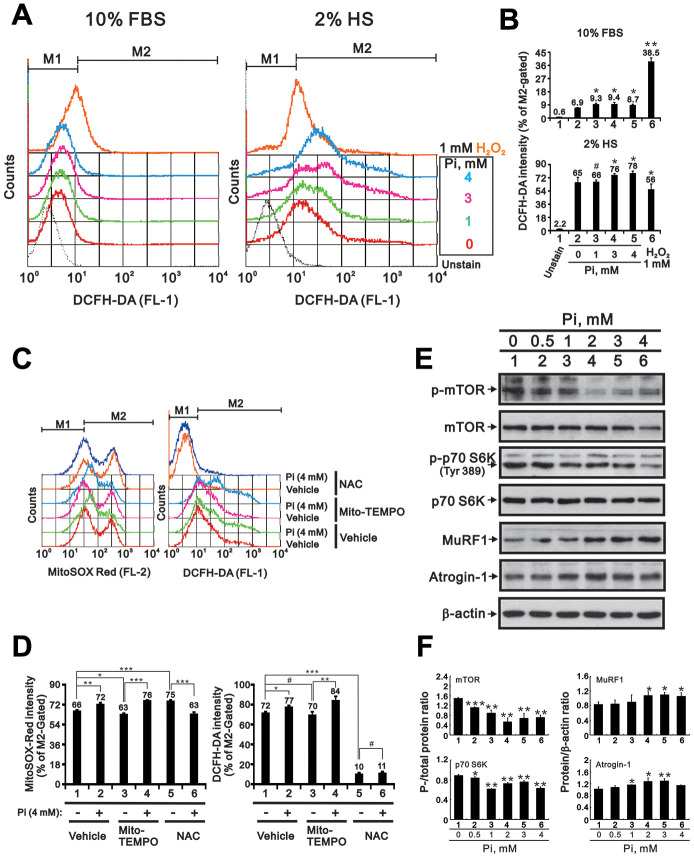
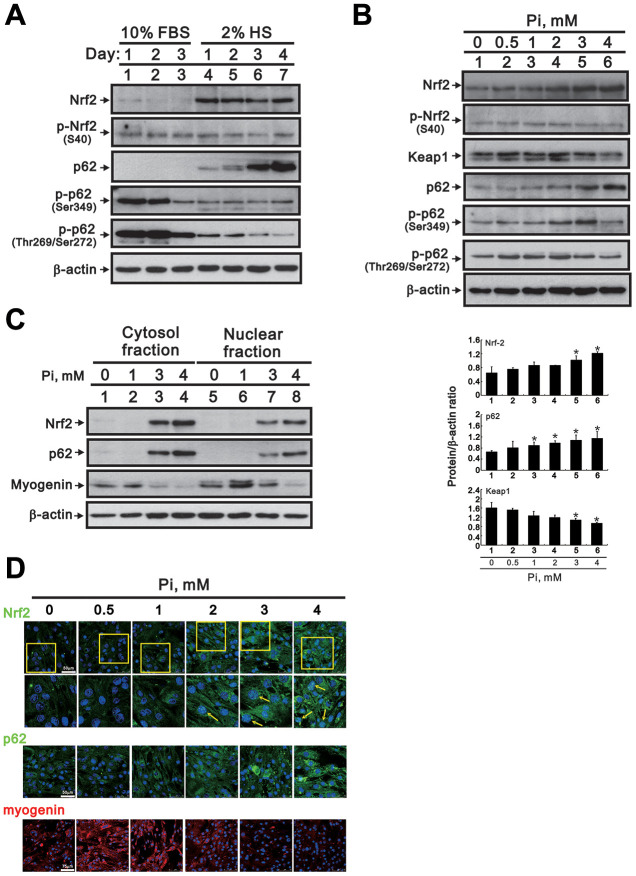
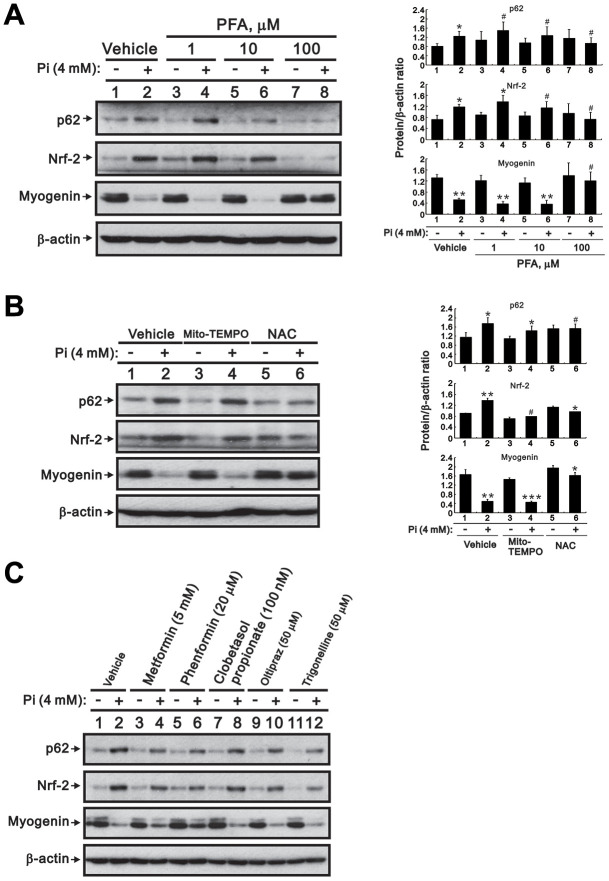
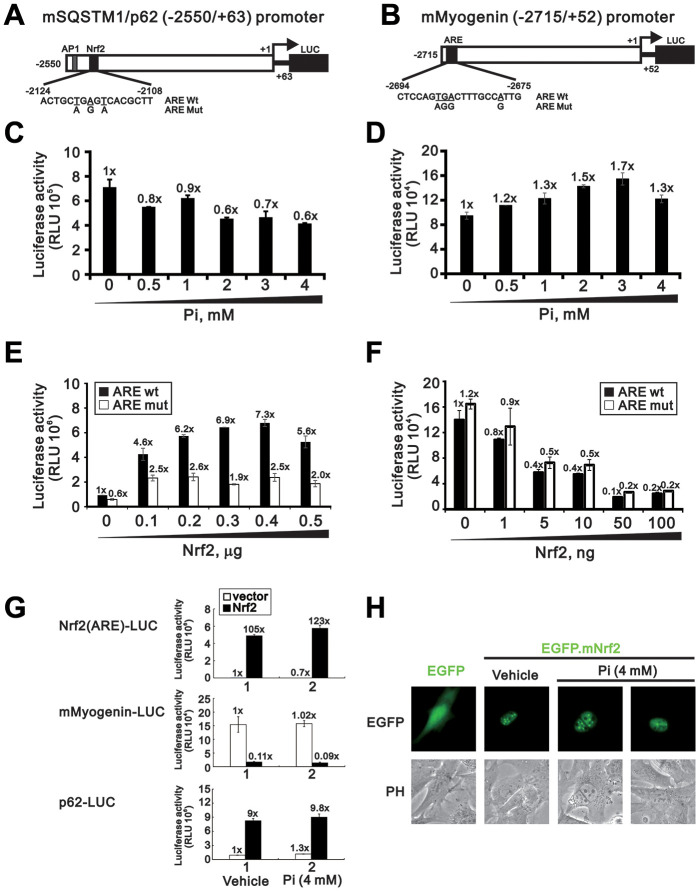
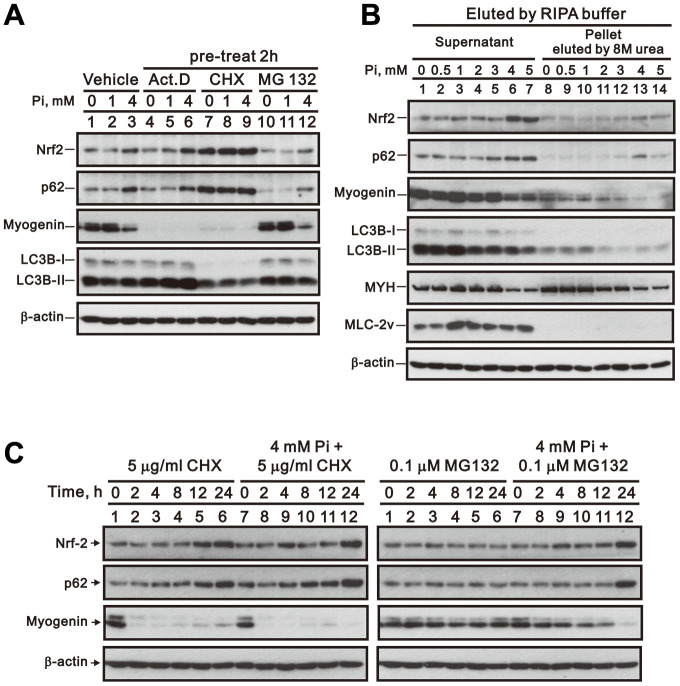
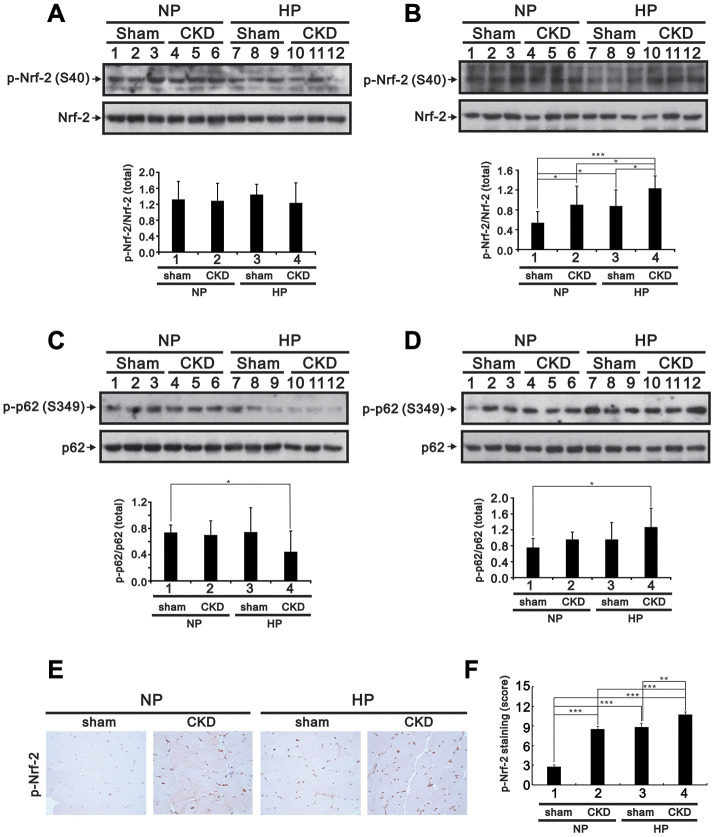
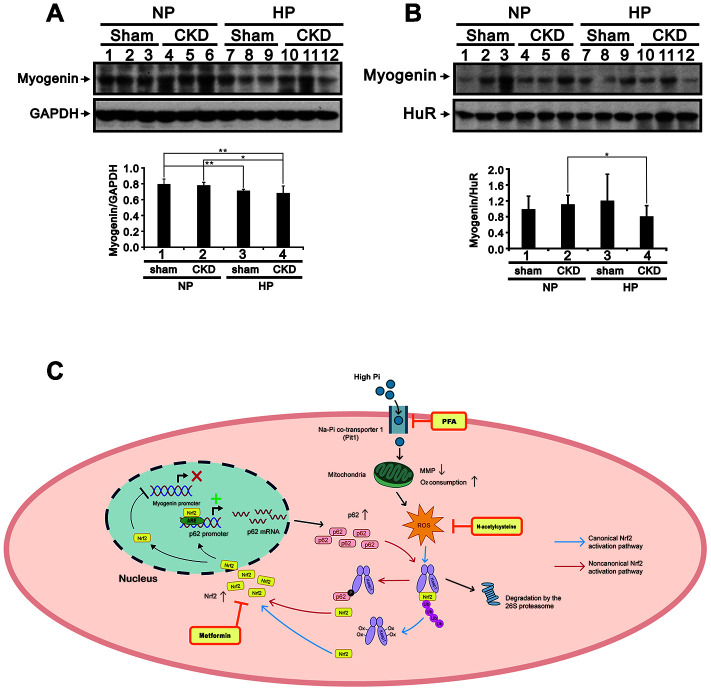
Skeletal muscle wasting represents both a common phenotype of aging and a feature of pathological conditions such as chronic kidney disease (CKD). Although both clinical data and genetic experiments in mice suggest that hyperphosphatemia accelerates muscle wasting, the underlying mechanism remains unclear. Here, we showed that inorganic phosphate (Pi) dose-dependently decreases myotube size, fusion index, and myogenin expression in mouse C2C12 skeletal muscle cells. These changes were accompanied by increases in reactive oxygen species (ROS) production and Nrf2 and p62 expression, and reductions in mitochondrial membrane potential (MMP) and Keap1 expression. Inhibition of Pi entry, cytosolic ROS production, or Nrf2 activation reversed the effects of high Pi on Nrf2, p62, and myogenin expression. Overexpression of Nrf2 respectively increased and decreased the promoter activity of p62-Luc and myogenin-Luc reporters. Analysis of nuclear extracts from gastrocnemius muscles from mice fed a high-Pi (2% Pi) diet showed increased Nrf2 phosphorylation in sham-operated and 5/6 nephrectomized (CKD) mice, and both increased p62 phosphorylation and decreased myogenin expression in CKD mice. These data suggest that high Pi suppresses myogenic differentiation in vitro and promotes muscle atrophy in vivo through oxidative stress-mediated protein degradation and both canonical (ROS-mediated) and non-canonical (p62-mediated) activation of Nrf2 signaling.

Keywords: Nrf2; hyperphosphatemia; muscle wasting; myogenic differentiation; oxidative stress.


Conflict of interest statement

CONFLICTS OF INTEREST: The authors declare no conflicts financial interests.

Figures

Figure 1
Figure 1
Morphological characteristics of proliferating and differentiating C2C12 cells in vitro. Mouse C2C12 myoblasts were cultured for 3 days in growth medium (DMEM/HG plus10% FBS), followed by 4-day incubation in differentiation medium (DMEM/HG plus 2% HS). (A) Morphological changes in C2C12 cells during the time course of proliferation and differentiation. Representative micrographs were obtained using a light microscope at 40x (upper row) or 100x (lower row) magnification. The arrows indicate mature, multinucleated myotubes. (B) Cell cycle phase distributions during the course of C2C12 growth and myogenesis. (C) Whole-cell lysate immunoblots from cultured C2C12 cells assessing the expression of myogenic differentiation markers (myogenin, MYH, and troponin I) and cell cycle regulators (p21 and cyclin D1). β-actin was used as loading control. (D) RT-PCR analysis of myogenin, MYH, troponin I, p21 and cyclin D1 mRNA in cultured C2C12 cells. GAPDH was used as loading control. Data are presented as means ± SEM.
Figure 2
Figure 2
High Pi impairs C2C12 cell differentiation. C2C12 cells were differentiated in DMEM/HG plus 2% HS for 3 days and treated for an additional 24 h with the indicated Pi concentrations. The cells were then collected and processed for the following analyses: (A) Number of nuclei per myotube (MYH staining) (B) Fusion index (C) Myotube length (D) Myotube width (E) Immunoblot analysis of myogenic differentiation markers (MyoD, myogenin, MYH and troponin I) and cell cycle regulators (p21 and cyclin D1) in whole-cell C2C12 lysates. β-actin was used as loading control. (F) RT-PCR analysis of MyoD1, myogenin, MYH, troponin I, p21, and cyclin D1. GAPDH was used as loading control. (G) Cell cycle phase distributions. Data are presented as means ± SEM. *P < 0.05, **P < 0.01, ***P < 0.001.
Figure 3
Figure 3
High Pi impairs mitochondrial function in differentiated C2C12 cells. Mitochondrial function was assayed by determining MMP, OCR, and ECAR in 3-day-differentiated C2C12 cells treated with the indicated concentrations of Pi for 24 h. (A) Flow cytometric analysis of MMP (JC-1 staining). Cells exposed to H2O2 (10 mM) for 1 h served as positive control. (B) OCR (pmol/min) and (C) ECAR (mpH/min) were measured in proliferating (10% FBS) and differentiated (2% HS) C2C12 cells using a Seahorse XF24 analyzer. (D) Comparison of basal OCR between proliferating and differentiated C2C12 cells. (E) OCR and (F) ECAR measurements in 3-day-differentiated C2C12 cells treated with the indicated concentrations of Pi for 24 h. (G) OCR/ECAR ratios during basal and maximal respiration in differentiated C2C12 cells treated with the indicated concentrations of Pi. Data are presented as means ± SEM. *P < 0.05, **P < 0.01, ***P < 0.001, compared to control (vehicle).
Figure 4
Figure 4
High Pi induces ROS generation in differentiated C2C12 cells. (A) Analysis of cytosolic ROS levels via H2DCFDA flow cytometry in proliferating (10% FBS) and differentiated (2% HS) C2C12 cells treated with the indicated concentrations of Pi for 24 h. (B) Bar graph summarizing the data from panel A. Cells exposed to 1 mM H2O2 served as positive control. *P < 0.05, **P < 0.01 vs. 0 mM Pi. (C) Assessment of mitochondrial and cytosolic ROS levels via MitoSOX Red and H2DCFDA flow cytometry. Differentiated C2C12 cells were treated for 24 h with 4 mM Pi plus the mitochondria-targeted ROS scavenger Mito-TEMPO (10 μM) or the cytosolic ROS scavenger NAC (10 mM). (D) Bar graph summarizing the data from panel (C). *P < 0.05, **P < 0.01, ***P < 0.001. (E) Representative immunoblot and (F) densitometric analyses of protein synthesis (mTOR and S6K) and degradation (MuRF1 and atrogin-1) markers in 3-day-differentiated C2C12 cells treated for 24 h with the indicated concentrations of Pi. *P < 0.05, **P < 0.01, ***P < 0.001 vs. 0 mM Pi. #P > 0.05. Data are presented as means ± SEM.
Figure 5
Figure 5
High Pi activates signaling pathways associated with oxidative stress in differentiated C2C12 cells. (A) Representative Nrf2 and p62 immunoblots from whole-cell lysates prepared from proliferating and differentiated C2C12 cells. β-actin was used as loading control. (B) Representative immunoblots (upper panel) and densitometric analysis (lower panel) of Nrf2, Keap1, and p62 expression in whole-cell lysates from 3-day-differentiated C2C12 cells treated for 24 h with the indicated Pi concentrations. Data are presented as means ± SEM. *P < 0.05 vs. 0 mM Pi. (C) Representative immunoblots of cytosolic and nuclear Nrf2, p62, and myogenin expression in 3-day-differentiated C2C12 cells treated for 24 h with the indicated Pi concentrations. (D) Representative confocal micrographs of Nrf2 (green), p62 (green) and myogenin (red) immunofluorescence in differentiated C2C12 cells treated with the indicated Pi concentrations. Nuclei were stained using DAPI (blue). The boxed areas within Nrf2 staining images are reproduced at higher magnification in the panels immediately below. Arrows highlight positive nuclear Nrf2 expression.
Figure 6
Figure 6
Inhibition of Pi transport, ROS production, or Nrf2 activity counteracts high Pi-induced changes in Nrf2, p62, and myogenin expression in differentiated C2C12 cells. (A, B) Representative immunoblots of p62, Nrf2, and myogenin expression in whole-cell lysates of 3-day-differentiated C2C12 cells treated for 24 h with (A) PFA or (B) 10 μM Mito-TEMPO or 10 mM NAC. (C) Immunoblot analysis of Nrf2, p62, and myogenin expression in whole-cell lysates of 3-day-differentiated C2C12 cells treated for 24 h with 4 mM Pi and various Nrf2 modulators. β-actin was used as loading control. Data are presented as means ± SEM. *P < 0.05, **P < 0.01, ***P < 0.001 vs. corresponding control Pi (-) plus vehicle, Mito-TEMPO, or NAC. #P > 0.05.
Figure 7
Figure 7
Nrf2 overexpression increases p62 and decreases myogenin promoter activity. Schematic diagram of predicted AREs (dark modules) and corresponding mutant ARE sequences within the mouse p62 (A) and myogenin (B) promoter regions, as determined using Genomatix-MatInspector software. (C, D) Luciferase reporter assay results. C2C12 cells were transiently transfected with a mSQSTM1/p62 (-2550/+63)-LUC reporter (C) or a myogenin (-2715/+52)-LUC reporter (D) and then treated for 24 h with the indicated Pi concentrations. (E, F) Luciferase activity measurements in C2C12 cells transiently co-transfected (24 h) with an Nrf2 expression plasmid plus a mSQSTM1/p62 (-2550/+63)-LUC (E) or a myogenin (-2715/+52)-LUC (F) reporter plasmid containing wild-type or mutant AREs. (G) Luciferase activity measurements in C2C12 cells transiently co-transfected with Nrf2(ARE)-LUC, mSQSTM1/p62 (-2550/+63)-LUC, or myogenin (-2715/+52)-LUC reporter plasmids plus an Nrf2 expression plasmid and treated for 24 h with the indicated Pi concentrations. (H) Representative fluorescence micrographs of C2C12 cells transfected with 0.5 μg of pEGFP.mNrf2 or pEGFP plasmid DNA in the presence or absence of 4 mM Pi. Data are presented as means ± SEM. PH, phase contrast.
Figure 8
Figure 8
Inhibition of RNA transcription, protein synthesis, or proteasome formation does not reverse high Pi-induced myogenin downregulation. (A) Representative whole-cell lysate immunoblots for Nrf2, p62, myogenin, and LC3B. Differentiated C2C12 cells were pretreated for 2 h with Act D (10 nM), CHX (5 μg/ml), or MG-132 (0.1 μM) and then exposed for 24 h to the indicated Pi concentrations. (B) Immunoblot analysis of Nrf2, p62, myogenin, LC3B, MYH, and MLC-2v content in protein aggregates from differentiated C2C12 cells treated for 24 h with the indicated Pi concentrations. (C) Immunoblot analysis of Nrf2, p62 and myogenin expression in whole cell lysates from differentiated C2C12 cells treated for the indicated times with CHX or MG-132, with or without 4 mM Pi.
Figure 9
Figure 9
High-Pi diet alters Nrf2 and p62 expression in GA muscle from sham-operated and CKD mice. Eight-week-old mice underwent either a sham operation or 5/6 nephrectomy (CKD), after which they were fed a normal Pi (NP) or high-Pi (HP) diet for 20 weeks. Cytosolic (A and C) and nuclear (B and D) fractions were extracted from GA muscle samples and probed for Nrf2 and p-Nrf2 (A and B) and for p62 and p-p62 (C and D). Levels of these proteins were quantified by computer-assisted densitometric analysis. (E) Representative images of p-Nrf2 immunohistochemistry in GA muscle sections. (F) Semiquantitative IHC scoring from images like those shown in (E). Data are presented as means ± SEM. *P < 0.05, **P < 0.01, ***P < 0.001.
Figure 10
Figure 10
High-Pi diet alters myogenin expression in GA muscle from sham-operated and CKD mice. Representative myogenin immunoblots from cytosolic (A) and nuclear (B) GA muscle fractions. Levels of these proteins were quantified by computer-assisted densitometric analysis. Data are presented as means ± SEM. *P < 0.05, **P < 0.01. (C) Schematic illustration of the molecular mechanism by which high Pi represses myogenic differentiation and promotes muscle atrophy. GA, gastrocnemius muscle; PFA, phosphonoformic acid; MMP, mitochondrial membrane potential; ROS, reactive oxygen species; ub-Nrf2, ubiquitinated Nrf2; ARE, antioxidant response element; Ox-Keap1, oxidized Keap1; p-p62, phosphorylated p62.

Similar articles

Cited by

References

    1. Wang XH, Mitch WE. Mechanisms of muscle wasting in chronic kidney disease. Nat Rev Nephrol. 2014; 10:504–16. 10.1038/nrneph.2014.112 - DOI - PMC - PubMed
    1. Johansen KL, Shubert T, Doyle J, Soher B, Sakkas GK, Kent-Braun JA. Muscle atrophy in patients receiving hemodialysis: effects on muscle strength, muscle quality, and physical function. Kidney Int. 2003; 63:291–97. 10.1046/j.1523-1755.2003.00704.x - DOI - PubMed
    1. McIntyre CW, Selby NM, Sigrist M, Pearce LE, Mercer TH, Naish PF. Patients receiving maintenance dialysis have more severe functionally significant skeletal muscle wasting than patients with dialysis-independent chronic kidney disease. Nephrol Dial Transplant. 2006; 21:2210–16. 10.1093/ndt/gfl064 - DOI - PubMed
    1. Berndt T, Kumar R. Phosphatonins and the regulation of phosphate homeostasis. Annu Rev Physiol. 2007; 69:341–59. 10.1146/annurev.physiol.69.040705.141729 - DOI - PubMed
    1. Kuro-o M, Matsumura Y, Aizawa H, Kawaguchi H, Suga T, Utsugi T, Ohyama Y, Kurabayashi M, Kaname T, Kume E, Iwasaki H, Iida A, Shiraki-Iida T, et al.. Mutation of the mouse klotho gene leads to a syndrome resembling ageing. Nature. 1997; 390:45–51. 10.1038/36285 - DOI - PubMed

Publication types

MeSH terms