

Classification of Hearing Aids Into Feature Profiles Using Hierarchical Latent Class Analysis Applied to a Large Dataset of Hearing Aids
- PMID: 33136637
- PMCID: PMC7722464
- DOI: 10.1097/AUD.0000000000000410
Classification of Hearing Aids Into Feature Profiles Using Hierarchical Latent Class Analysis Applied to a Large Dataset of Hearing Aids
Abstract
Objectives: We developed a framework for objectively comparing hearing aids, independent of brand, type, or product family. This was done using a large dataset of commercially available hearing aids. To achieve this, we investigated which hearing aid features are suitable for comparison, and are also relevant for the rehabilitation of hearing impairment. To compare hearing aids objectively, we distinguished populations of hearing aids based on a set of key hearing aid features. Finally, we describe these hearing aid subpopulations so that these could potentially be used as a supporting tool for the selection of an appropriate hearing aid.
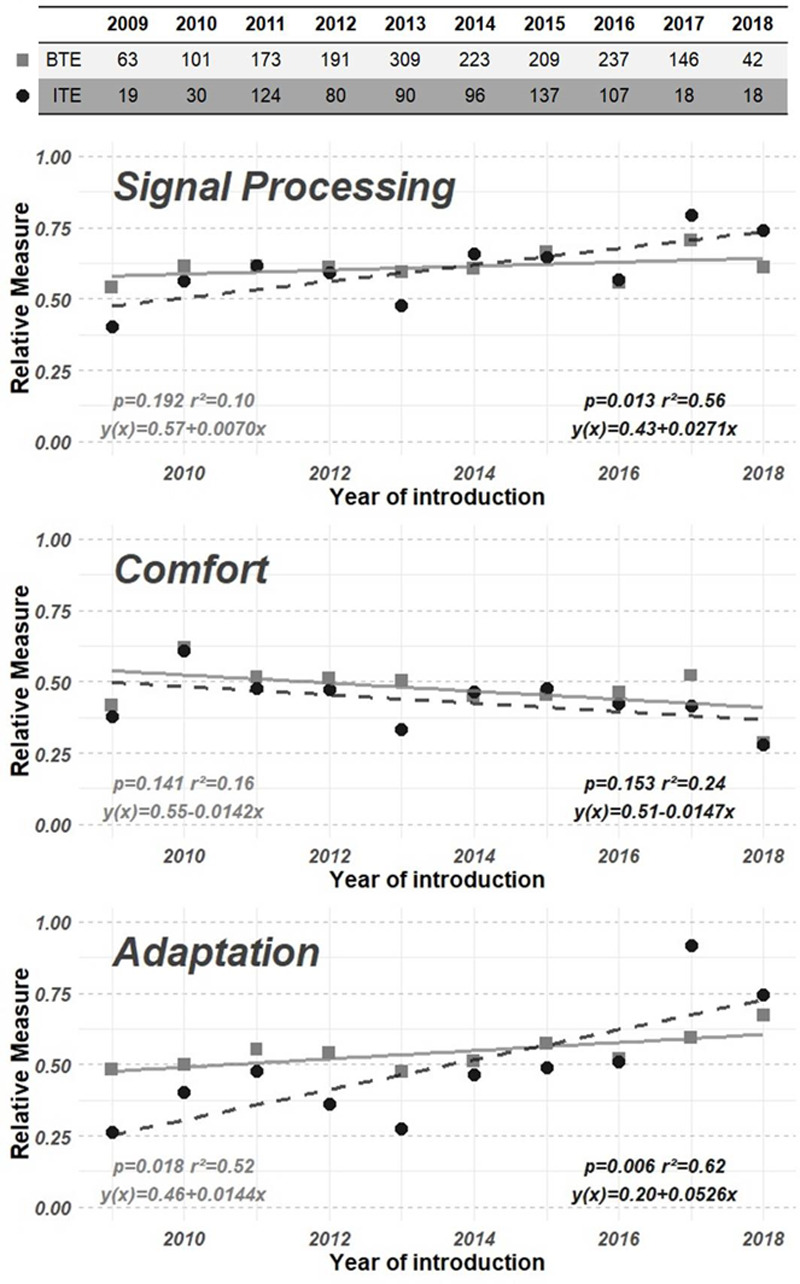
Design: In this study, we used technical (meta-)data from 3911 hearing aids (available on the Dutch market in March 2018). The dataset contained about 50 of the most important characteristics of a hearing aid. After cleaning and handling the data via a well-defined knowledge discovery in database procedure, a total 3083 hearing aids were included. Subsequently, a set of well-defined key hearing aid features were used as input for further analysis. The data were split into an in-the-ear style hearing aid subset and a behind-the-ear style subset, for separate analyses. The knowledge discovery in databases procedure was also used as an objective guiding tool for applying an exploratory cluster analysis to expose subpopulations of hearing aids within the dataset. The latter was done using Latent Class Tree Analysis, which is an extension to the better-known Latent Class Analysis clustering method: with the important addition of a hierarchical structure.
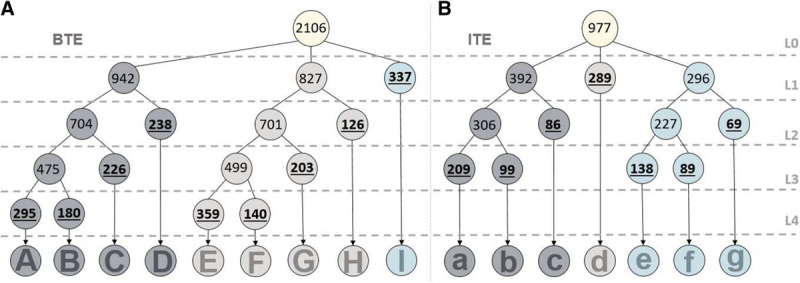
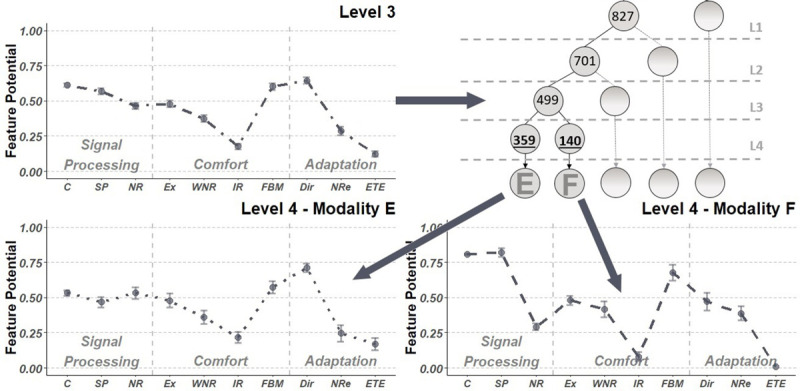
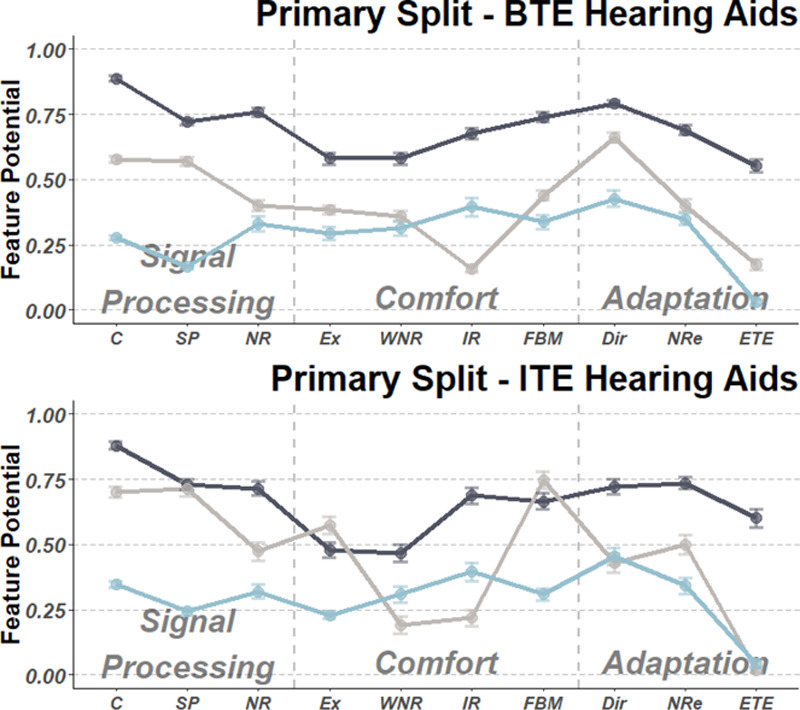
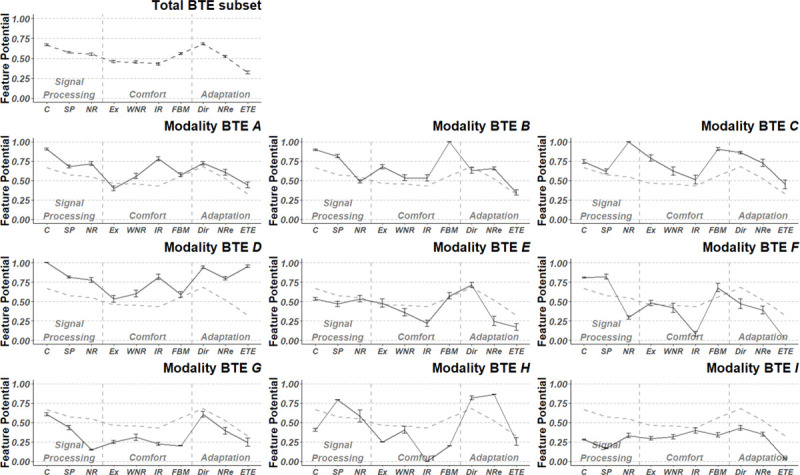
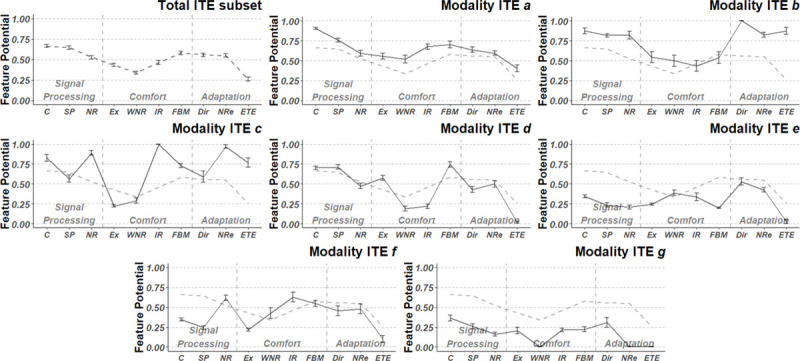
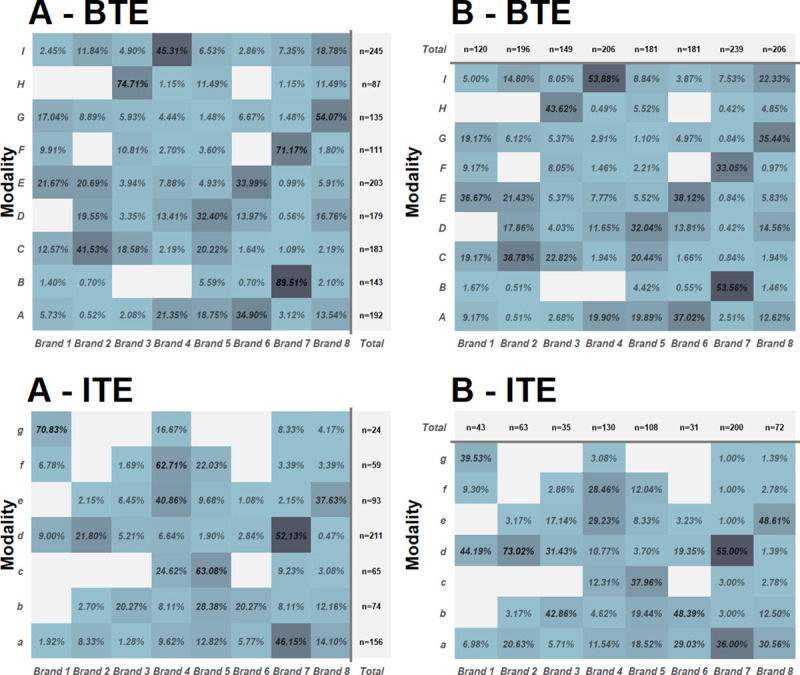
Results: A total of 10 hearing aid features were identified as relevant for audiological rehabilitation: compression, sound processing, noise reduction (NR), expansion, wind NR, impulse (noise) reduction, active feedback management, directionality, NR environments, and ear-to-ear communication. These features had the greatest impact on results yielded by the Latent Class Tree cluster analysis. At the first level in the hierarchical cluster model, the two subpopulations of hearing aids could be divided into 3 main branches, mainly distinguishable by the overall availability or technology level of hearing aid features. Higher-level results of the cluster analysis yielded a set of mutually exclusive hearing aid populations, called modalities. In total, nine behind-the-ear and seven in-the-ear modalities were found. These modalities were characterized by particular profiles of (complex) interplay between the selected key features. A technical comparison of features (e.g., implementation) is beyond the scope of this research.
Conclusions: Combining a large dataset of hearing aids with a probabilistic hierarchical clustering method enables analysis of hearing aid characteristics which extends beyond product families and manufacturers. Furthermore, this study found that the resulting hearing aid modalities can be thought of as a generic alternative to the manufacturer-dependent proprietary "concepts," and could potentially aid the selection of an appropriate hearing aid for technical rehabilitation. This study is in line with a growing need for justification of hearing aid selection and the increasing demand for evidence-based practice.
Conflict of interest statement
The authors have no conflicts of interest to disclose.
Figures
Similar articles
-
Classification of Hearing Aids Into Feature Profiles Using Hierarchical Latent Class Analysis Applied to a Large Dataset of Hearing Aids.Ear Hear. 2020 Apr 13. doi: 10.1097/AUD.0000000000000877. Online ahead of print. Ear Hear. 2020. PMID: 32287084
-
Exploring Factors That Contribute to the Success of Rehabilitation With Hearing Aids.Ear Hear. 2023 Nov-Dec 01;44(6):1514-1525. doi: 10.1097/AUD.0000000000001393. Epub 2023 Jun 9. Ear Hear. 2023. PMID: 37792897 Free PMC article.
-
Hearing aids in the real world: typical automatic behavior of expansion, directionality, and noise management.J Am Acad Audiol. 2011 Jan;22(1):34-48. doi: 10.3766/jaaa.22.1.5. J Am Acad Audiol. 2011. PMID: 21419068
-
New perspectives on assessing amplification effects.Trends Amplif. 2006 Sep;10(3):119-43. doi: 10.1177/1084713806292648. Trends Amplif. 2006. PMID: 16959734 Free PMC article. Review.
-
[The status of hearing aid technology from the audiologic viewpoint].HNO. 1988 Sep;36(9):377-82. HNO. 1988. PMID: 3049479 Review. German.
Cited by
-
Robust Data-Driven Auditory Profiling Towards Precision Audiology.Trends Hear. 2020 Jan-Dec;24:2331216520973539. doi: 10.1177/2331216520973539. Trends Hear. 2020. PMID: 33272110 Free PMC article.
References
-
- Alexander J. M., Rallapalli V. Acoustic and perceptual effects of amplitude and frequency compression on high-frequency speech. J Acoust Soc Am, (2017). 142:908. - PubMed
-
- Bentler R. A., Tubbs J. L., Egge J. L., et al. Evaluation of an adaptive directional system in a DSP hearing aid. Am J Audiol, (2004). 13:73–79. - PubMed
-
- Berkhin P. (Kogan J., Nicholas C., Teboulle M. (Eds.), A survey of clustering data mining techniques. Grouping Multidimensional Data. (2006). Springer
Publication types
MeSH terms
LinkOut - more resources
Full Text Sources
Medical
