. 2020 Nov/Dec;41(6):1660-1674.
doi: 10.1097/AUD.0000000000000882.

Effects of Head Movements on Sound-Source Localization in Single-Sided Deaf Patients With Their Cochlear Implant On Versus Off

Affiliations

Effects of Head Movements on Sound-Source Localization in Single-Sided Deaf Patients With Their Cochlear Implant On Versus Off

M Torben Pastore et al. Ear Hear. 2020 Nov/Dec.

Abstract

Objectives: We investigated the ability of single-sided deaf listeners implanted with a cochlear implant (SSD-CI) to (1) determine the front-back and left-right location of sound sources presented from loudspeakers surrounding the listener and (2) use small head rotations to further improve their localization performance. The resulting behavioral data were used for further analyses investigating the value of so-called "monaural" spectral shape cues for front-back sound source localization.

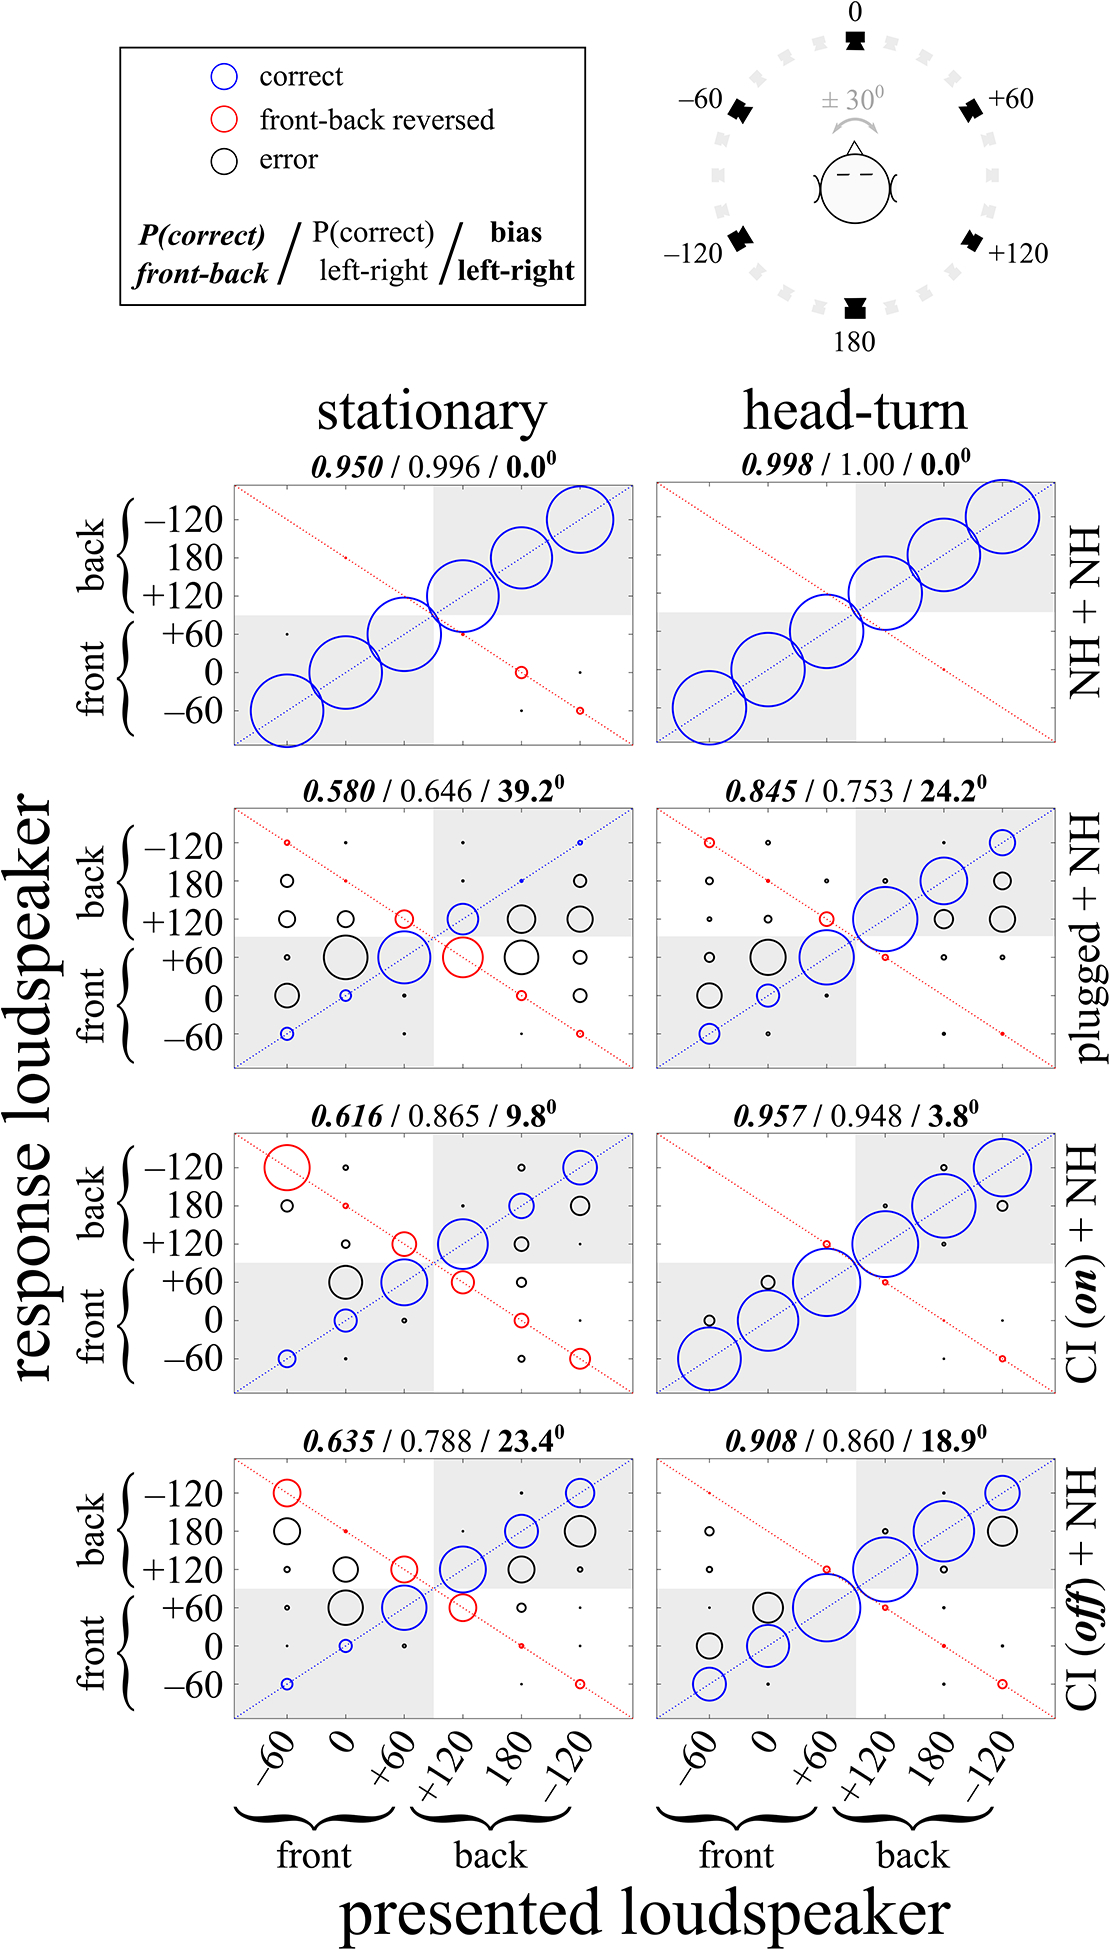
Design: Eight SSD-CI patients were tested with their cochlear implant (CI) on and off. Eight normal-hearing (NH) listeners, with one ear plugged during the experiment, and another group of eight NH listeners, with neither ear plugged, were also tested. Gaussian noises of 3-sec duration were band-pass filtered to 2-8 kHz and presented from 1 of 6 loudspeakers surrounding the listener, spaced 60° apart. Perceived sound source localization was tested under conditions where the patients faced forward with the head stationary, and under conditions where they rotated their heads between (Equation is included in full-text article.).

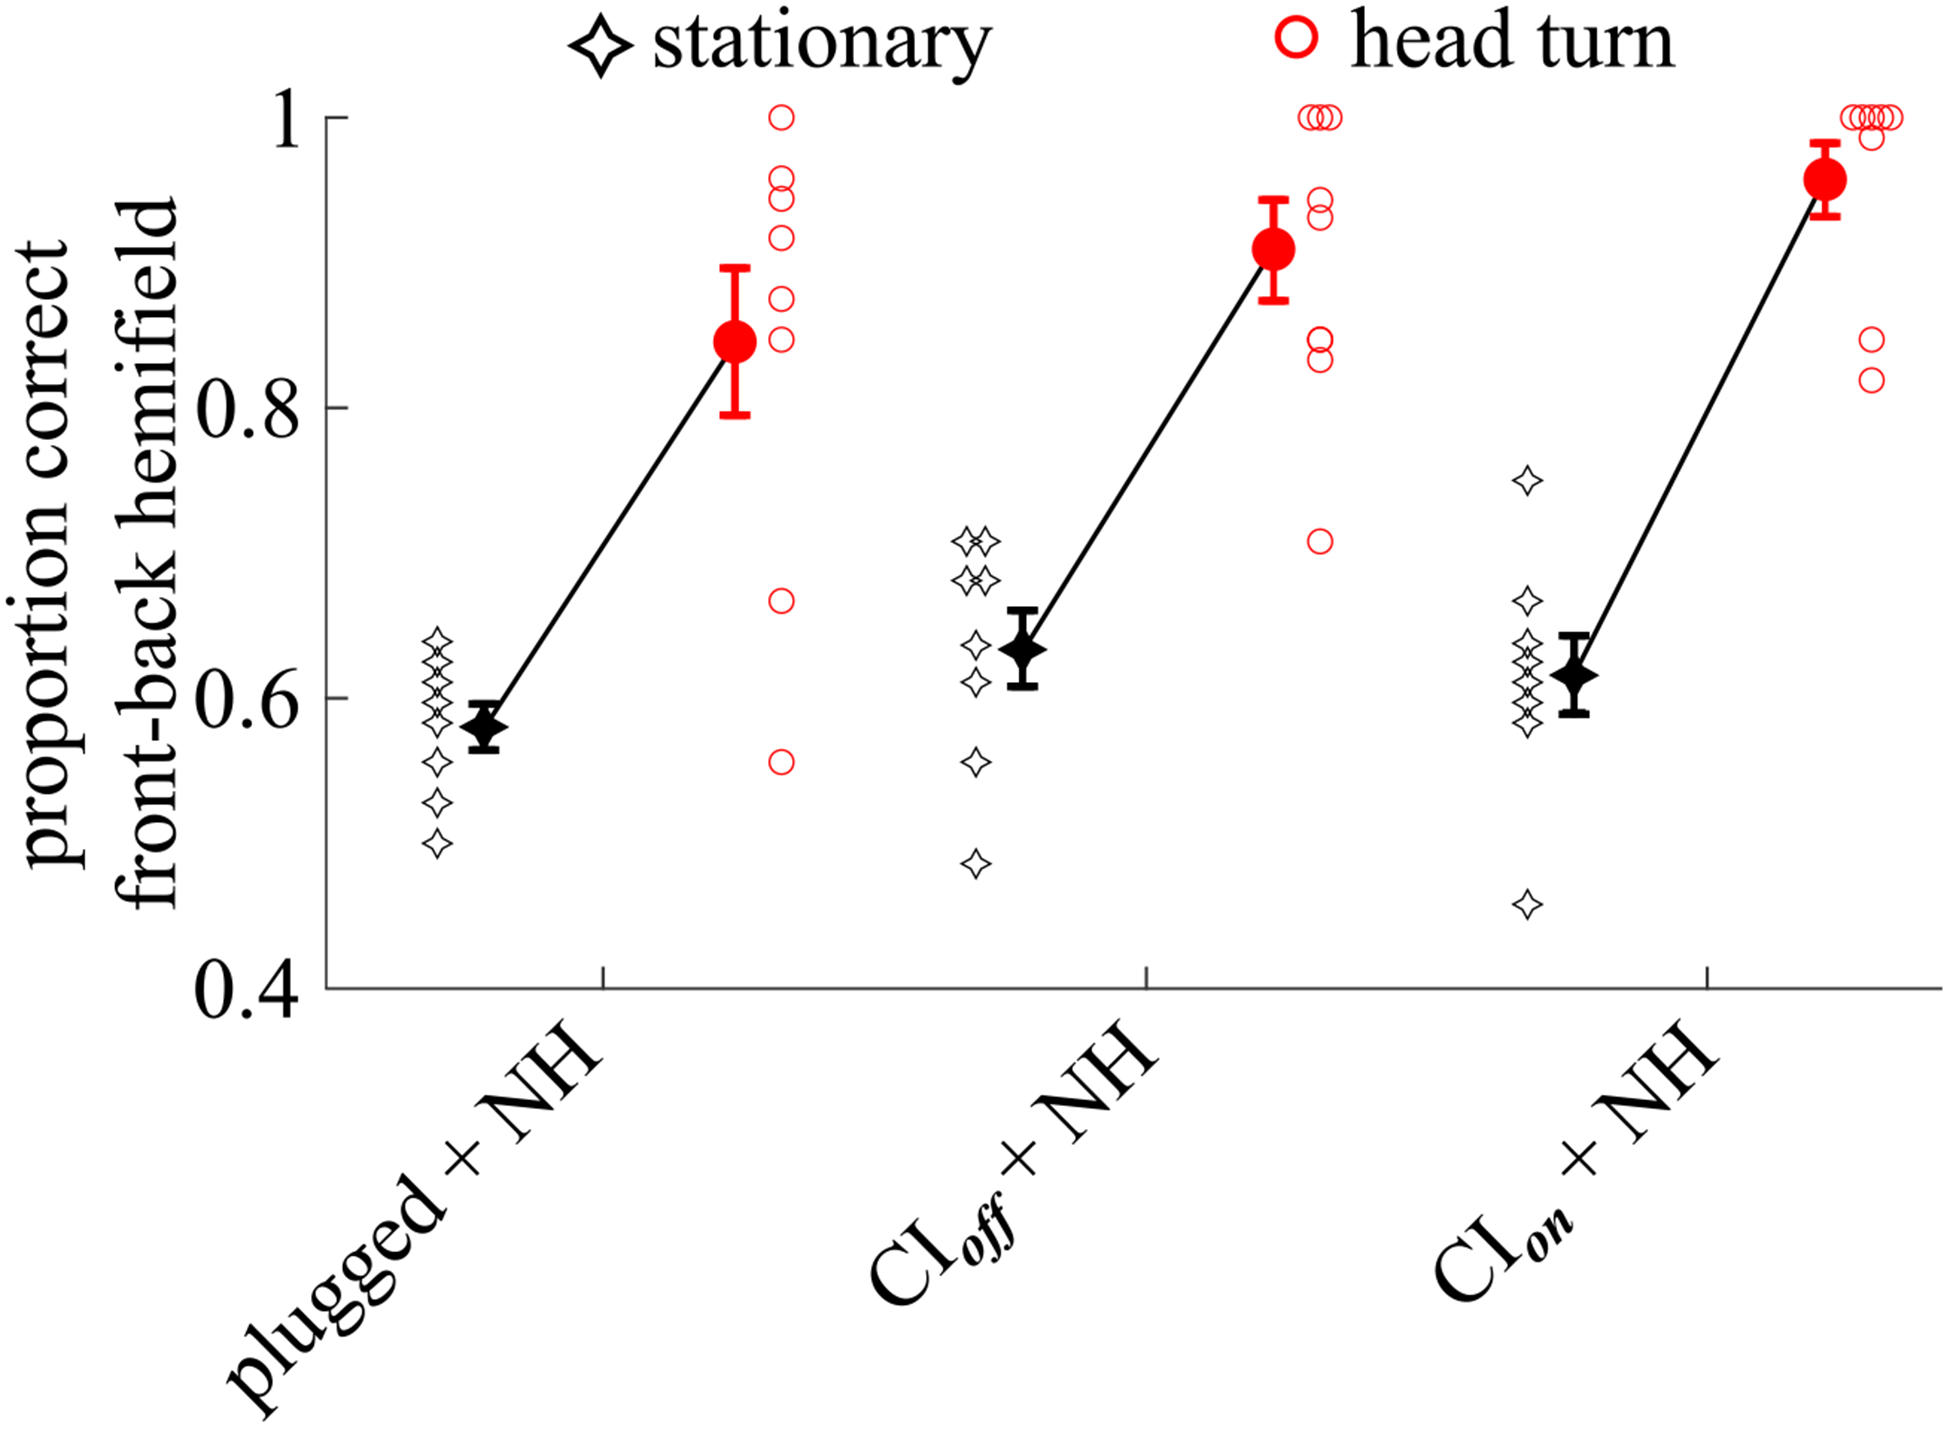
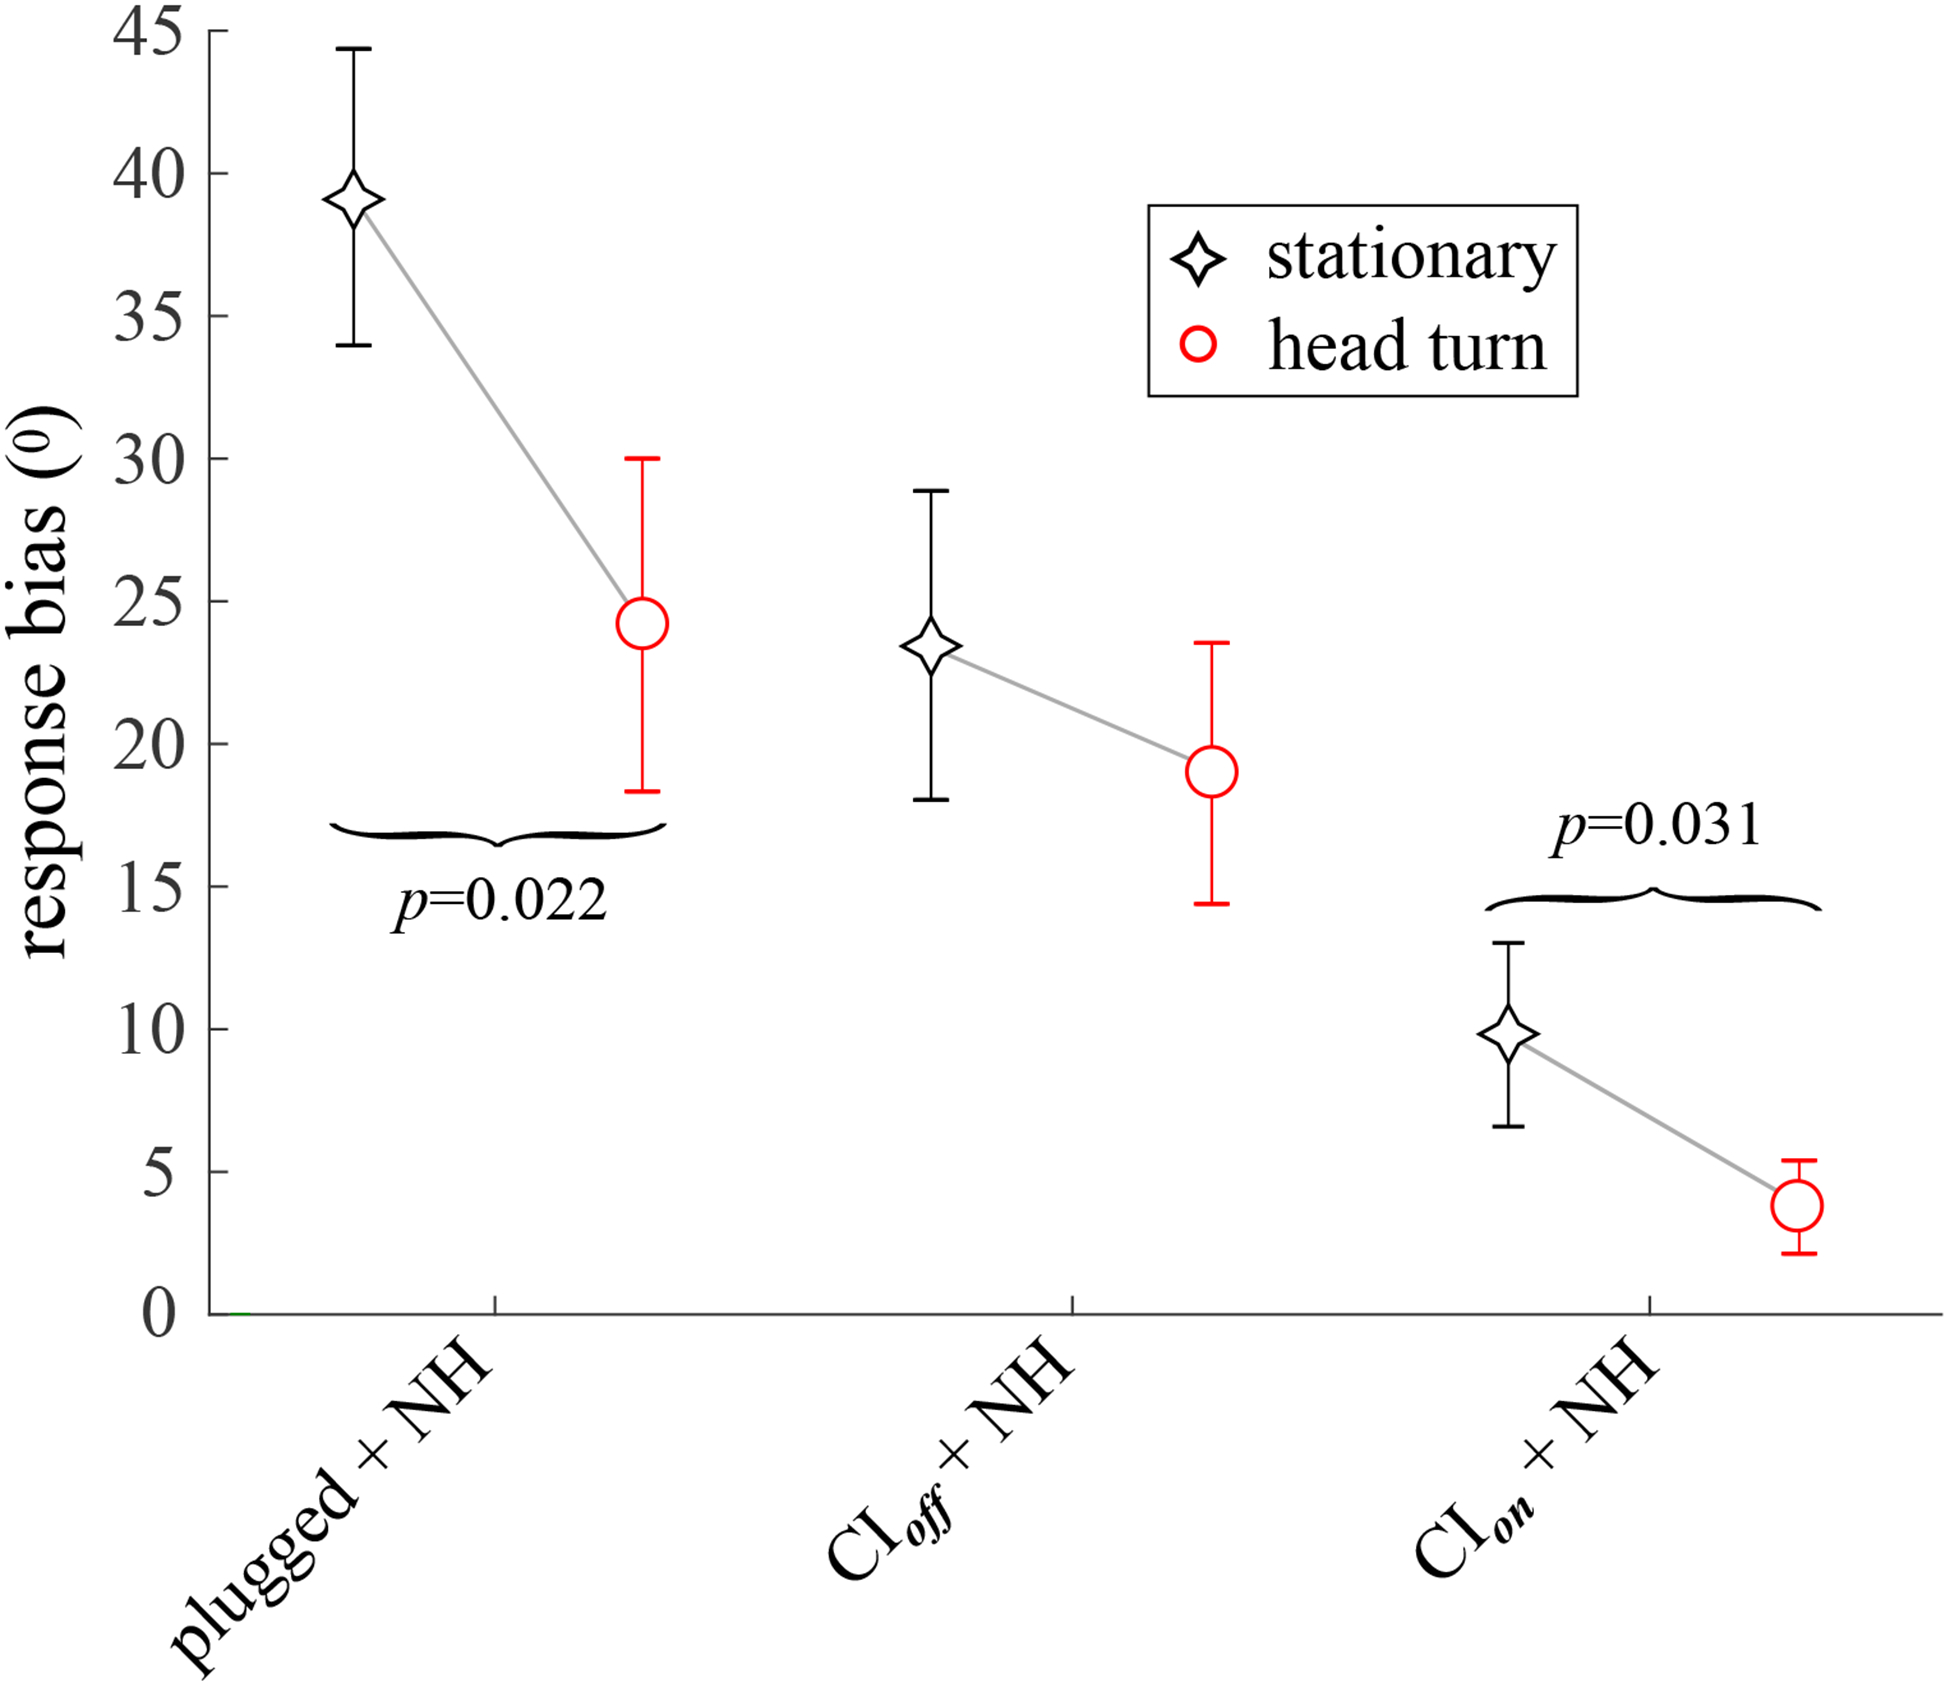
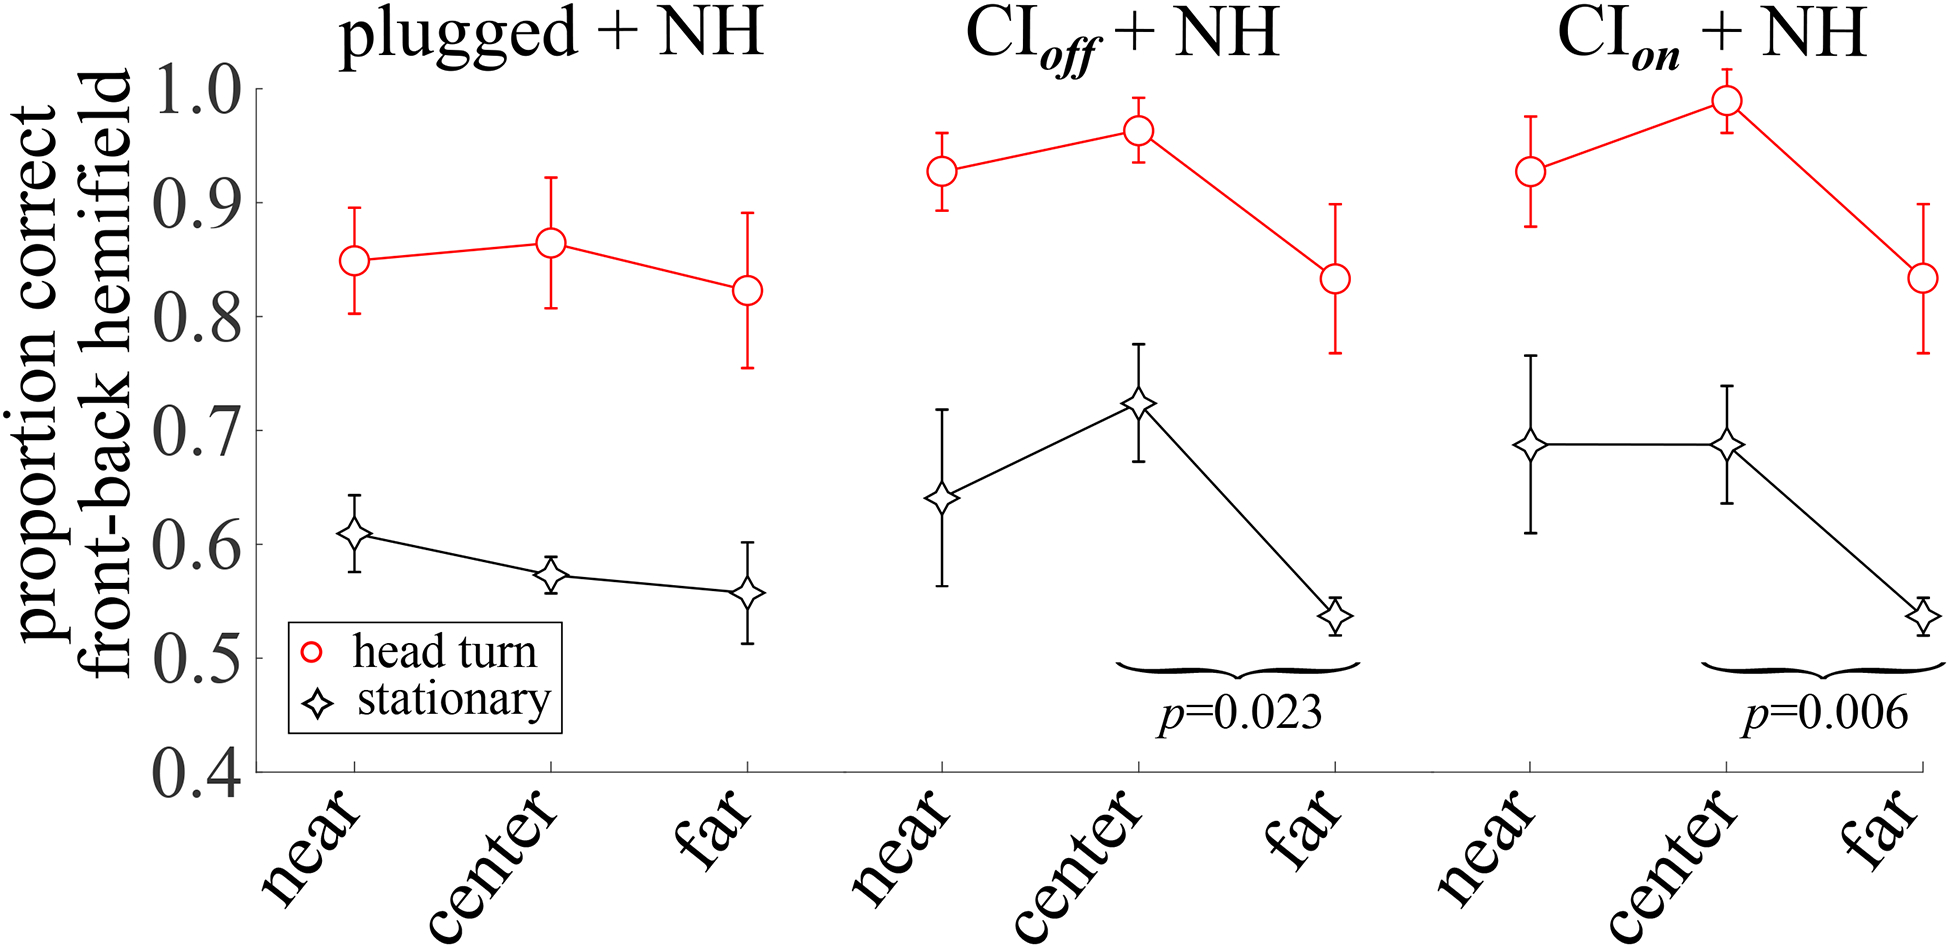
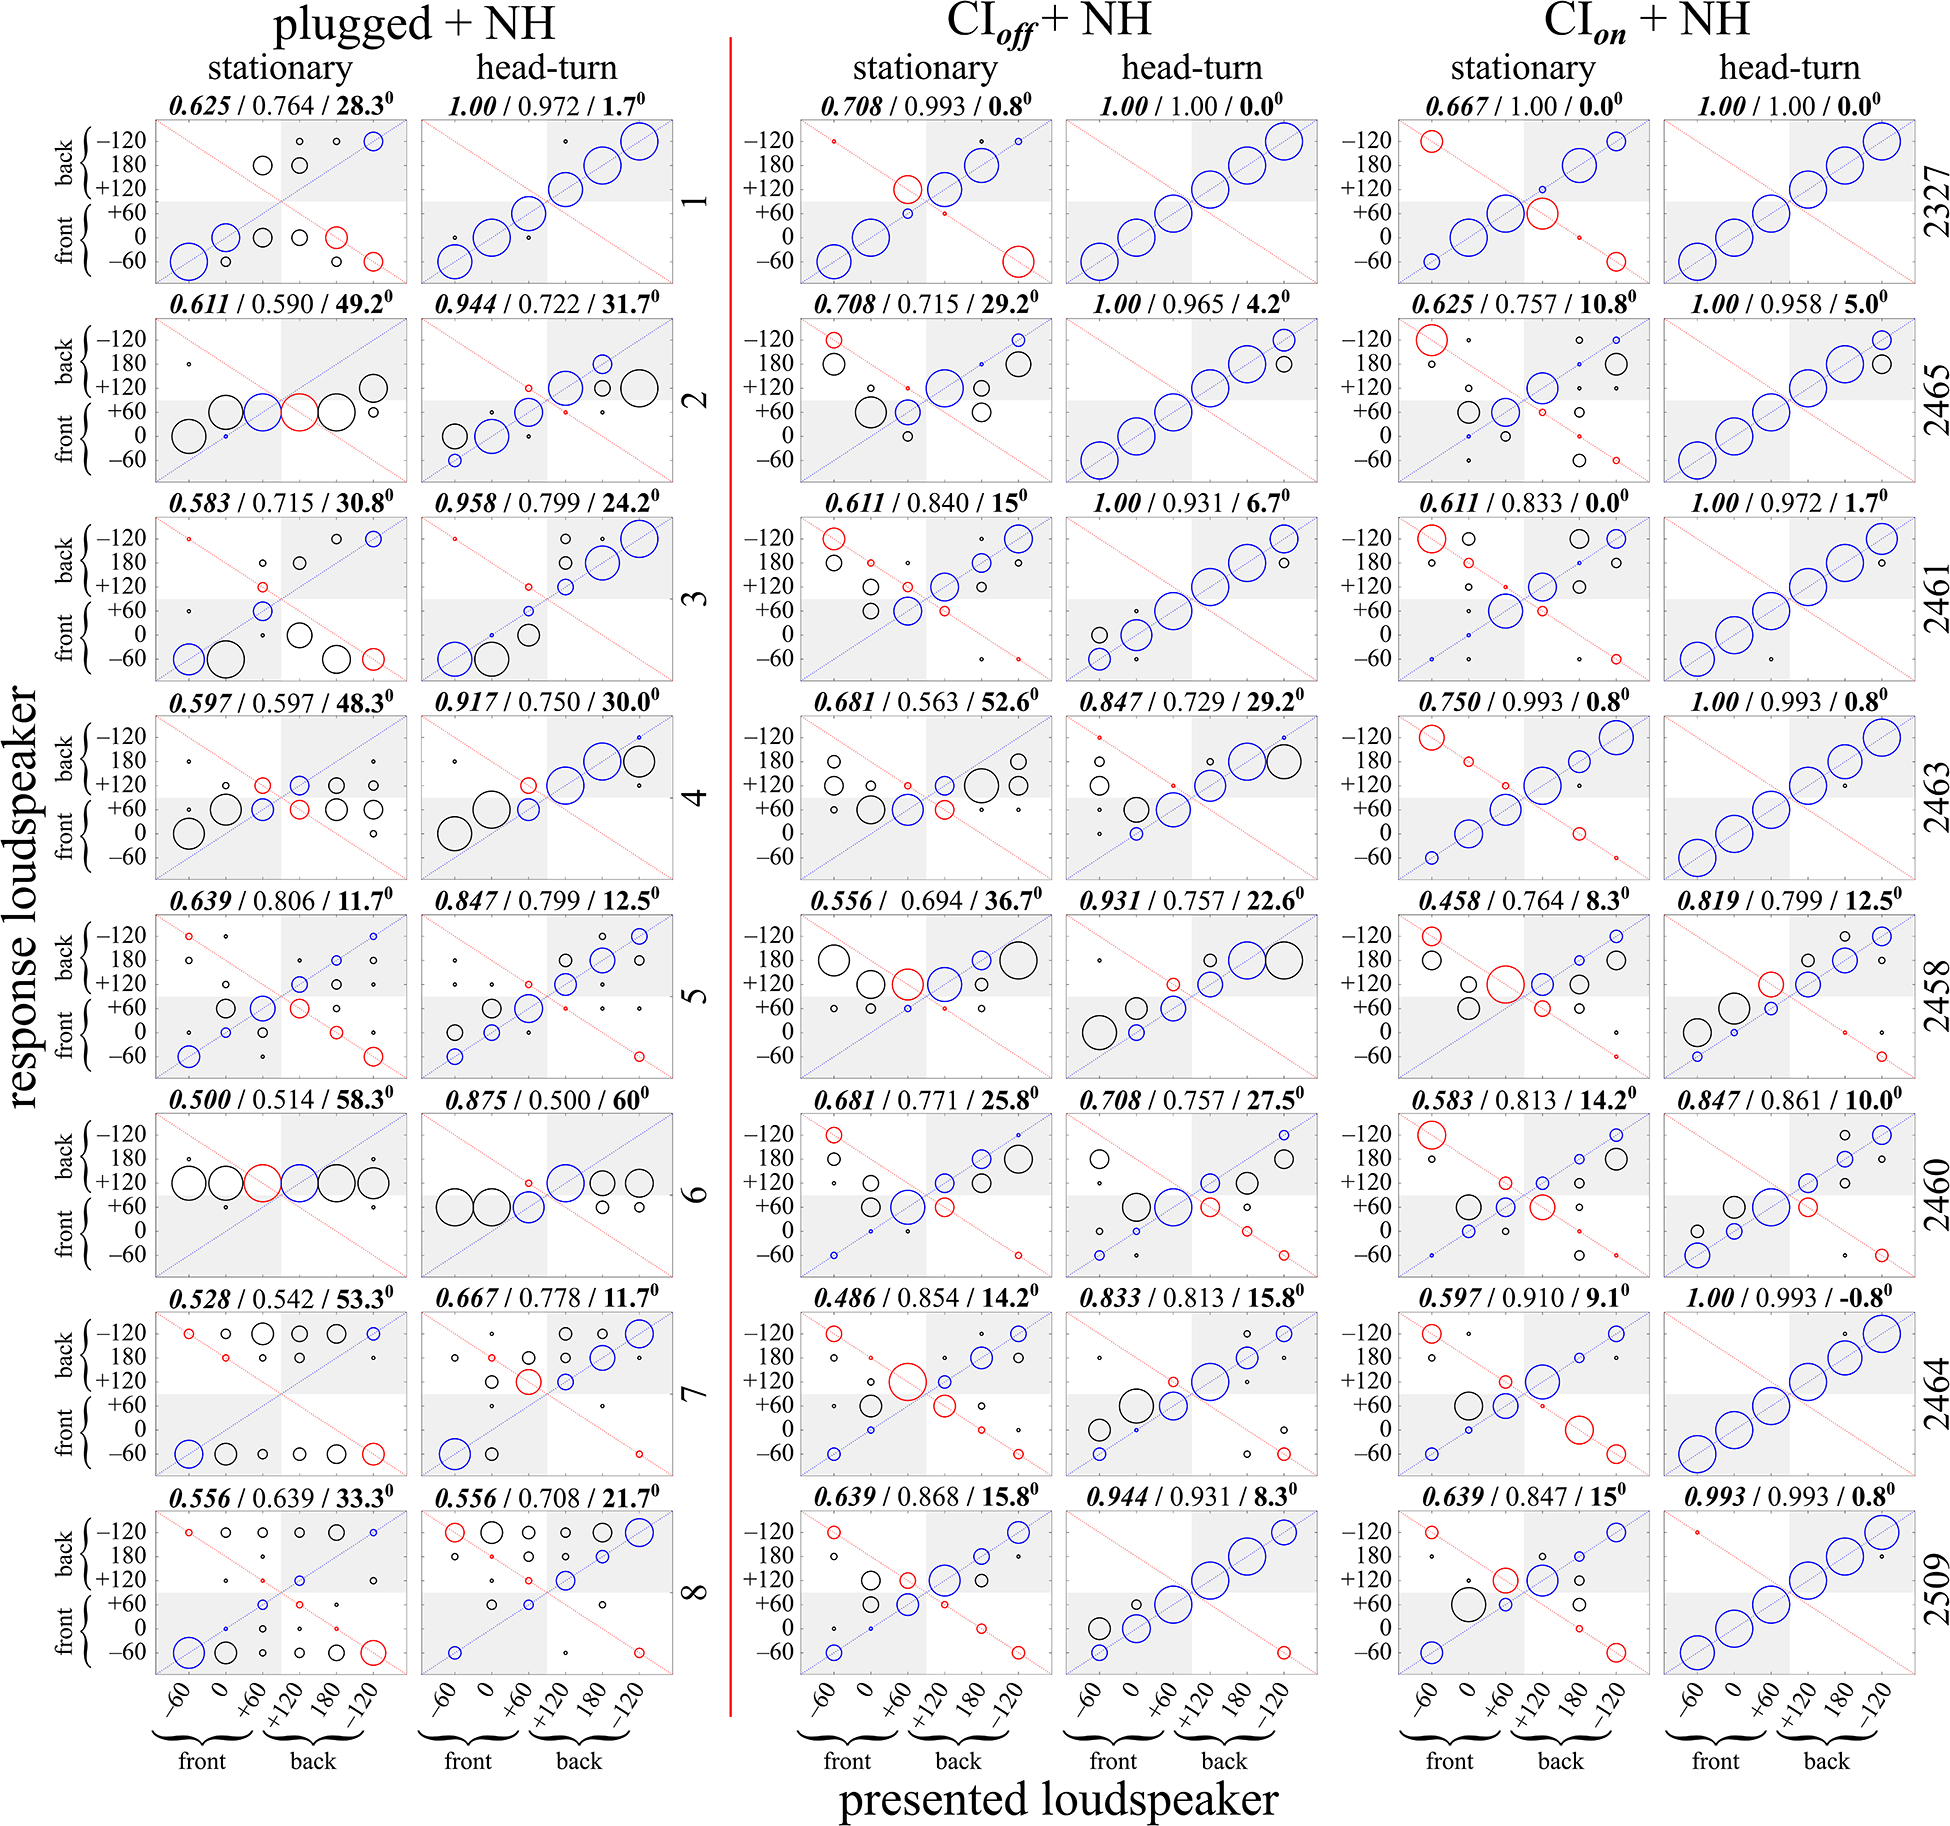
Results: (1) Under stationary listener conditions, unilaterally-plugged NH listeners and SSD-CI listeners (with their CIs both on and off) were nearly at chance in determining the front-back location of high-frequency sound sources. (2) Allowing rotational head movements improved performance in both the front-back and left-right dimensions for all listeners. (3) For SSD-CI patients with their CI turned off, head rotations substantially reduced front-back reversals, and the combination of turning on the CI with head rotations led to near-perfect resolution of front-back sound source location. (4) Turning on the CI also improved left-right localization performance. (5) As expected, NH listeners with both ears unplugged localized to the correct front-back and left-right hemifields both with and without head movements.

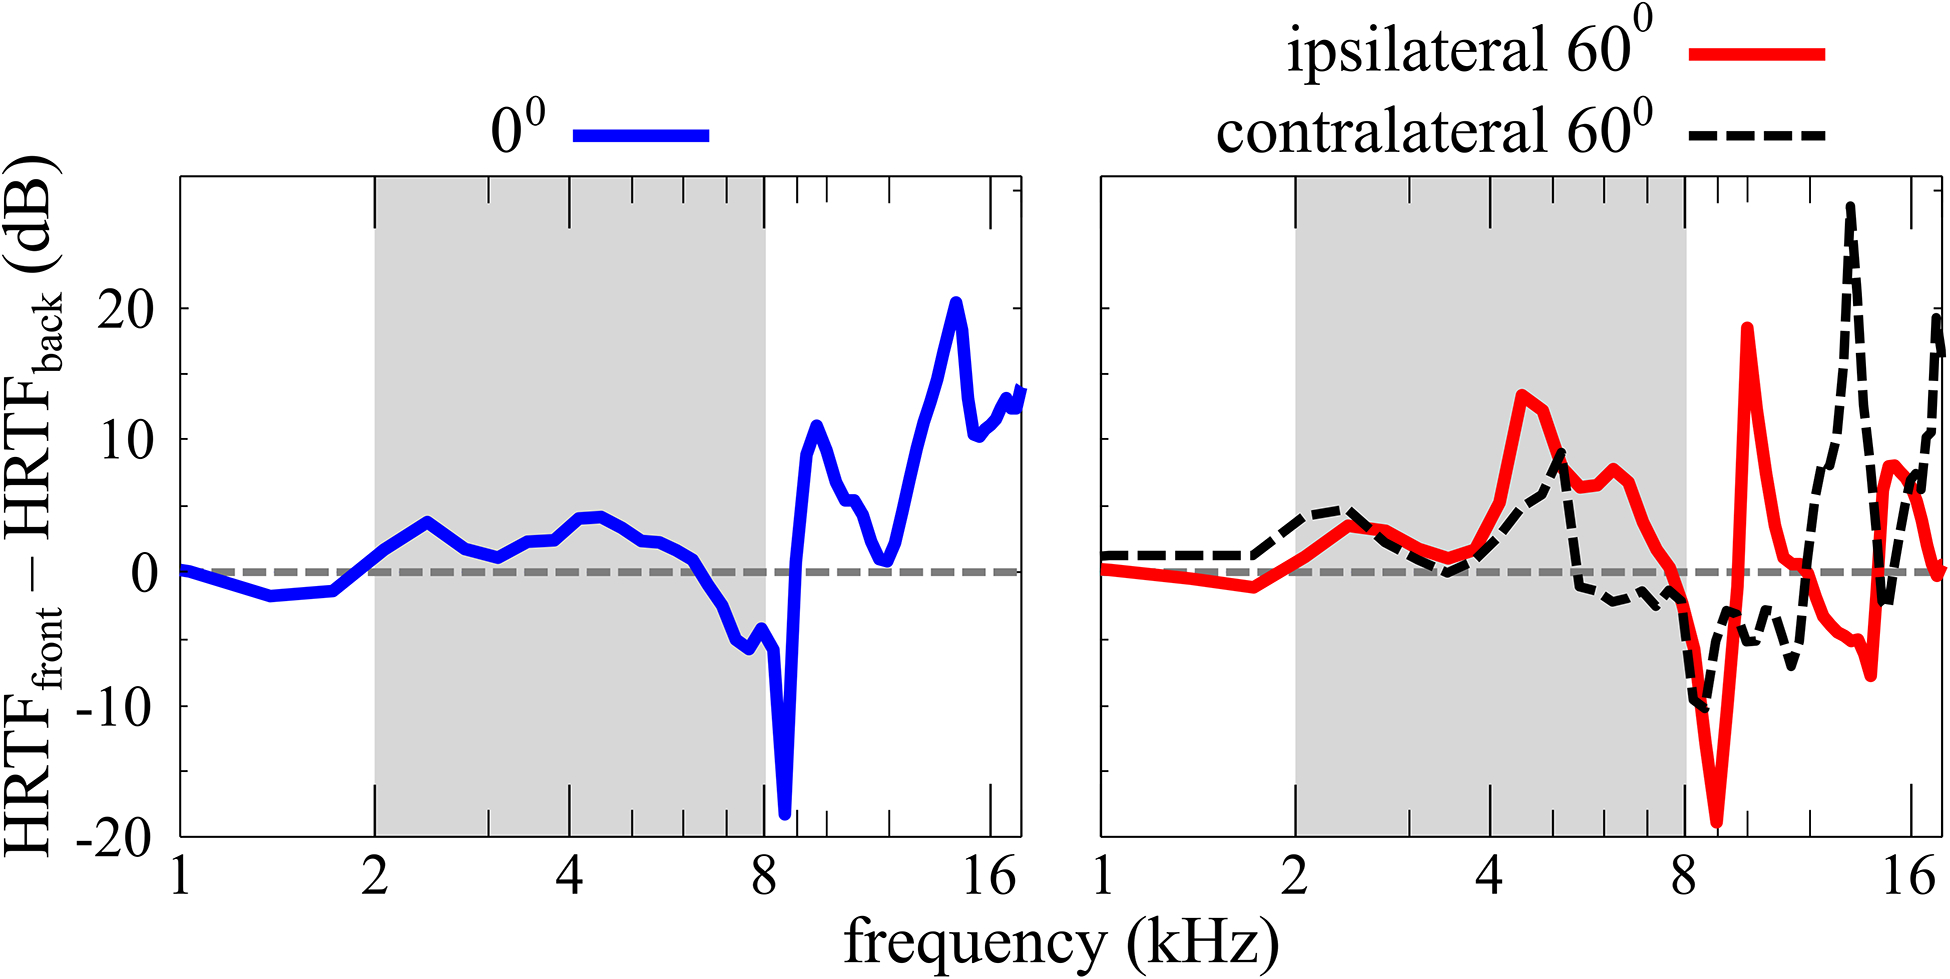
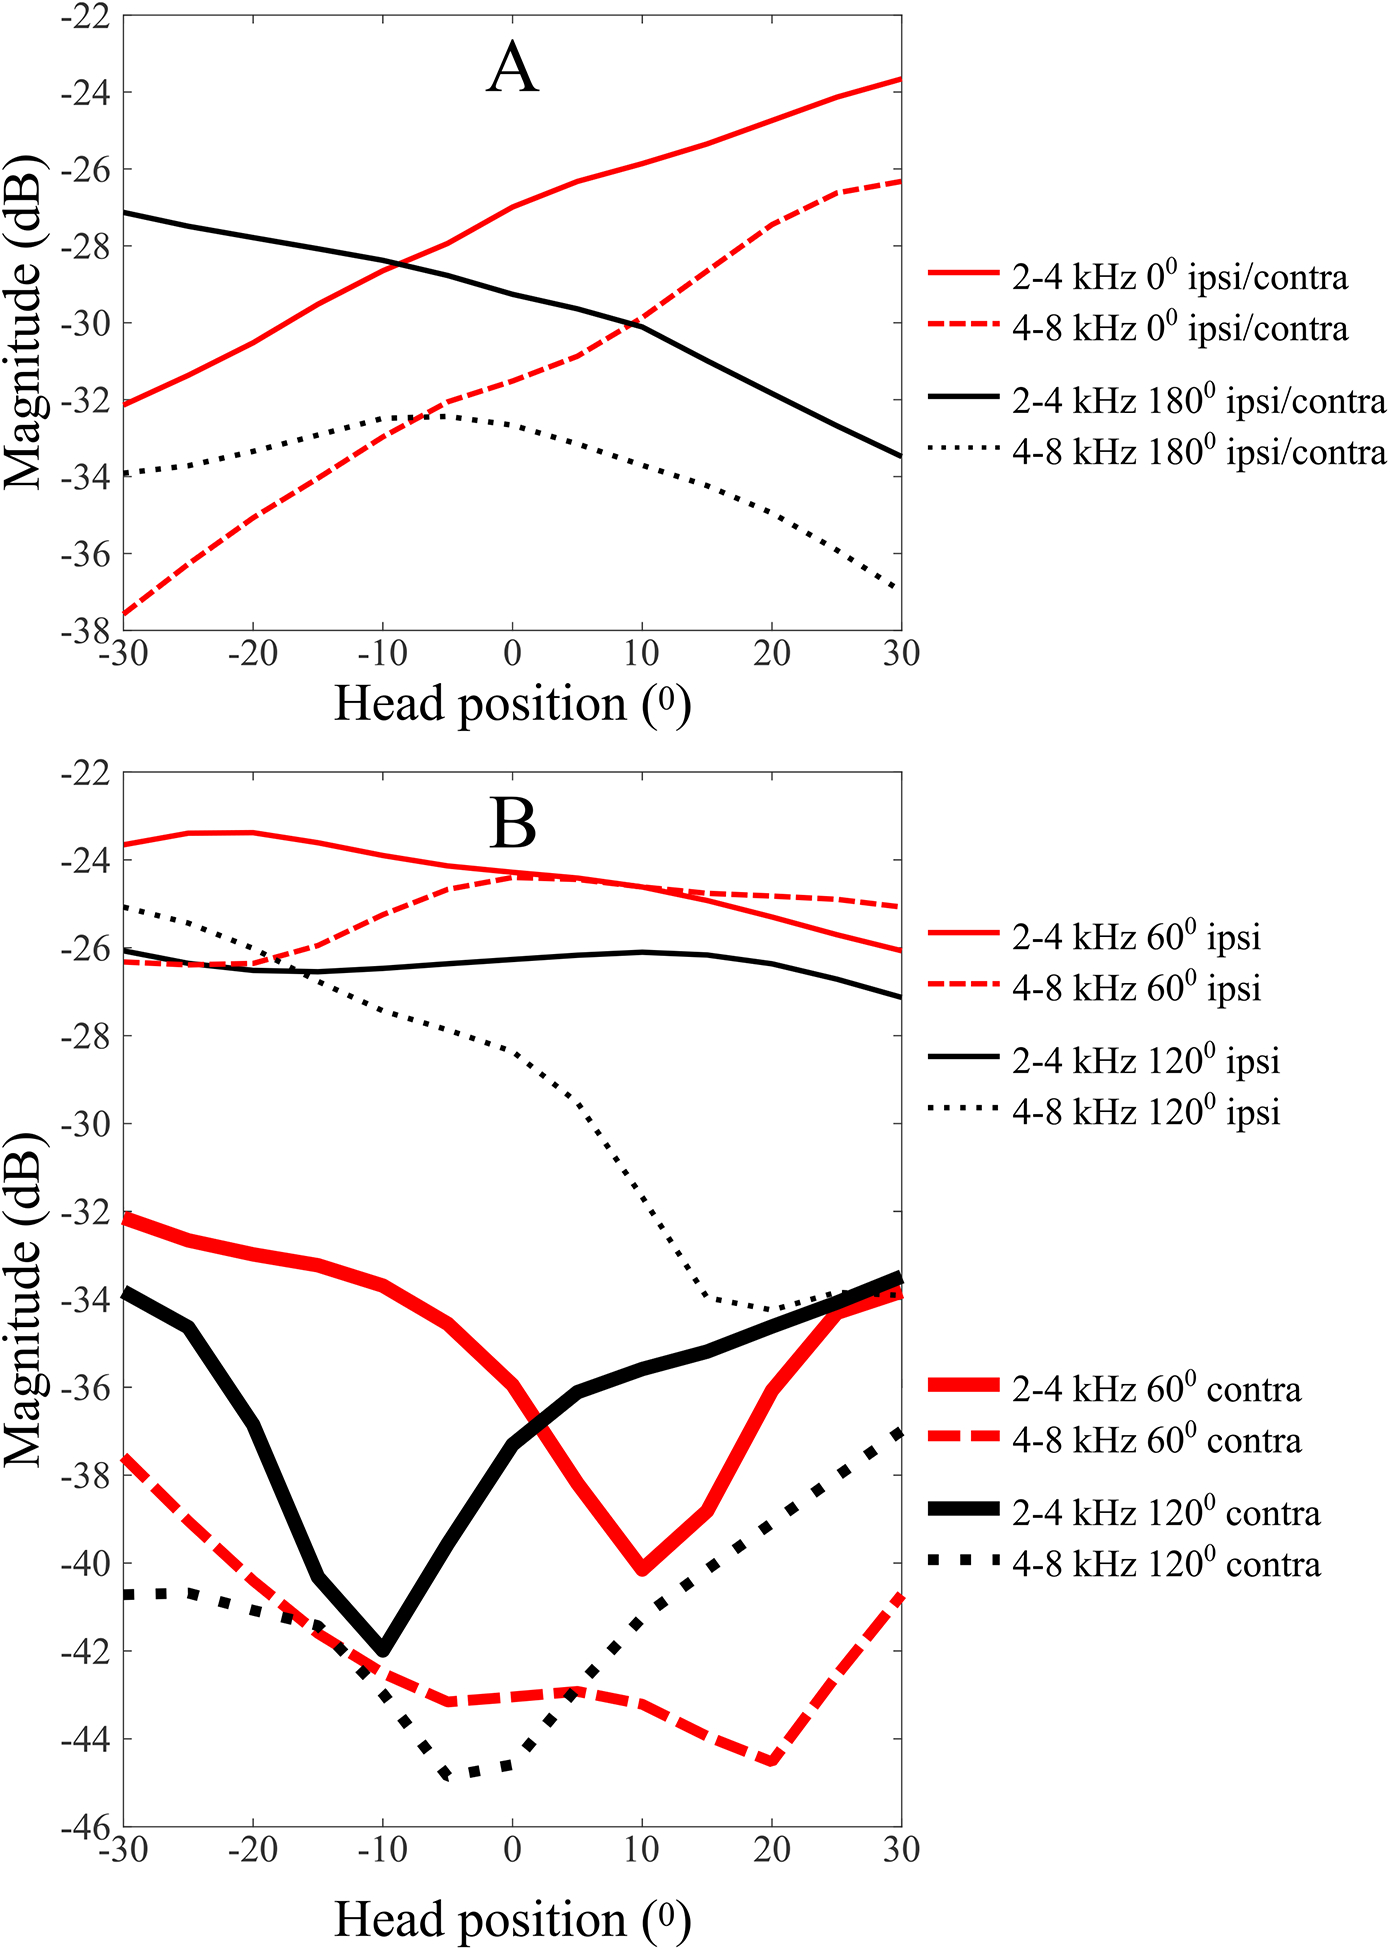
Conclusions: Although SSD-CI listeners demonstrate a relatively poor ability to distinguish the front-back location of sound sources when their head is stationary, their performance is substantially improved with head movements. Most of this improvement occurs when the CI is off, suggesting that the NH ear does most of the "work" in this regard, though some additional gain is introduced with turning the CI on. During head turns, these listeners appear to primarily rely on comparing changes in head position to changes in monaural level cues produced by the direction-dependent attenuation of high-frequency sounds that result from acoustic head shadowing. In this way, SSD-CI listeners overcome limitations to the reliability of monaural spectral and level cues under stationary conditions. SSD-CI listeners may have learned, through chronic monaural experience before CI implantation, or with the relatively impoverished spatial cues provided by their CI-implanted ear, to exploit the monaural level cue. Unilaterally-plugged NH listeners were also able to use this cue during the experiment to realize approximately the same magnitude of benefit from head turns just minutes after plugging, though their performance was less accurate than that of the SSD-CI listeners, both with and without their CI turned on.


Figures

Fig. 1
Fig. 1
The frequency magnitude difference between front and back KEMAR HRTFs measured by Gardner and Martin (2005) for sound source angles of 0° and 60°, relative to the listener, at the ears ipsilateral and contralateral to the sound source. At 0° the HRTF, and therefore the difference between front and back HRTFs, is the same at both ears. For NH listeners with asymmetric pinnae, this may not be exactly the case. The frequency range of the stimuli presented in this study is highlighted in gray in each figure panel.
Fig. 2
Fig. 2
Group data, pooled across listeners. See Fig. 7 for individual data. The horizontal axis shows the loudspeaker positions (in degrees) from which stimuli were presented, and the vertical axis shows the loudspeaker positions (also in degrees) listeners identified in response to the stimulus presentations. The radius of each circle is proportional to the number of responses at that location. Correct responses, indicated with blue circles, are along the positive diagonal. Front-back reversed responses, indicated with red circles, are along the negative diagonal. All other errors are represented with black circles. Responses to the correct front-back hemifield are located in the shaded areas of each figure panel. The left column shows data for the stationary head condition and the right column shows data for when listeners turned their heads. The top 2 rows show data for NH listeners with either both ears unblocked (NH + NH) or with one ear acutely plugged (plugged + NH). Note that the 2 groups of NH listeners are not the same, and that seven of the eight NH + NH bilateral listeners’ data were previously included in Pastore (2018). The bottom 2 rows show data for SSD-CI listeners with cochlear implants either on (CI(on) + NH) or off (CI(off) + NH). Above each figure panel, from left-to-right, are the proportion of responses in the correct front-back hemifield (bold italic font), the proportion of responses in the correct left-right hemifield (normal font), and the mean bias toward the NH ear in degrees (bold font). All figures are plotted so the unoccluded NH ear is on the right side (positive degrees) and the occluded ear or implanted ear is on the left (negative degrees). See Methods section for further details.
Fig. 3
Fig. 3
Individual and group data showing the proportion of responses that were in the correct front-back hemifield, collapsed across all presenting loudspeaker locations. Circles show data for the condition where listeners rotate their head. Diamond-like symbols show data for the condition where listeners keep their head stationary. Note that all individual listeners either improved or remained the same when allowed to move their head. Filled symbols, next to the individual data, show the group mean ± 1 standard error of the mean.
Fig. 4
Fig. 4
The mean lateral response bias, calculated across listeners. Positive bias indicates a lateral shift of responses toward the NH ear and away from the plugged or implanted ear. Error bars indicate ±1 standard error of the mean.
Fig. 5
Fig. 5
The mean, across listeners, of the proportion of responses in the correct front-back hemifield as a function of whether the sound stimulus was presented from a loudspeaker at 60° on the same side as the normal hearing ear (near), was presented from 0° at the center (center), or from a loudspeaker at 60° on the side opposite the normal hearing ear (far). Error bars indicate ±1 standard error of the mean.
Fig. 6
Fig. 6
Simulated dynamic monaural level (ML) cues generated by listener head movements relative to the midline, for sound sources at 0° and 180° (top figure panel) and 60° and 120° (bottom figure panel) using measured Kemar impulse responses (Gardner and Martin, 2005). A fourth-order digital Butterworth filter was used to bandpass filter the head-related impulse-responses. 20log10 of the RMS amplitude of the resulting bandpass-filtered impulse responses was calculated and shown for 2–4 kHz (solid lines) and 4–8 kHz (dotted lines). Note that, for sound sources presented from the midline, either ear is ipsilateral to the sound source for half the head turn and contralateral for the other half of the head turn. Therefore, while the top panel shows magnitude for the left ear, magnitude at the right ear would just be the same curve flipped symmetrically about the midline. To simplify the figure, only magnitude at the left ear is shown in the top panel.
Fig. 7
Fig. 7
Individual listeners’ sound source localization, measured as loudspeaker identification. Stimuli were 3-s duration Gaussian noises filtered to between 2–8 kHz. Data to the left of the vertical line are for normal hearing (NH) with one plugged ear (see details in Methods). Data to the right of the vertical line are for single-sided deaf listeners implanted in the deaf ear. See Tables I and II for further details. Correct responses are along the positive diagonal and are indicated with blue circles. Front-back reversed responses are along the negative diagonal and are indicated with red circles. All other errors are represented with black circles. Responses to the correct front-back hemifield are located in the shaded areas of each figure panel. The radius of each circle is proportional to the number of responses at that location. Above each figure panel, from left-to-right, are the proportion of responses in the correct front-back hemifield (bold italic font), the proportion of responses in the correct left-right hemifield (normal font), and the mean bias toward the NH ear in degrees (bold font). All figures are plotted so the unoccluded NH ear is on the right side (positive degrees) and the occluded ear or implanted ear is on the left (negative degrees). Therefore, the data of CI Listeners 2327 and 2509 and NH monaurally-plugged listeners 1, 3, 7, and 8 are flipped left-to-right. The listener number is indicated to the right of each listener’s row of data. The individual data for the NH bilateral condition are not shown as there is essentially no variability in those data (i.e., all listeners were correct for almost all responses across all stimulus conditions, as shown in Fig.2 above).

Similar articles

Cited by

References

    1. Agterberg MJ, Hol MK, Van Wanrooij M, Van Opstal AJ, and Snik AF (2014). “Single-sided deafness and directional hearing: contribution of spectral cues and high-frequency hearing loss in the hearing ear,” Front Neurosci 8, 188, https://www.ncbi.nlm.nih.gov/pubmed/25071433, doi: 10.3389/fnins.2014.00188. - DOI - PMC - PubMed
    1. Archer-boyd AW, and Carlyon RP (2019). “Simulations of the effect of unlinked cochlear-implant automatic gain control and head movement on interaural level differences,” J Acoust Soc Am 145(3), 1389–1400, doi: 10.1121/1.5093623. - DOI - PMC - PubMed
    1. Bauer RW, Matuza JL, and Blackmer RF (1966). “Noise localization after unilateral attenuation,” J Acoust Soc Am 40(2), 441–444.
    1. Bronkhorst AW (2015). “The cocktail-party problem revisited: early processing and selection of multi-talker speech,” Atten Percept Psychophys http://link.springer.com/10.3758/s13414-015-0882-9, doi: 10.3758/s13414-015-0882-9. - DOI - DOI - PMC - PubMed
    1. Buss E, Dillon MT, Rooth MA, King ER, Deres EJ, Buchman CA, Pillsbury HC, and Brown KD (2018). “Effect of Cochlear Implantation on Quality of Life in Adults with Unilateral Hearing Loss,” Trends in Hearing 22, 1–15, doi: 10.1159/000484079. - DOI - PMC - PubMed

Publication types