. 2020 Nov 2;18(11):e3000862.
doi: 10.1371/journal.pbio.3000862. eCollection 2020 Nov.

Many, but not all, lineage-specific genes can be explained by homology detection failure

Affiliations

Many, but not all, lineage-specific genes can be explained by homology detection failure

Caroline M Weisman et al. PLoS Biol. .

Abstract

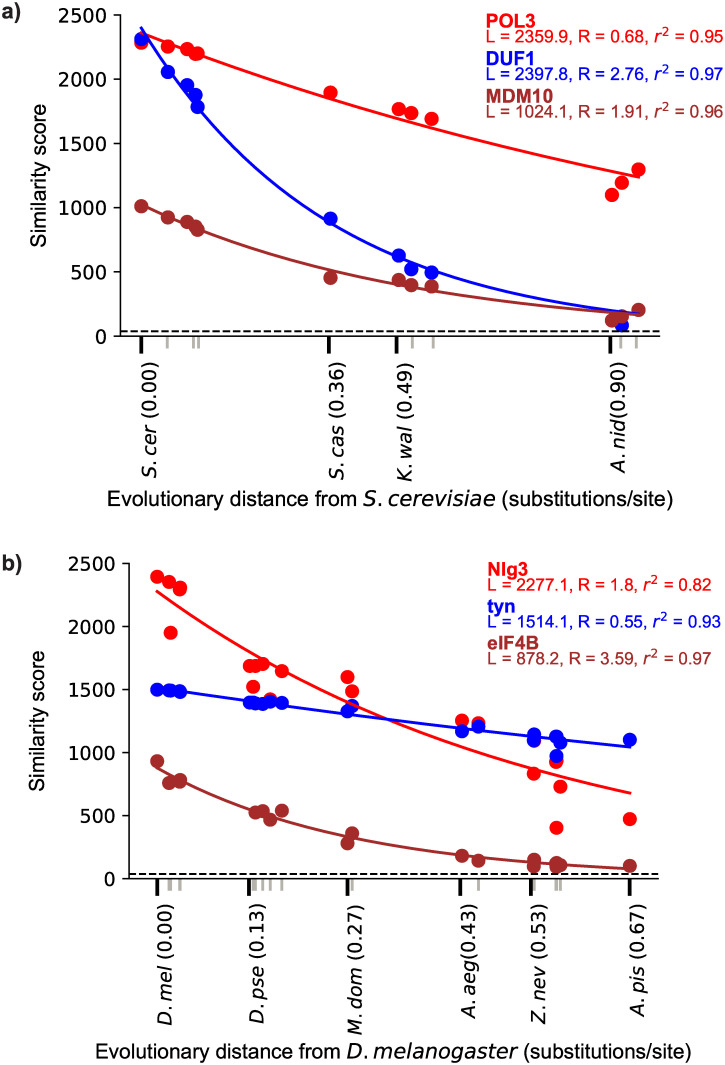
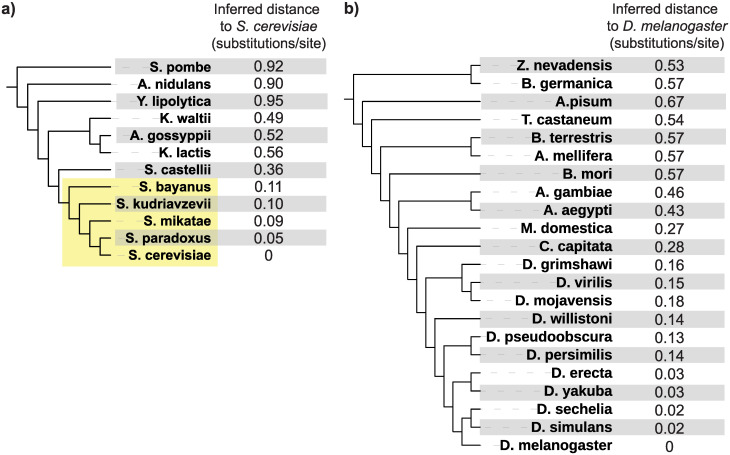
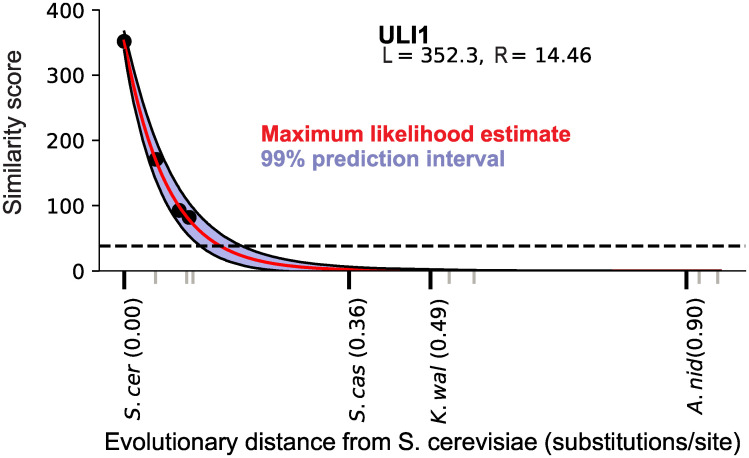
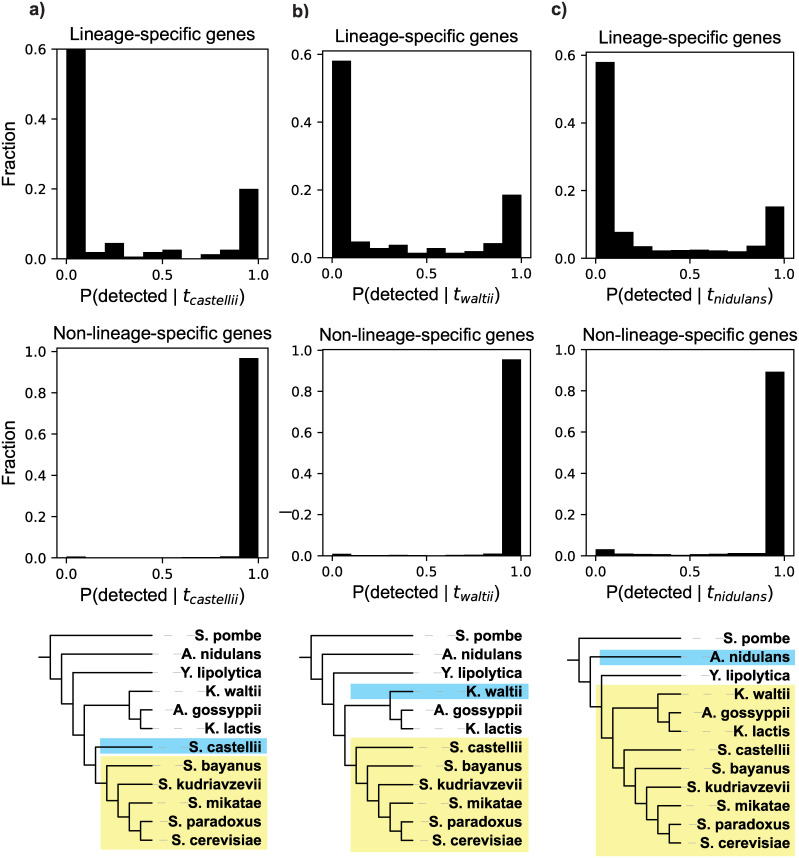
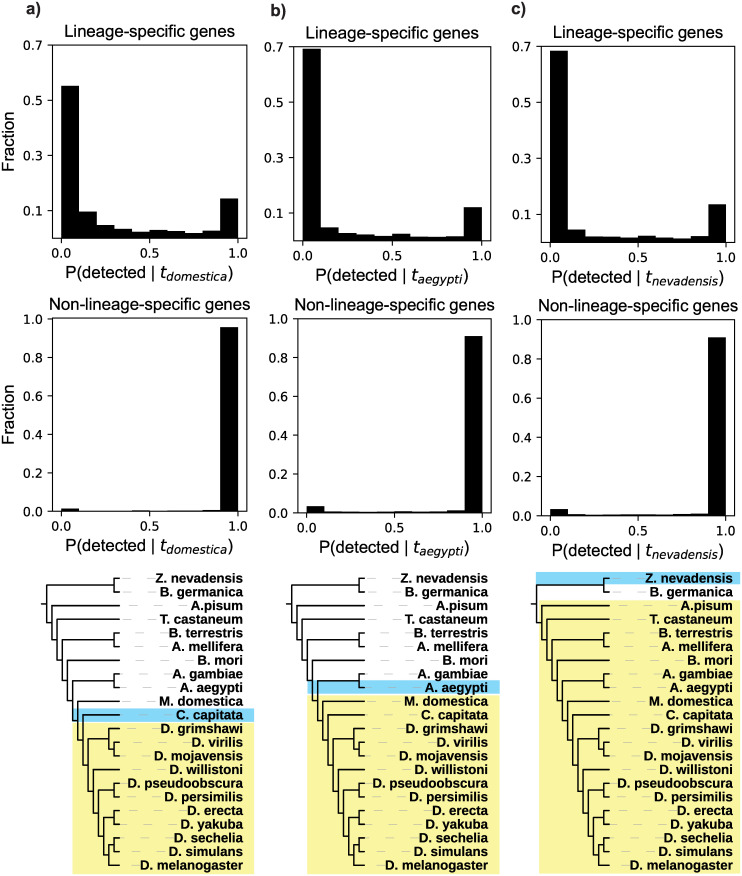
Genes for which homologs can be detected only in a limited group of evolutionarily related species, called "lineage-specific genes," are pervasive: Essentially every lineage has them, and they often comprise a sizable fraction of the group's total genes. Lineage-specific genes are often interpreted as "novel" genes, representing genetic novelty born anew within that lineage. Here, we develop a simple method to test an alternative null hypothesis: that lineage-specific genes do have homologs outside of the lineage that, even while evolving at a constant rate in a novelty-free manner, have merely become undetectable by search algorithms used to infer homology. We show that this null hypothesis is sufficient to explain the lack of detected homologs of a large number of lineage-specific genes in fungi and insects. However, we also find that a minority of lineage-specific genes in both clades are not well explained by this novelty-free model. The method provides a simple way of identifying which lineage-specific genes call for special explanations beyond homology detection failure, highlighting them as interesting candidates for further study.


Conflict of interest statement

The authors declare that no competing interests exist.

Figures

Fig 1
Fig 1. Depictions of the fit of the null model of similarity score, as defined in the text, decline with evolutionary distance for 3 representative proteins from Saccharomyces cerevisiae (a) and Drosophila melanogaster (b).
Colored points represent the BLASTP score between the protein and its ortholog in the species that is at the evolutionary distance indicated on the x-axis. Tick marks on the x-axis represent each of the species used here. For visual clarity, only some species names and evolutionary distances are included, indicated with black tick marks; gray tick marks represent the other unlabeled species. The dashed line represents the detectability threshold, the score below which an ortholog would be undetected at our chosen E-value of 0.001. The best-fit values of a and b are shown for each protein. The r2 value is also shown and was calculated from a linear regression of the log of the similarity score versus evolutionary distance. All data in these figures are available at https://github.com/caraweisman/abSENSE, under Fungi_Data (panel a) and Insect_Data (panel b).
Fig 2
Fig 2. Inferred evolutionary distances between each fungal species and S. cerevisiae (a) and each insect species and D. melanogaster (b).
The tree topologies for these taxa are based on previously published studies [34, 35] and were not calculated here; branch lengths are not to scale. The fungal sensu stricto lineage, referenced frequently in the text, is shaded in yellow.
Fig 3
Fig 3. Illustration of the prediction of detectability decline for the S. cerevisiae protein Uli1, displayed as in Fig 1.
At the evolutionary distance of the nearest outgroup S. castellii, the entire prediction interval lies below the detectability threshold, indicating an approximately 0% probability that an ortholog would be detected under the null model even if an S. castellii ortholog were present. Data in this figure are available at https://github.com/caraweisman/abSENSE/tree/master/Fungi_Data.
Fig 4
Fig 4. Distributions of detectability prediction results for 3 yeast lineages (a, b, c).
Top: results for all lineage-specific genes. Middle: results of the same analysis for all non-lineage-specific genes, which serve as a positive control. These genes, which have detectable orthologs outside of the lineage, should be predicted to be detected, which they largely are. Bottom: depiction of the lineage (yellow) and closest outgroup (blue) considered in the analyses in the corresponding column. In c), note that Yarrowia lipolytica is the topological outgroup to the shaded lineage but is not the closest species by evolutionary distance (branch lengths are not to scale). Data in this figure are available at https://github.com/caraweisman/abSENSE/tree/master/Fungi_Data.
Fig 5
Fig 5. Distributions of detectability prediction results for 3 insect lineages (a, b, c).
Top: results for all lineage-specific genes. Middle: results of the same analysis for all non-lineage-specific genes, which serve as a positive control. These genes, which have detectable orthologs outside of the lineage, should be predicted to be detected, which they largely are. Bottom: Depiction of the lineage (yellow) and closest outgroup (blue) considered in the analyses in the corresponding column. In a), note that Ceratitis capitata is the topological outgroup to the shaded lineage, but is not the closest species by evolutionary distance (branch lengths are not to scale). Data in this figure are available at https://github.com/caraweisman/abSENSE/tree/master/Insect_Data.
Fig 6
Fig 6. Detectability prediction results for the S. cerevisiae protein Spo13, displayed as described in Fig 3.
At the evolutionary distance of the nearest outgroup S. castellii, the entire prediction interval lies well above the detectability threshold, indicating an approximately 100% probability that an ortholog should be detected in this species under the null model. Data in this figure are available at https://github.com/caraweisman/abSENSE/tree/master/Fungi_Data.

References

    1. Cai JJ, Woo PC, Lau SK, Smith DK, Yuen K-Y. Accelerated evolutionary rate may be responsible for the emergence of lineage-specific genes in ascomycota. Journal of Molecular Evolution. 2006;63:1–11. 10.1007/s00239-004-0372-5 - DOI - PubMed
    1. Wilson G, Bertrand N, Patel Y, Hughes J, Feil E, Field D. Orphans as taxonomically restricted and ecologically important genes. Microbiology. 2005;151:2499–501. 10.1099/mic.0.28146-0 - DOI - PubMed
    1. Khalturin K, Hemmrich G, Fraune S, Augustin R, Bosch TC. More than just orphans: are taxonomically-restricted genes important in evolution? Trends in Genetics. 2009;25:404–13. 10.1016/j.tig.2009.07.006 - DOI - PubMed
    1. Dujon B. The yeast genome project: what did we learn? Trends in Genetics. 1996;12:263–70. 10.1016/0168-9525(96)10027-5 - DOI - PubMed
    1. Domazet-Loso T, Tautz D. An evolutionary analysis of orphan genes in Drosophila. Genome Research. 2003;13:2213–9. 10.1101/gr.1311003 - DOI - PMC - PubMed

Publication types