A spectrum of verticality across genes
- PMID: 33137105
- PMCID: PMC7660906
- DOI: 10.1371/journal.pgen.1009200
A spectrum of verticality across genes
Abstract
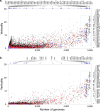
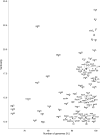
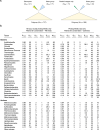
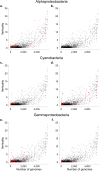
Lateral gene transfer (LGT) has impacted prokaryotic genome evolution, yet the extent to which LGT compromises vertical evolution across individual genes and individual phyla is unknown, as are the factors that govern LGT frequency across genes. Estimating LGT frequency from tree comparisons is problematic when thousands of genomes are compared, because LGT becomes difficult to distinguish from phylogenetic artefacts. Here we report quantitative estimates for verticality across all genes and genomes, leveraging a well-known property of phylogenetic inference: phylogeny works best at the tips of trees. From terminal (tip) phylum level relationships, we calculate the verticality for 19,050,992 genes from 101,422 clusters in 5,655 prokaryotic genomes and rank them by their verticality. Among functional classes, translation, followed by nucleotide and cofactor biosynthesis, and DNA replication and repair are the most vertical. The most vertically evolving lineages are those rich in ecological specialists such as Acidithiobacilli, Chlamydiae, Chlorobi and Methanococcales. Lineages most affected by LGT are the α-, β-, γ-, and δ- classes of Proteobacteria and the Firmicutes. The 2,587 eukaryotic clusters in our sample having prokaryotic homologues fail to reject eukaryotic monophyly using the likelihood ratio test. The low verticality of α-proteobacterial and cyanobacterial genomes requires only three partners-an archaeal host, a mitochondrial symbiont, and a plastid ancestor-each with mosaic chromosomes, to directly account for the prokaryotic origin of eukaryotic genes. In terms of phylogeny, the 100 most vertically evolving prokaryotic genes are neither representative nor predictive for the remaining 97% of an average genome. In search of factors that govern LGT frequency, we find a simple but natural principle: Verticality correlates strongly with gene distribution density, LGT being least likely for intruding genes that must replace a preexisting homologue in recipient chromosomes. LGT is most likely for novel genetic material, intruding genes that encounter no competing copy.
Conflict of interest statement
The authors have declared that no competing interests exist.
Figures


Similar articles
-
Networks of gene sharing among 329 proteobacterial genomes reveal differences in lateral gene transfer frequency at different phylogenetic depths.Mol Biol Evol. 2011 Feb;28(2):1057-74. doi: 10.1093/molbev/msq297. Epub 2010 Nov 8. Mol Biol Evol. 2011. PMID: 21059789 Free PMC article.
-
Concatenated alignments and the case of the disappearing tree.BMC Evol Biol. 2014 Dec 30;14:266. doi: 10.1186/s12862-014-0266-0. BMC Evol Biol. 2014. PMID: 25547755 Free PMC article.
-
An evolutionary network of genes present in the eukaryote common ancestor polls genomes on eukaryotic and mitochondrial origin.Genome Biol Evol. 2012;4(4):466-85. doi: 10.1093/gbe/evs018. Epub 2012 Feb 21. Genome Biol Evol. 2012. PMID: 22355196 Free PMC article.
-
Protein based molecular markers provide reliable means to understand prokaryotic phylogeny and support Darwinian mode of evolution.Front Cell Infect Microbiol. 2012 Jul 26;2:98. doi: 10.3389/fcimb.2012.00098. eCollection 2012. Front Cell Infect Microbiol. 2012. PMID: 22919687 Free PMC article. Review.
-
Lateral gene transfer and the origins of prokaryotic groups.Annu Rev Genet. 2003;37:283-328. doi: 10.1146/annurev.genet.37.050503.084247. Annu Rev Genet. 2003. PMID: 14616063 Review.
Cited by
-
Evidence for a Syncytial Origin of Eukaryotes from Ancestral State Reconstruction.Genome Biol Evol. 2021 Jul 6;13(7):evab096. doi: 10.1093/gbe/evab096. Genome Biol Evol. 2021. PMID: 33963405 Free PMC article.
-
Reply to: Phylogenetic affiliation of mitochondria with Alpha-II and Rickettsiales is an artefact.Nat Ecol Evol. 2022 Dec;6(12):1832-1835. doi: 10.1038/s41559-022-01896-8. Epub 2022 Oct 24. Nat Ecol Evol. 2022. PMID: 36280779 No abstract available.
-
Realistic Gene Transfer to Gene Duplication Ratios Identify Different Roots in the Bacterial Phylogeny Using a Tree Reconciliation Method.Life (Basel). 2022 Jul 4;12(7):995. doi: 10.3390/life12070995. Life (Basel). 2022. PMID: 35888084 Free PMC article.
-
Old genes in new places: A taxon-rich analysis of interdomain lateral gene transfer events.PLoS Genet. 2022 Jun 22;18(6):e1010239. doi: 10.1371/journal.pgen.1010239. eCollection 2022 Jun. PLoS Genet. 2022. PMID: 35731825 Free PMC article.
-
Distinct horizontal gene transfer potential of extracellular vesicles versus viral-like particles in marine habitats.Nat Commun. 2025 Mar 3;16(1):2126. doi: 10.1038/s41467-025-57276-w. Nat Commun. 2025. PMID: 40032822 Free PMC article.
References
Publication types
MeSH terms
LinkOut - more resources
Full Text Sources

