

Disruption of metabolic, sleep, and sensorimotor functional outcomes in a female transgenic mouse model of Alzheimer's disease
- PMID: 33137399
- PMCID: PMC7719580
- DOI: 10.1016/j.bbr.2020.112983
Disruption of metabolic, sleep, and sensorimotor functional outcomes in a female transgenic mouse model of Alzheimer's disease
Abstract
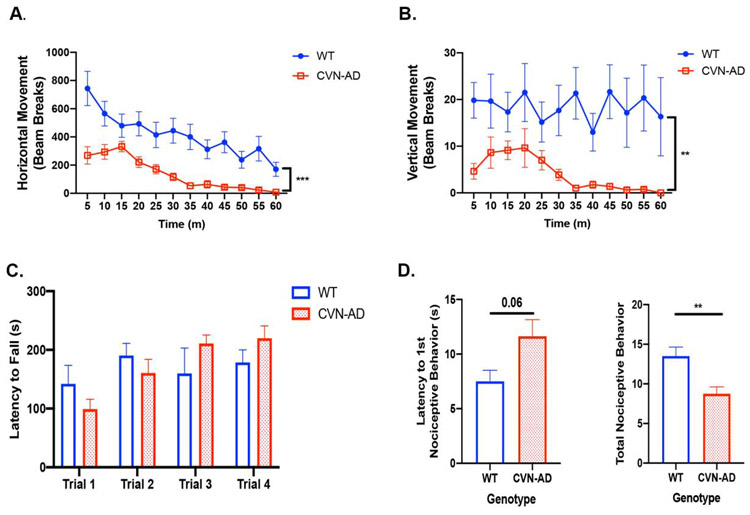
Alzheimer's Disease (AD) is the most prevalent form of dementia globally, and the number of individuals with AD diagnosis is expected to double by 2050. Numerous preclinical AD studies have shown that AD neuropathology accompanies alteration in learning and memory. However, less attention has been given to alterations in metabolism, sleep, and sensorimotor functional outcomes during AD pathogenesis. The objective of this study was to elucidate the extent to which metabolic activity, sleep-wake cycle, and sensorimotor function is impaired in APPSwDI/Nos2-/- (CVN-AD) transgenic mice. Female mice were used in this study because AD is more prevalent in women compared to men. We hypothesized that the presence of AD neuropathology in CVN-AD mice would accompany alterations in metabolic activity, sleep, and sensorimotor function. Our results showed that CVN-AD mice had significantly decreased energy expenditure compared to wild-type (WT) mice. An examination of associated functional outcome parameters showed that sleep activity was elevated during the awake (dark) cycle and as well as an overall decrease in spontaneous locomotor activity. An additional functional parameter, the nociceptive response to thermal stimuli, was also impaired in CVN-AD mice. Collectively, our results demonstrate CVN-AD mice exhibit alterations in functional parameters that resemble human-AD clinical progression.
Keywords: Alzheimer’s disease; Metabolism; Neuroinflammation; Sensorimotor; Sleep.
Copyright © 2020 Elsevier B.V. All rights reserved.
Conflict of interest statement
Figures


Similar articles
-
Sleep and EEG Power Spectral Analysis in Three Transgenic Mouse Models of Alzheimer's Disease: APP/PS1, 3xTgAD, and Tg2576.J Alzheimers Dis. 2018;64(4):1325-1336. doi: 10.3233/JAD-180260. J Alzheimers Dis. 2018. PMID: 29991134 Free PMC article.
-
Human apolipoprotein E4 targeted replacement in mice reveals increased susceptibility to sleep disruption and intermittent hypoxia.Am J Physiol Regul Integr Comp Physiol. 2012 Jul 1;303(1):R19-29. doi: 10.1152/ajpregu.00025.2012. Epub 2012 May 9. Am J Physiol Regul Integr Comp Physiol. 2012. PMID: 22573105 Free PMC article.
-
Sleep-Wake Cycle Dysfunction in the TgCRND8 Mouse Model of Alzheimer's Disease: From Early to Advanced Pathological Stages.PLoS One. 2015 Jun 15;10(6):e0130177. doi: 10.1371/journal.pone.0130177. eCollection 2015. PLoS One. 2015. PMID: 26076358 Free PMC article.
-
Sleep disorders and risk of alzheimer's disease: A two-way road.Ageing Res Rev. 2024 Nov;101:102514. doi: 10.1016/j.arr.2024.102514. Epub 2024 Sep 22. Ageing Res Rev. 2024. PMID: 39317268 Review.
-
Neuroendocrine-Metabolic Dysfunction and Sleep Disturbances in Neurodegenerative Disorders: Focus on Alzheimer's Disease and Melatonin.Neuroendocrinology. 2019;108(4):354-364. doi: 10.1159/000494889. Epub 2018 Oct 28. Neuroendocrinology. 2019. PMID: 30368508 Review.
Cited by
-
Progressive sleep disturbance in various transgenic mouse models of Alzheimer's disease.Front Aging Neurosci. 2023 May 19;15:1119810. doi: 10.3389/fnagi.2023.1119810. eCollection 2023. Front Aging Neurosci. 2023. PMID: 37273656 Free PMC article. Review.
-
Tissue-Nonspecific Alkaline Phosphatase in Central Nervous System Health and Disease: A Focus on Brain Microvascular Endothelial Cells.Int J Mol Sci. 2021 May 17;22(10):5257. doi: 10.3390/ijms22105257. Int J Mol Sci. 2021. PMID: 34067629 Free PMC article. Review.
-
Reduction of orexin-expressing neurons and a unique sleep phenotype in the Tg-SwDI mouse model of Alzheimer's disease.Front Aging Neurosci. 2025 Feb 4;17:1529769. doi: 10.3389/fnagi.2025.1529769. eCollection 2025. Front Aging Neurosci. 2025. PMID: 39968126 Free PMC article.
References
-
- 2019 Alzheimer's disease facts and figures, Alzheimer's & Dementia, 15 (2019) 321–387.
Publication types
MeSH terms
Grants and funding
LinkOut - more resources
Full Text Sources
Other Literature Sources
Medical
Molecular Biology Databases
