

Quantitative analysis of SARS-CoV-2 RNA from wastewater solids in communities with low COVID-19 incidence and prevalence
- PMID: 33137526
- PMCID: PMC7583624
- DOI: 10.1016/j.watres.2020.116560
Quantitative analysis of SARS-CoV-2 RNA from wastewater solids in communities with low COVID-19 incidence and prevalence
Abstract
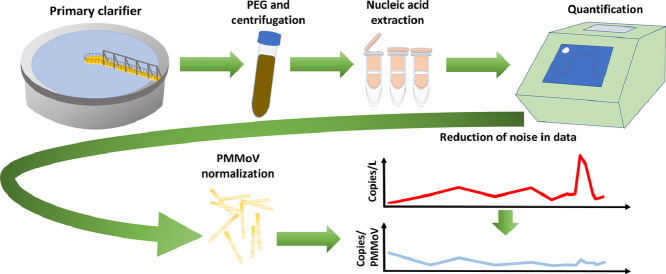
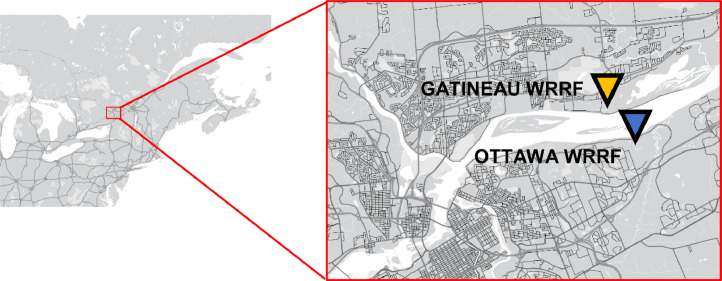
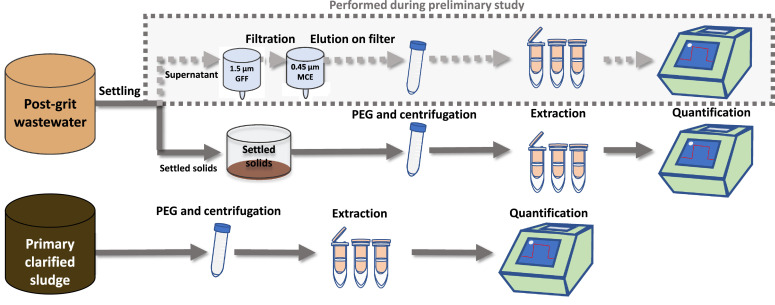
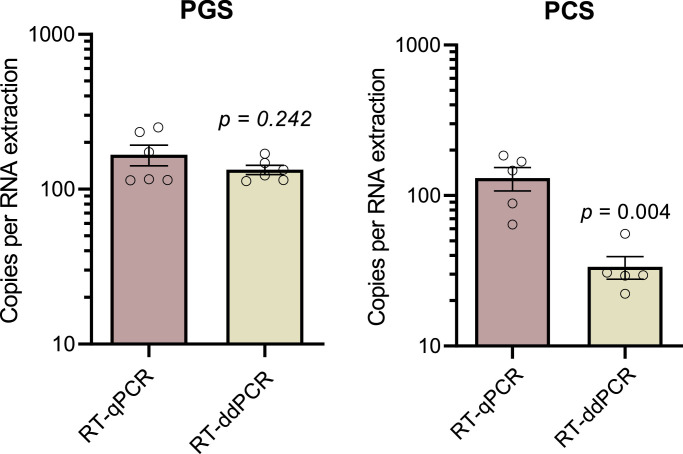
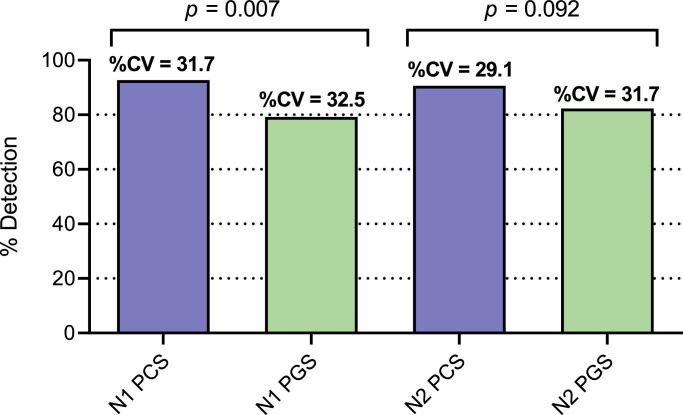
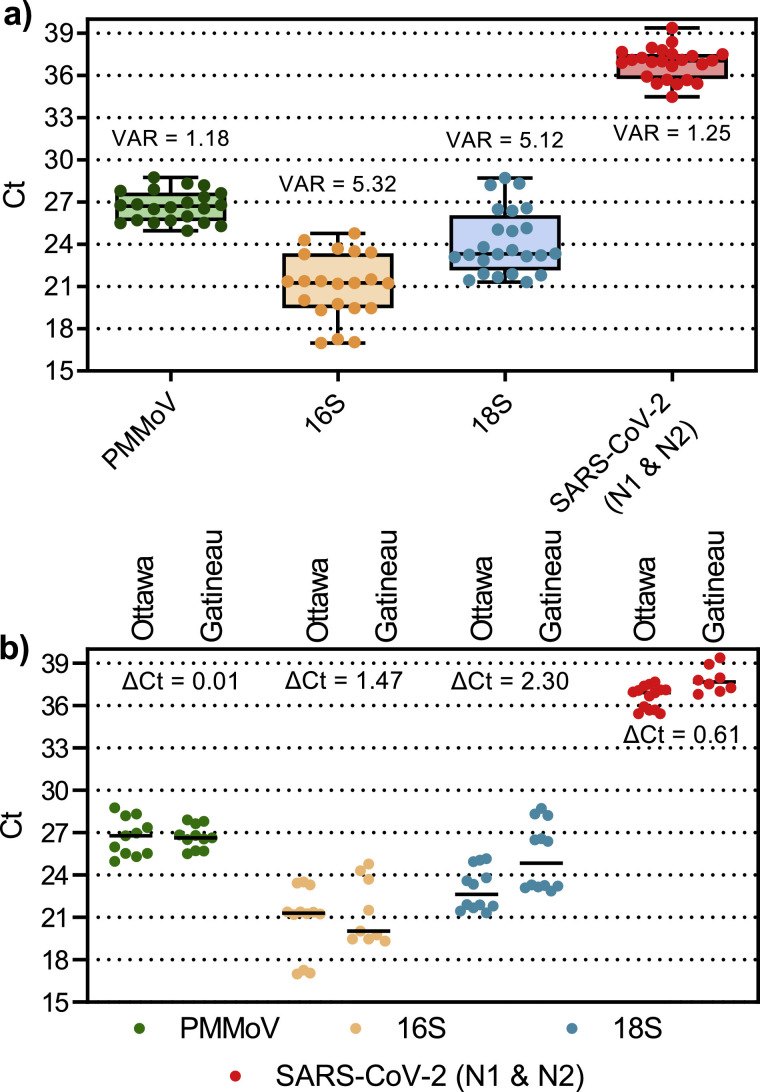
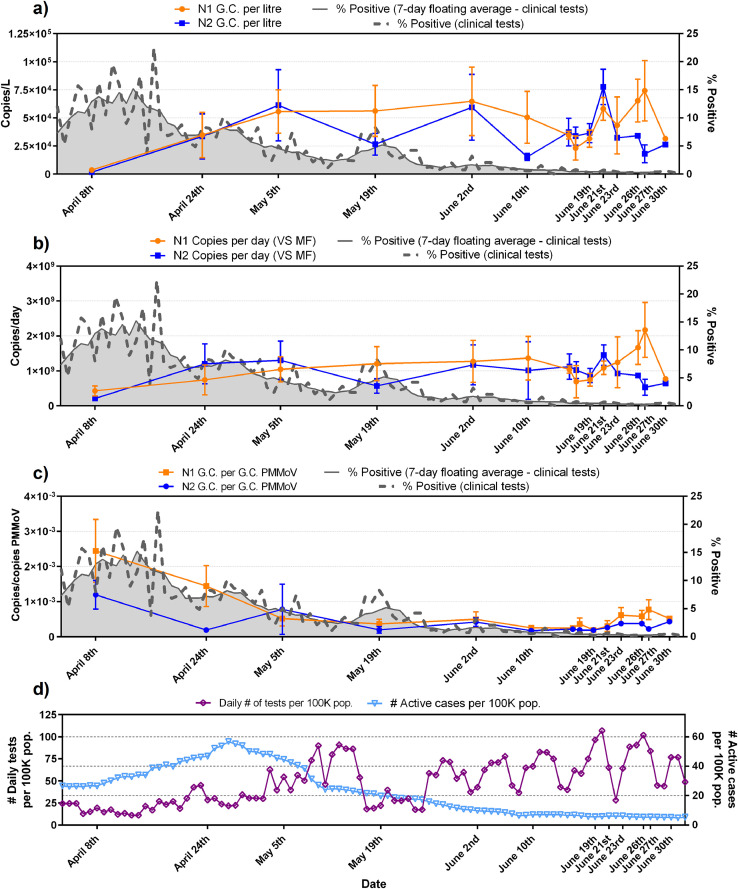
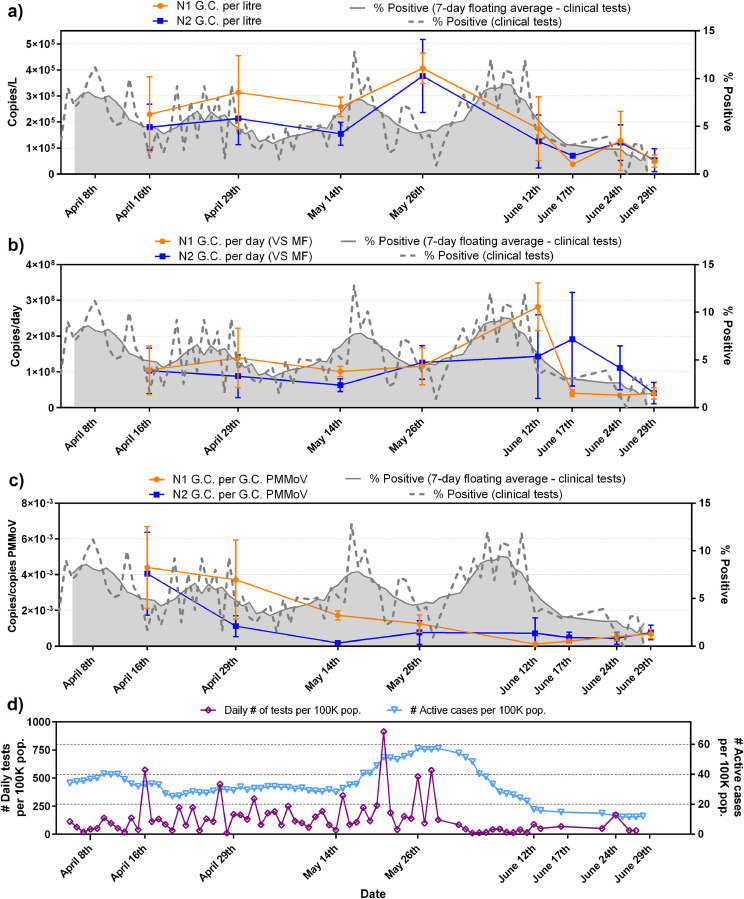
In the absence of an effective vaccine to prevent COVID-19 it is important to be able to track community infections to inform public health interventions aimed at reducing the spread and therefore reduce pressures on health-care, improve health outcomes and reduce economic uncertainty. Wastewater surveillance has rapidly emerged as a potential tool to effectively monitor community infections through measuring trends of RNA signal in wastewater systems. In this study SARS-CoV-2 viral RNA N1 and N2 gene regions are quantified in solids collected from influent post grit solids (PGS) and primary clarified sludge (PCS) in two water resource recovery facilities (WRRF) serving Canada's national capital region, i.e., the City of Ottawa, ON (pop. ≈ 1.1M) and the City of Gatineau, QC (pop. ≈ 280K). PCS samples show signal inhibition using RT-ddPCR compared to RT-qPCR, with PGS samples showing similar quantifiable concentrations of RNA using both assays. RT-qPCR shows higher frequency of detection of N1 and N2 gene regions in PCS (92.7, 90.6%, n = 6) as compared to PGS samples (79.2, 82.3%, n = 5). Sampling of PCS may therefore be an effective approach for SARS-CoV-2 viral quantification, especially during periods of declining and low COVID-19 incidence in the community. The pepper mild mottle virus (PMMoV) is determined to have a less variable RNA signal in PCS over a three month period for two WRRFs, regardless of environmental conditions, compared to Bacteroides 16S rRNA or human 18S rRNA, making PMMoV a potentially useful biomarker for normalization of SARS-CoV-2 signal. PMMoV-normalized PCS RNA signal from WRRFs of two cities correlated with the regional public health epidemiological metrics, identifying PCS normalized to a fecal indicator (PMMoV) as a potentially effective tool for monitoring trends during decreasing and low-incidence of infection of SARS-Cov-2 in communities.
Keywords: COVID-19; Primary clarified sludge; SARS-CoV-2; Solids; Virus; Wastewater.
Copyright © 2020. Published by Elsevier Ltd.
Conflict of interest statement
Declaration of Competing Interest The authors declare that no known competing financial interests or personal relationships could appear to influence the work reported in this manuscript.
Figures
References
-
- Ahmed W., Angel N., Edson J., Bibby K., Bivins A., O'Brien J.W., Choi P.M., Kitajima M., Simpson S.L., Li J., Tscharke B., Verhagen R., Smith W.J.M., Zaugg J., Dierens L., Hugenholtz P., Thomas K.V., Mueller J.F. First confirmed detection of SARS-CoV-2 in untreated wastewater in Australia: a proof of concept for the wastewater surveillance of COVID-19 in the community. Sci. Total Environ. 2020;728 doi: 10.1016/j.scitotenv.2020.138764. - DOI - PMC - PubMed
-
- Ahmed W., Bertsch P.M., Bivins A., Bibby K., Farkas K., Gathercole A., Haramoto E., Gyawali P., Korajkic A., McMinn B.R., Mueller J.F., Simpson S.L., Smith W.J.M., Symonds E.M., Thomas K.V., Verhagen R., Kitajima M. Comparison of virus concentration methods for the RT-qPCR-based recovery of murine hepatitis virus, a surrogate for SARS-CoV-2 from untreated wastewater. Sci. Total Environ. 2020;739 doi: 10.1016/j.scitotenv.2020.139960. - DOI - PMC - PubMed
-
- Alpaslan-Kocamemi, B., Kurt, H., Sait, A., Sarac, F., Saatci, A.M., Pakdemirli, B., 2020. SARS-CoV-2 detection in Istanbul wastewater treatment plant sludges. medRxiv 2020.05.12.20099358. 10.1101/2020.05.12.20099358. - DOI
-
- APHA . 17th ed. APHA; 1989. Standard Methods for the Examination of Water and Wastewater. Washington, DC.
-
- APHA . Standard Methods for the Examination of Water and Wastewater. 22nd ed. APHA, WEF, AWWA; Washington, D.C: 2012.
MeSH terms
Substances
LinkOut - more resources
Full Text Sources
Other Literature Sources
Medical
Miscellaneous
